Moody’s upgrades Agnico Eagle’s rating to A3 on debt reduction

Introduction & Market Context
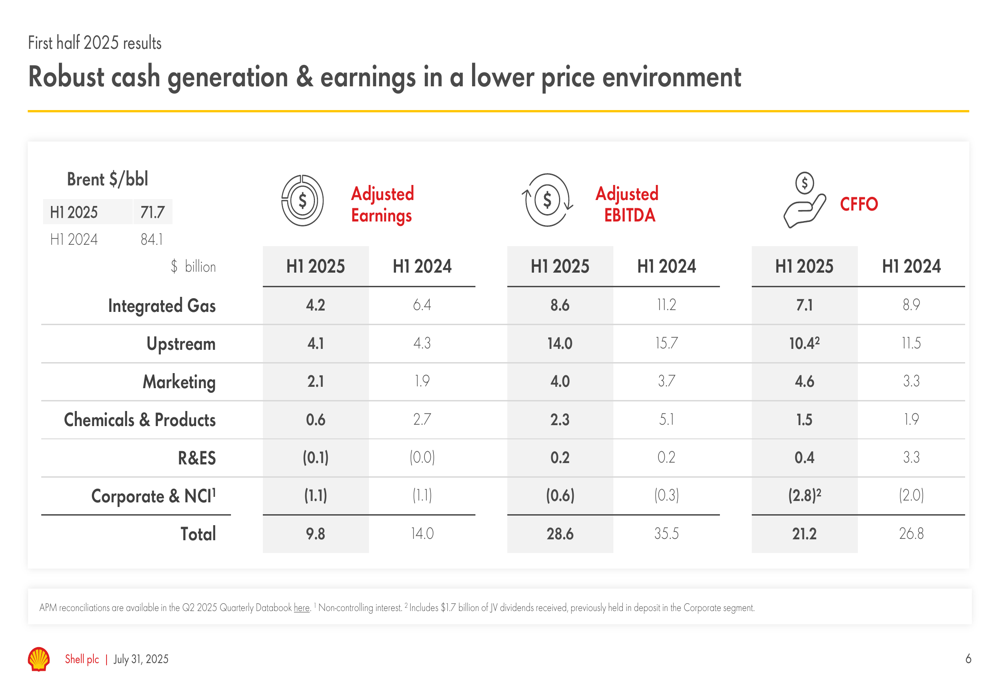
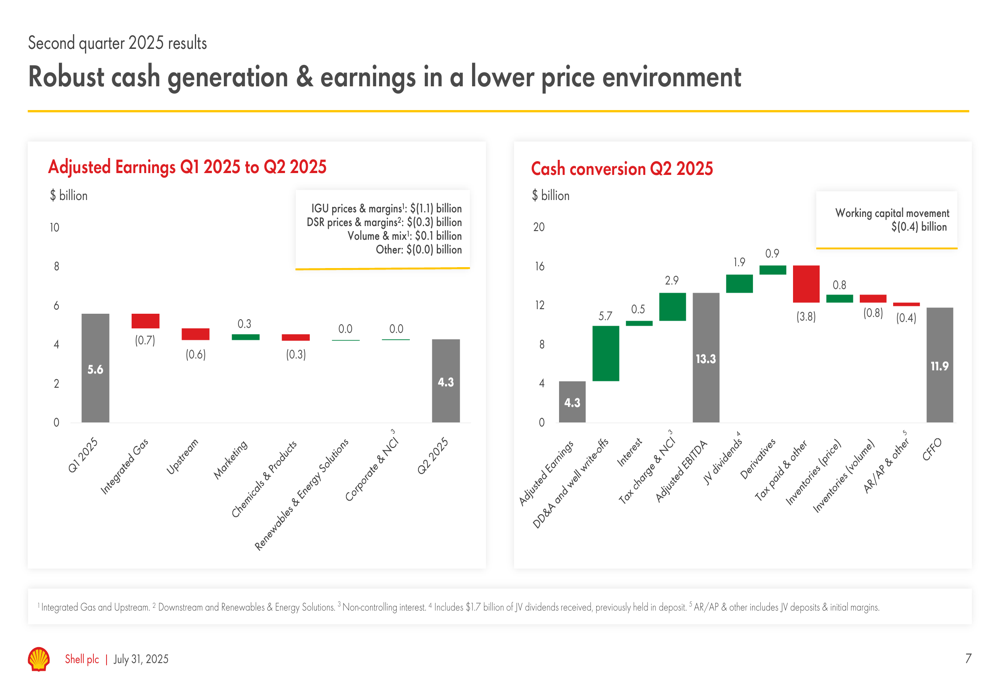
Shell plc (NYSE:SHEL) released its second quarter 2025 results on July 31, showcasing resilient cash flow generation despite operating in a lower commodity price environment. The energy giant reported adjusted earnings of $4.3 billion for Q2 2025, down from $5.6 billion in the previous quarter and reflecting broader industry challenges as Brent crude prices averaged $71.7/bbl in the first half of 2025 compared to $84.1/bbl in the same period of 2024.
The company’s share price had declined 1.9% to $71.72 in the trading session prior to the results announcement, suggesting investors may have anticipated some of the earnings pressure reflected in the quarterly numbers.
Quarterly Performance Highlights
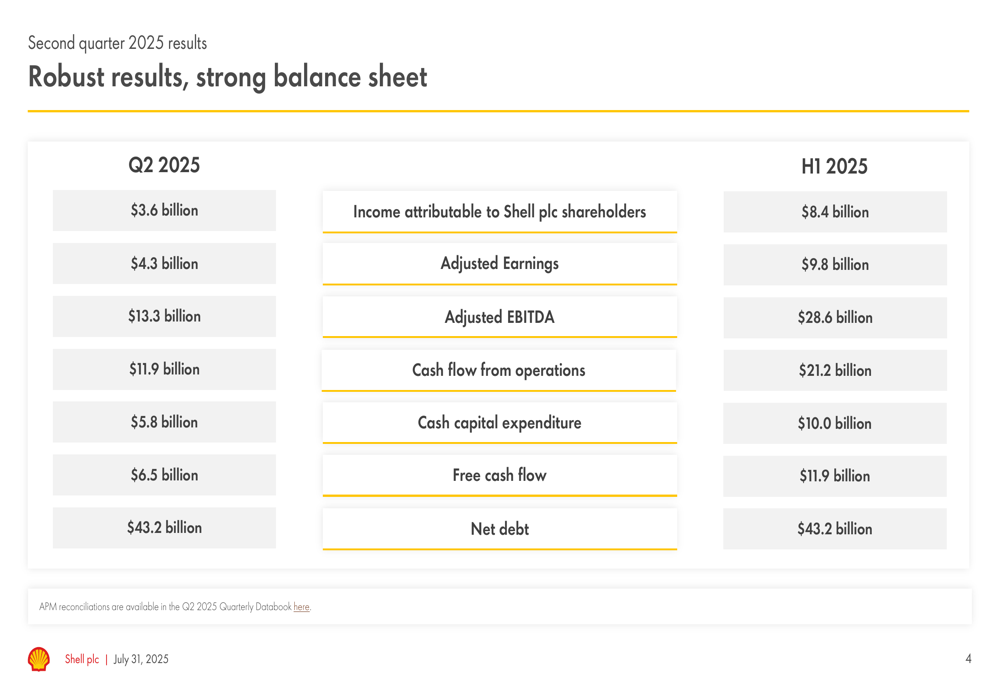
Shell’s Q2 2025 results demonstrated the company’s ability to generate substantial cash flow even as earnings declined. Cash flow from operations (CFFO) reached $11.9 billion for the quarter, supporting $5.7 billion in shareholder distributions while maintaining a strong balance sheet with 19% gearing.
As shown in the following key metrics summary:
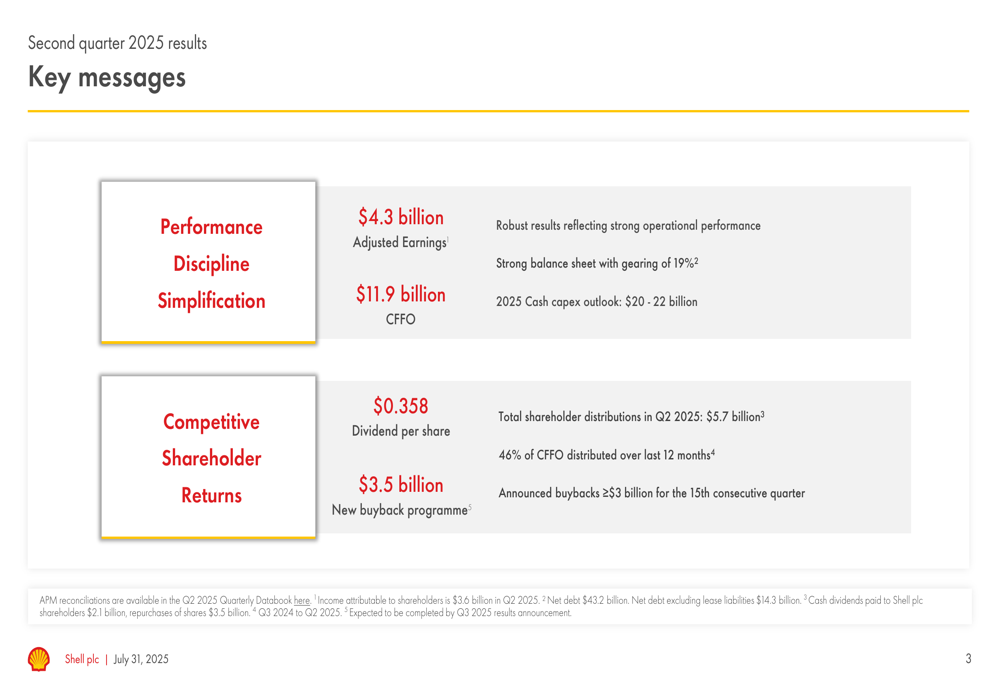
Income attributable to Shell shareholders totaled $3.6 billion for Q2 2025, while adjusted EBITDA reached $13.3 billion. The company generated $6.5 billion in free cash flow during the quarter, maintaining its financial flexibility despite market headwinds.
Detailed Financial Analysis
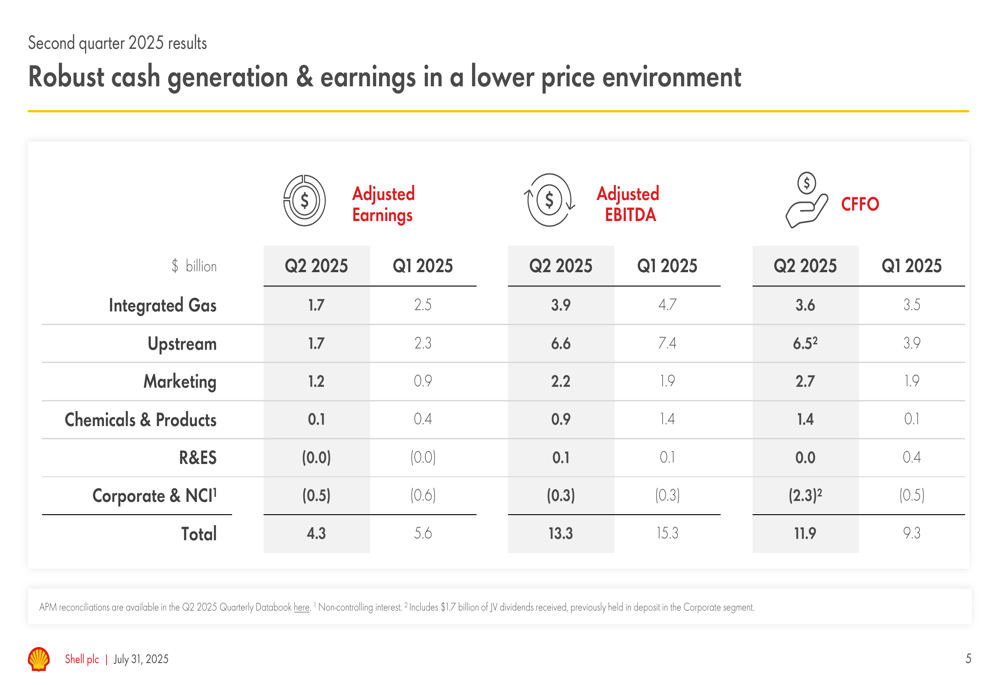
Shell’s performance varied across business segments, with all major divisions experiencing quarter-over-quarter declines in adjusted earnings except for Marketing, which improved from $0.9 billion in Q1 to $1.2 billion in Q2. The Integrated Gas and Upstream segments each contributed $1.7 billion to adjusted earnings, down from $2.5 billion and $2.3 billion respectively in the previous quarter.
The following breakdown illustrates performance by business segment:
When comparing first-half performance year-over-year, the impact of lower commodity prices becomes more apparent. H1 2025 adjusted earnings of $9.8 billion represent a 30% decline from $14.0 billion in H1 2024, with the Integrated Gas and Chemicals & Products segments showing the most significant decreases.
Shell provided a detailed explanation of the quarter-over-quarter earnings decline, attributing approximately $1.1 billion of the decrease to lower prices and margins in the Integrated Gas unit, with an additional $0.3 billion impact from Downstream prices and margins.
The following chart illustrates these factors:
Strategic Initiatives
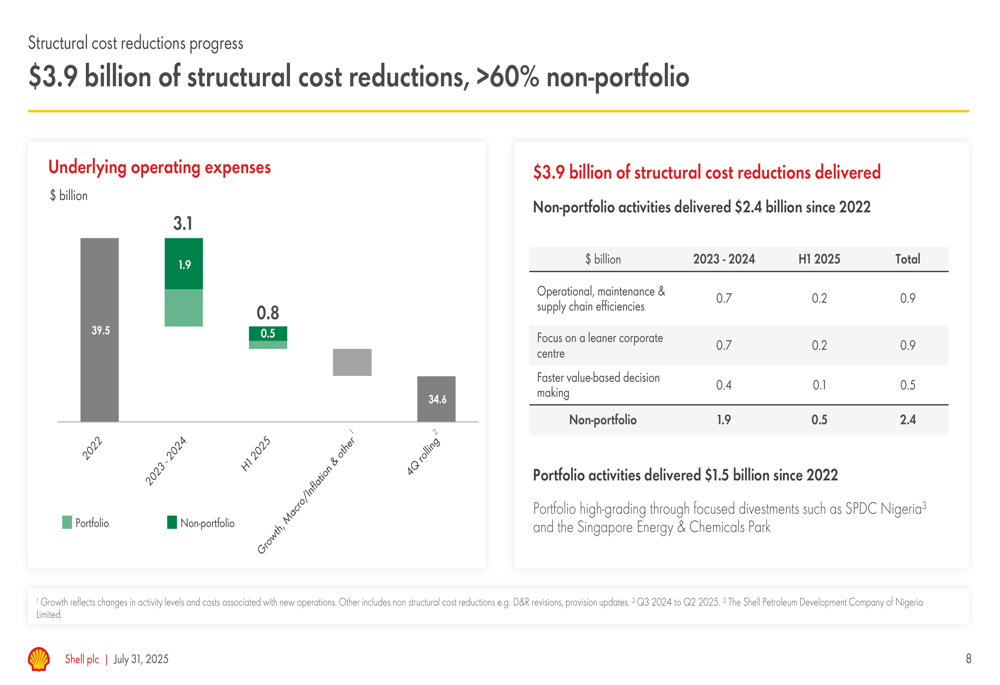
Shell continues to make progress on its structural cost reduction program, reporting $3.9 billion in reductions to date, with over 60% coming from non-portfolio initiatives. The company has reduced its underlying operating expenses from $39.5 billion in 2022 to $34.6 billion on a rolling four-quarter basis.
As shown in this cost reduction breakdown:
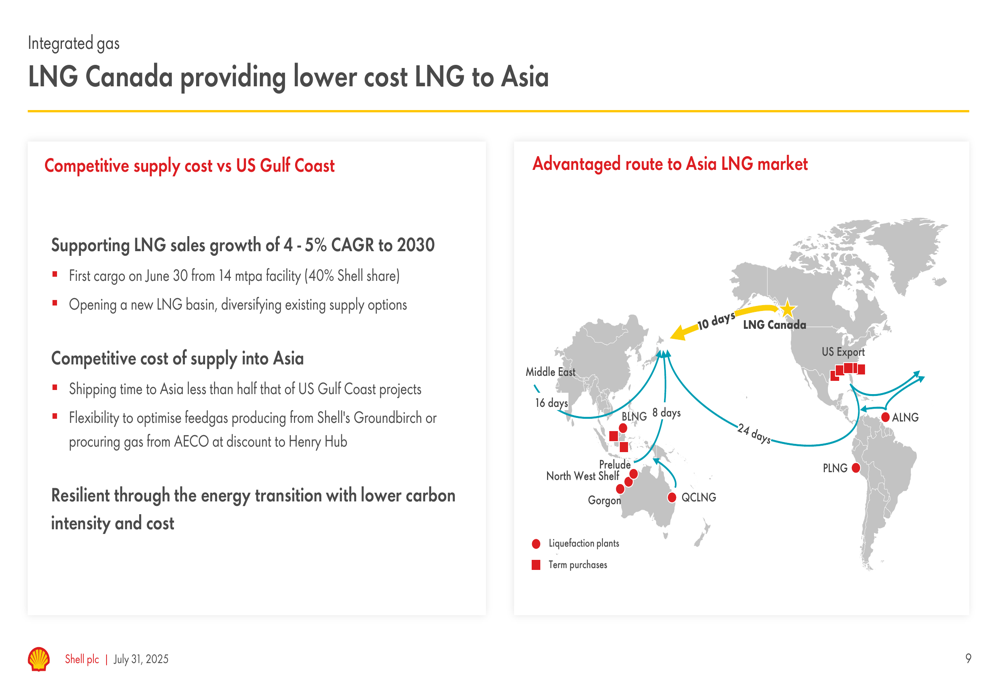
A significant strategic milestone was achieved with the first cargo from the LNG Canada project on June 30. This facility, in which Shell holds a 40% stake, represents an important competitive advantage in supplying Asian markets with lower-cost LNG compared to U.S. Gulf Coast projects, with shipping times less than half those from the Gulf Coast.
The following illustration highlights LNG Canada’s strategic positioning:
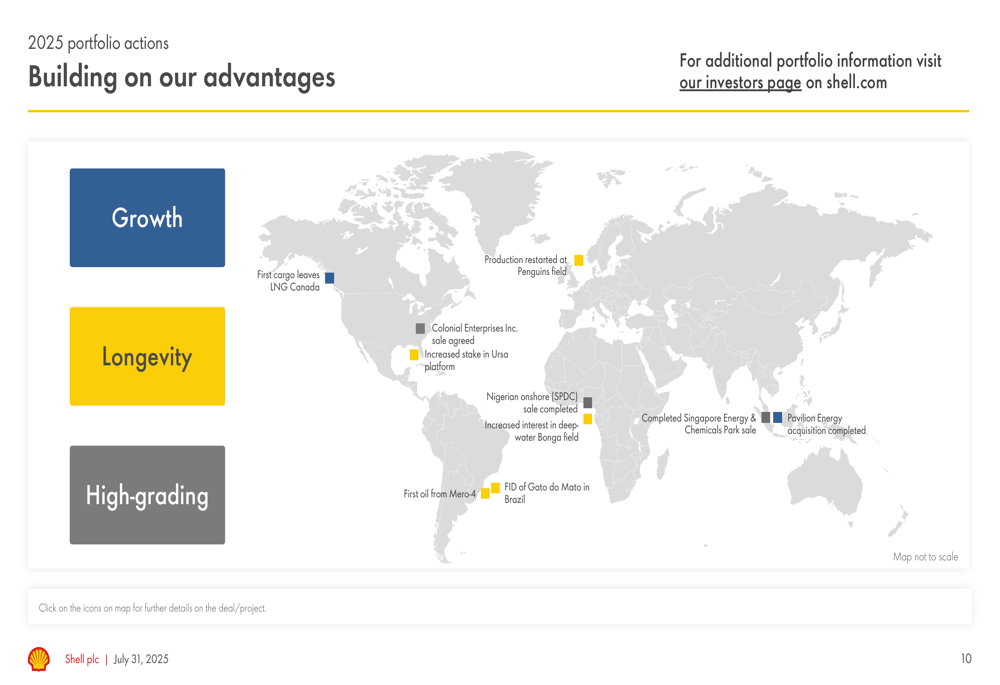
Shell’s global portfolio actions in 2025 demonstrate its balanced approach to growth, longevity, and high-grading of assets. Notable developments include the restart of production at the Penguins field and continued progress on various projects worldwide.
Forward-Looking Statements
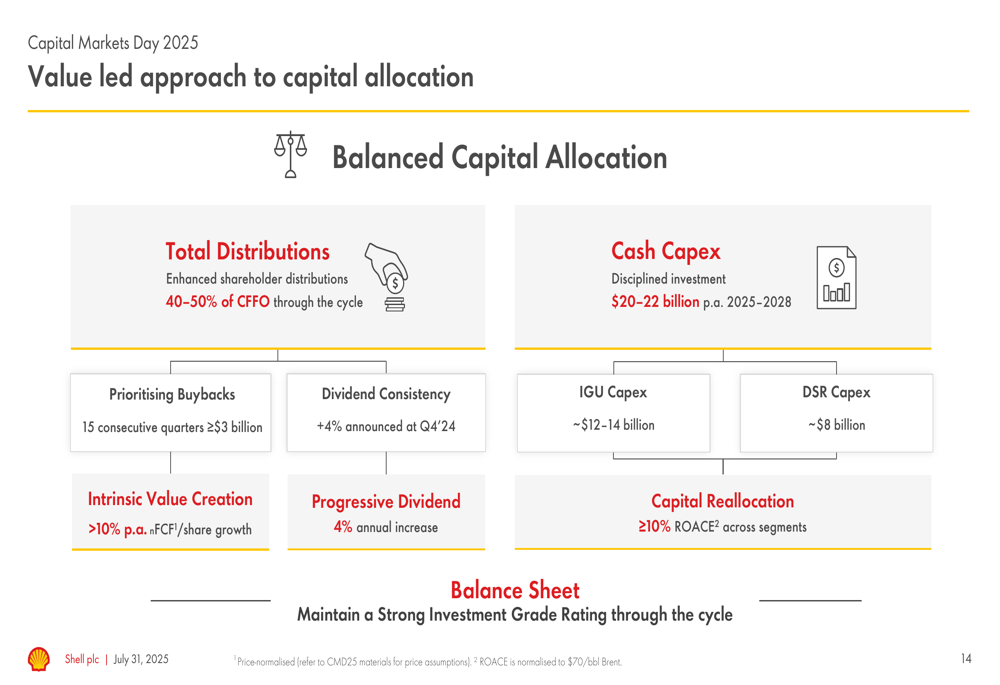
Looking ahead, Shell reaffirmed its commitment to delivering more value with less emissions, as outlined in its Capital Markets Day 2025 strategy. The company targets more than 10% net free cash flow per share growth annually through 2030 while distributing 40-50% of CFFO to shareholders through the cycle.
Shell’s forward-looking commitments include:
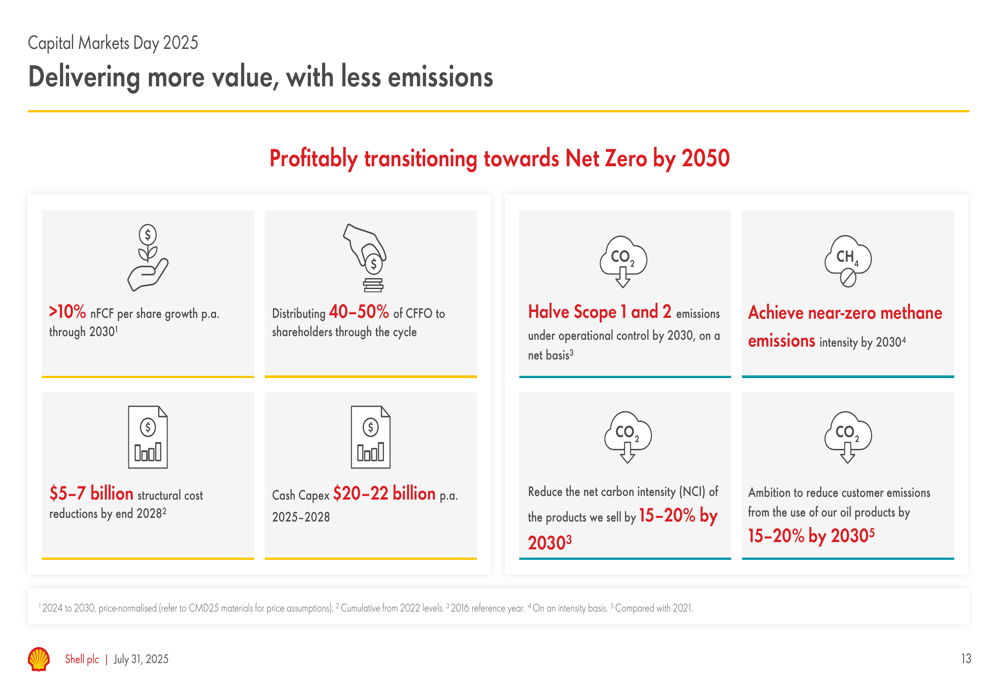
The company’s capital allocation approach emphasizes balanced investment, with cash capex guidance of $20-22 billion annually from 2025-2028. Shell has prioritized share buybacks for 15 consecutive quarters at levels exceeding $3 billion, while maintaining a progressive dividend policy with a 4% annual increase announced at Q4 2024.
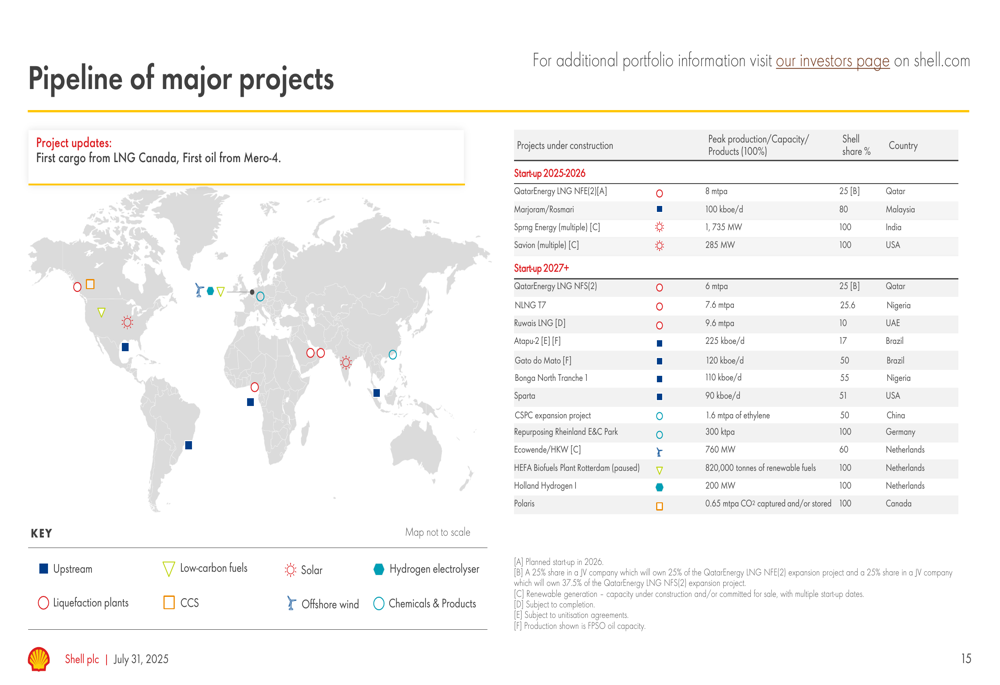
Shell’s pipeline of major projects supports its long-term growth strategy, with developments across upstream, liquefaction, chemicals, and low-carbon initiatives. Recent milestones include the first cargo from LNG Canada and first oil from Mero-4.
In conclusion, Shell’s Q2 2025 results demonstrate the company’s resilience in a challenging price environment, with robust cash generation supporting continued shareholder returns despite lower earnings. The strategic focus on cost reduction, portfolio optimization, and advantaged LNG positions Shell to navigate the ongoing energy transition while delivering on its financial commitments to investors.
Full presentation:
This article was generated with the support of AI and reviewed by an editor. For more information see our T&C.