S&P 500 pulls back from record high as chip-led slump in tech weighs

Introduction & Market Context
SmartFinancial Inc . (NASDAQ:NYSE:SMBK) held its first quarter 2025 earnings call on April 22, 2025, revealing continued momentum in its Southeast banking franchise. The company reported diluted operating earnings per share of $0.67 for Q1 2025, building on the previous quarter’s $0.57 EPS that had exceeded analyst expectations. This performance comes as the bank continues to benefit from population migration into its core markets and strategic investments in technology and talent.
Following the release of Q4 2024 results in January, SmartFinancial’s stock had risen 1.55% in premarket trading. However, the company’s stock has seen some pressure recently, trading at $28.34 as of April 21, 2025, down from its 52-week high of $37.72 but well above its 52-week low of $19.89.
Quarterly Performance Highlights
SmartFinancial reported solid financial performance across key metrics for Q1 2025, demonstrating continued execution of its growth strategy. The company’s total assets reached $5.4 billion, supported by annualized organic loan growth of 9% and deposit growth of 10% quarter-over-quarter.
As shown in the following comprehensive overview of quarterly performance metrics:
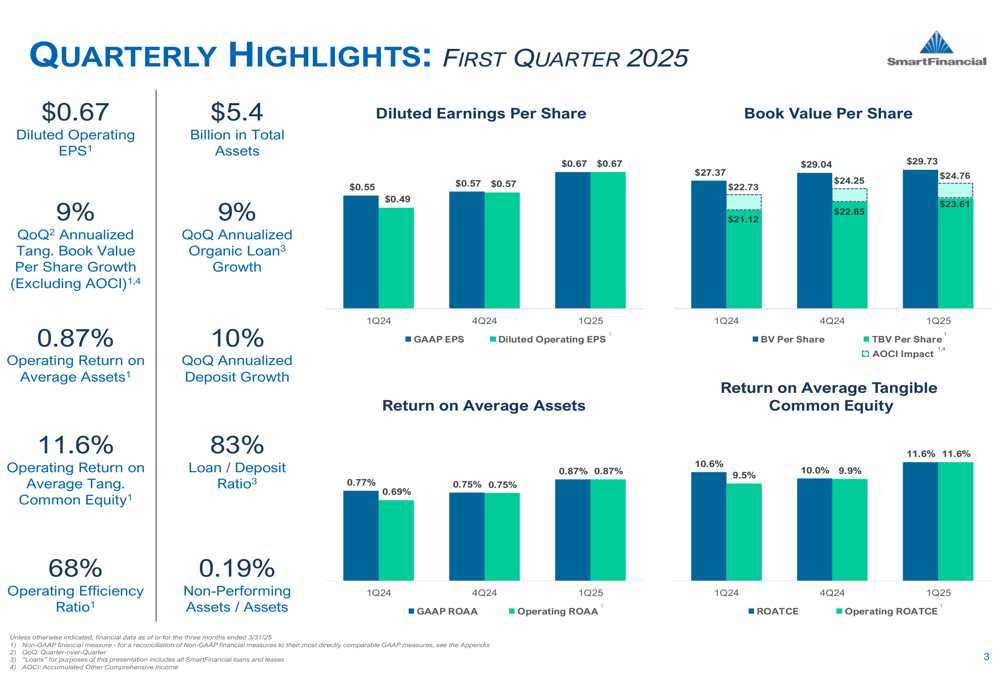
The company’s profitability metrics showed strength with an operating return on average assets of 0.87% and operating return on average tangible common equity of 11.6%. The efficiency ratio stood at 68%, reflecting the company’s ongoing focus on expense management while investing in growth.
Asset quality remained strong with non-performing assets to total assets at just 0.19%, highlighting the company’s disciplined underwriting standards. The loan-to-deposit ratio of 83% indicates room for additional lending growth while maintaining appropriate liquidity.
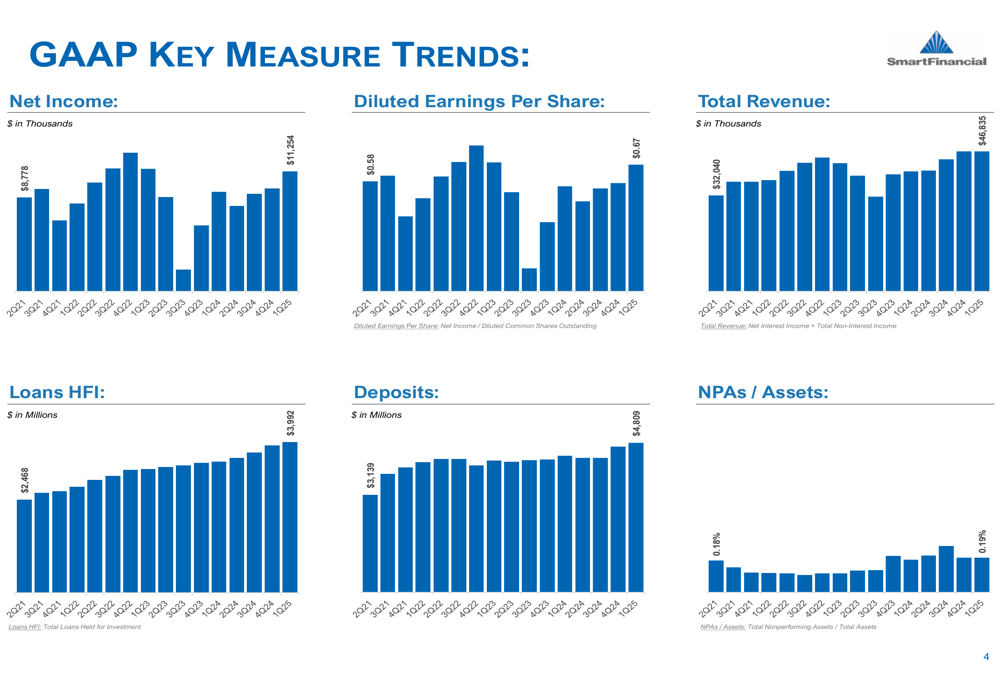
The following chart illustrates key GAAP performance trends over time:
Strategic Initiatives
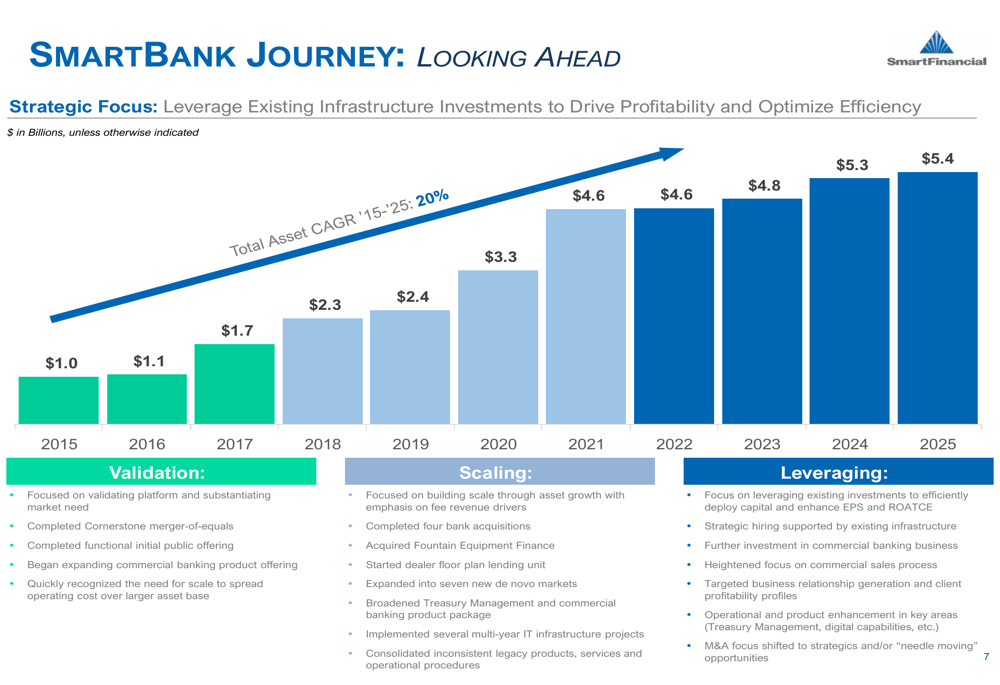
SmartFinancial continues to execute on its strategic roadmap, which has evolved from a validation phase (2015-2017) through scaling (2018-2022) to the current leveraging phase (2023-2025). This strategic evolution has driven impressive growth, with total assets increasing at a compound annual growth rate of 20% from 2015 to 2025.
The company’s strategic journey and asset growth are illustrated in this timeline:
A key component of SmartFinancial’s strategy is its focus on expanding in high-growth Southeast markets that are experiencing significant population migration. According to data presented, the South saw population growth of 1.1% (1,423,260 people) from July 2022 to July 2023, far outpacing other regions of the country.
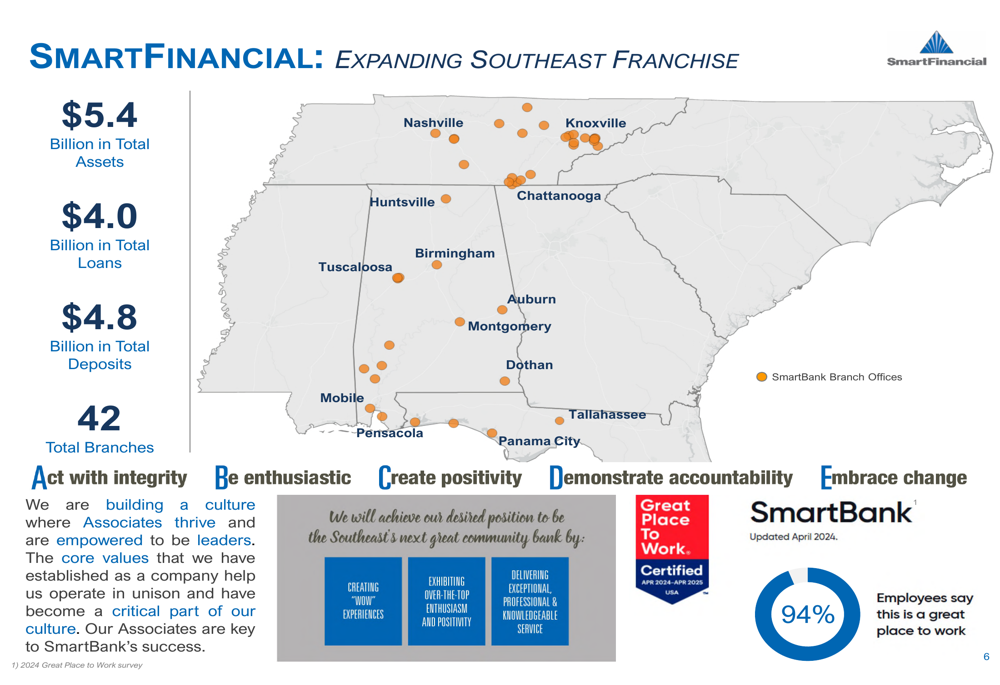
The company’s market presence spans Tennessee, Alabama, and coastal regions, with 42 total branches and a strong emphasis on relationship banking rather than transactional business. This geographic positioning in growth markets provides a tailwind for continued expansion.
As shown in the following regional breakdown:
During the previous earnings call in January, CEO Billy Carroll had remarked, "We are seeing the inflection and the movement in our numbers," highlighting the company’s growth trajectory. The Q1 2025 results appear to confirm this positive momentum.
Detailed Financial Analysis
SmartFinancial’s loan portfolio has grown at a compound annual rate of 13% since 2020, reaching $3.99 billion in Q1 2025. The average loan yield (excluding accretion and fees) stood at 5.88% for the quarter, slightly up from 5.86% for full-year 2024.
The loan portfolio composition and growth trends are detailed in the following chart:
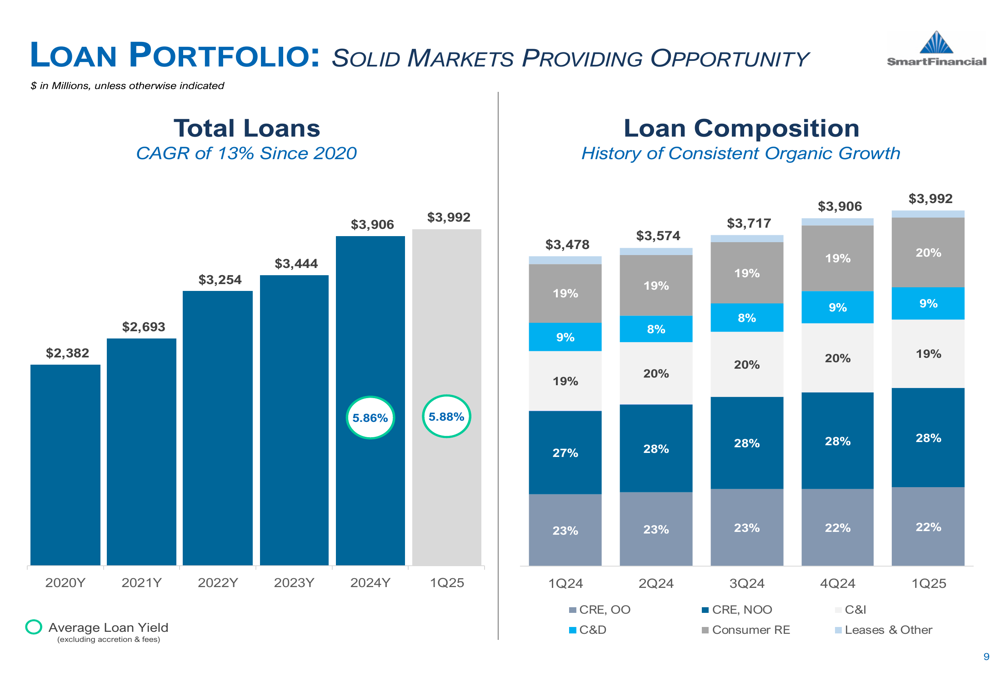
The company maintains a well-balanced loan exposure across different sectors, with non-owner occupied commercial real estate representing 28% of total loans and construction and development exposure at 9%. Within the non-owner occupied CRE segment, the largest concentration is in hotel and hospitality (32%), followed by multifamily (22%).
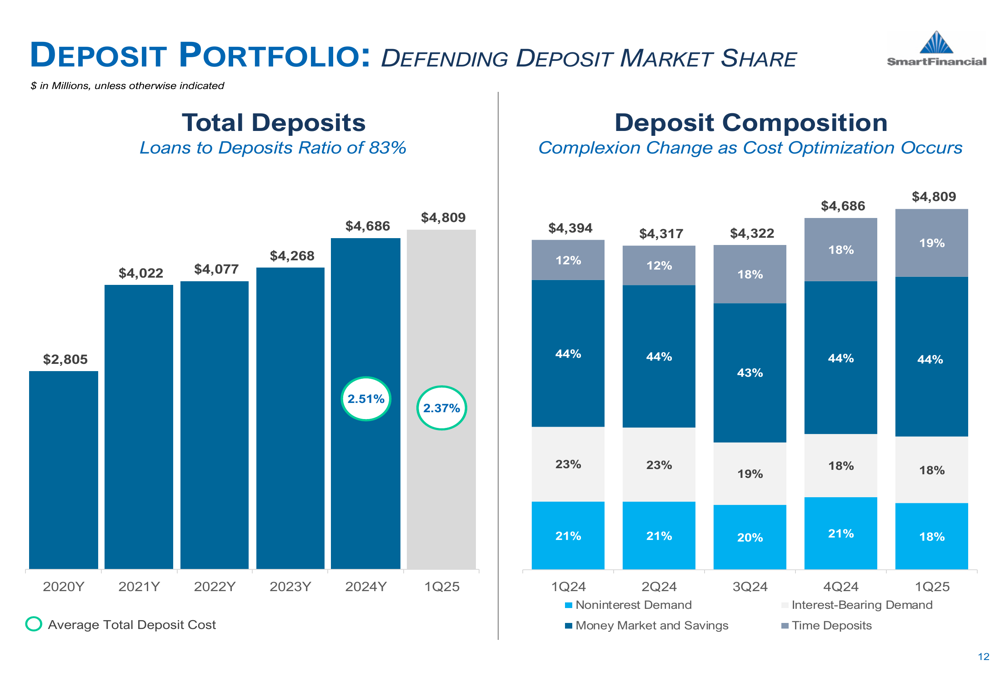
On the funding side, total deposits reached $4.81 billion in Q1 2025, up from $4.69 billion at year-end 2024. The average total deposit cost decreased to 2.37% in Q1 2025 from 2.51% in full-year 2024, suggesting the beginning of funding cost relief as the Federal Reserve considers rate cuts.
The deposit composition and growth are illustrated in this chart:
Asset quality metrics remain strong, with the allowance for credit losses at 1.09% of loans held for investment. The company’s conservative underwriting approach continues to pay dividends with minimal credit issues.
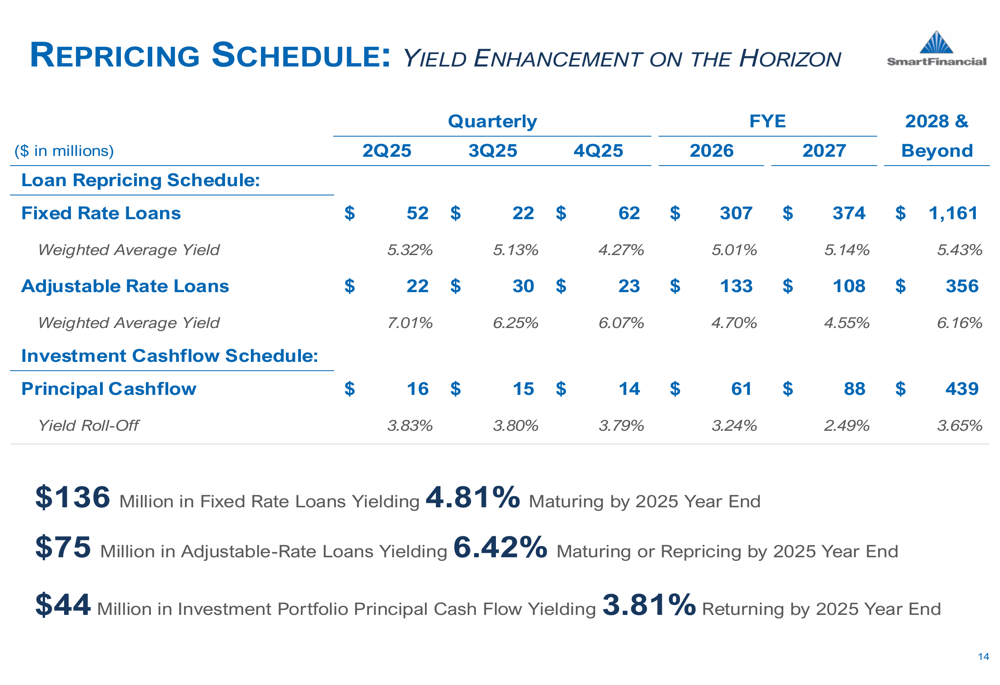
Looking ahead, SmartFinancial has significant opportunities for yield enhancement as loans reprice. The company has $136 million in fixed-rate loans yielding 4.81% maturing by year-end 2025, and $75 million in adjustable-rate loans yielding 6.42% maturing or repricing in the same period.
The loan repricing schedule is detailed in the following chart:
Capital Position and Shareholder Returns
SmartFinancial maintains a strong capital position, with key ratios well above regulatory requirements. The tangible common equity to tangible assets ratio stood at 8.13% in Q1 2025, while the total capital ratio was 12.00%.
The company’s tangible book value per share has shown consistent growth, reaching $23.61 in Q1 2025 (excluding accumulated other comprehensive income). This represents significant value creation for shareholders over time.
The capital position and tangible book value growth are illustrated in this chart:
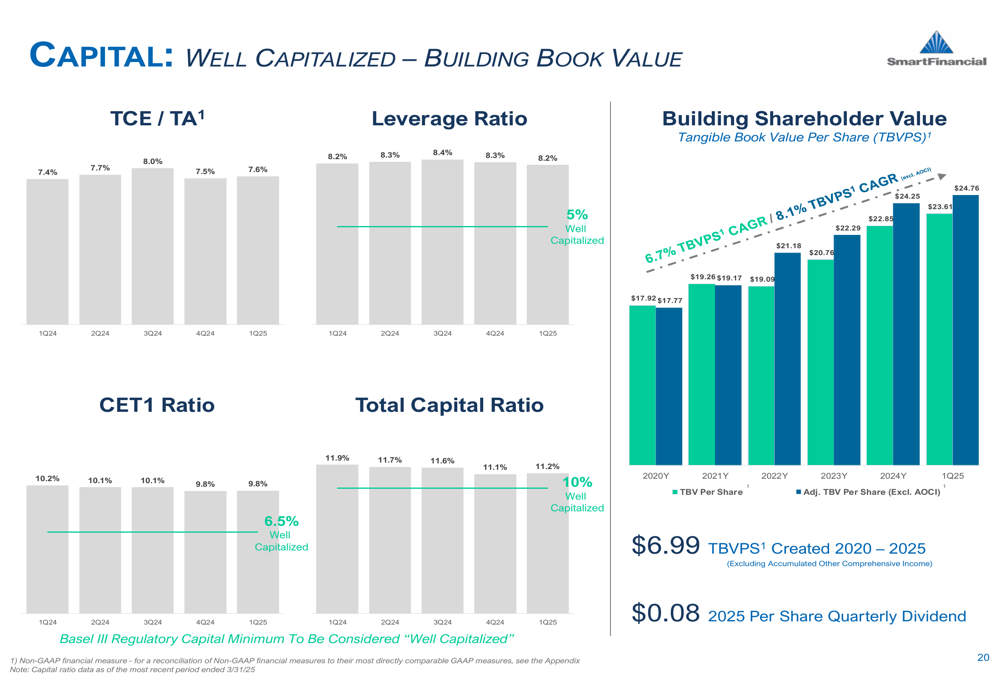
The company declared a quarterly dividend of $0.08 per share for Q1 2025, continuing its commitment to returning capital to shareholders while maintaining sufficient resources for growth.
Forward-Looking Statements
SmartFinancial’s management remains optimistic about the company’s growth prospects for the remainder of 2025. In the previous earnings call, the company had set a target of achieving $50 million in quarterly operating revenue by the end of 2025, and the Q1 results suggest progress toward that goal.
The company expects continued margin expansion as higher-yielding loans replace lower-yielding assets and deposit costs stabilize or decline. Management anticipates expense growth in the 5-7% range, primarily driven by investments in talent acquisition.
SmartFinancial’s strategic focus remains on defending deposit market share, maintaining strong credit quality, and capitalizing on growth opportunities in its Southeast markets. The company’s history of defending book value and delivering shareholder value positions it well for continued success in a competitive banking landscape.
As CFO Ron Grodzinski noted in the previous earnings call, "We will be creating that operating leverage throughout 2025," and the Q1 results appear to validate this strategy with improved profitability metrics and continued balance sheet growth.
Full presentation:
This article was generated with the support of AI and reviewed by an editor. For more information see our T&C.