US stock futures muted as rate cut bets wane ahead of Jackson Hole

South State Corporation (NYSE:SSB) presented its first quarter 2025 earnings results on April 25, revealing significant growth driven by the completion of its acquisition of Independent Bank (NASDAQ:INDB) Group (NASDAQ:IBTX). The presentation highlighted the company’s strategic positioning in high-growth Southern markets and detailed several one-time transactions that substantially impacted reported versus adjusted financial results.
Executive Summary
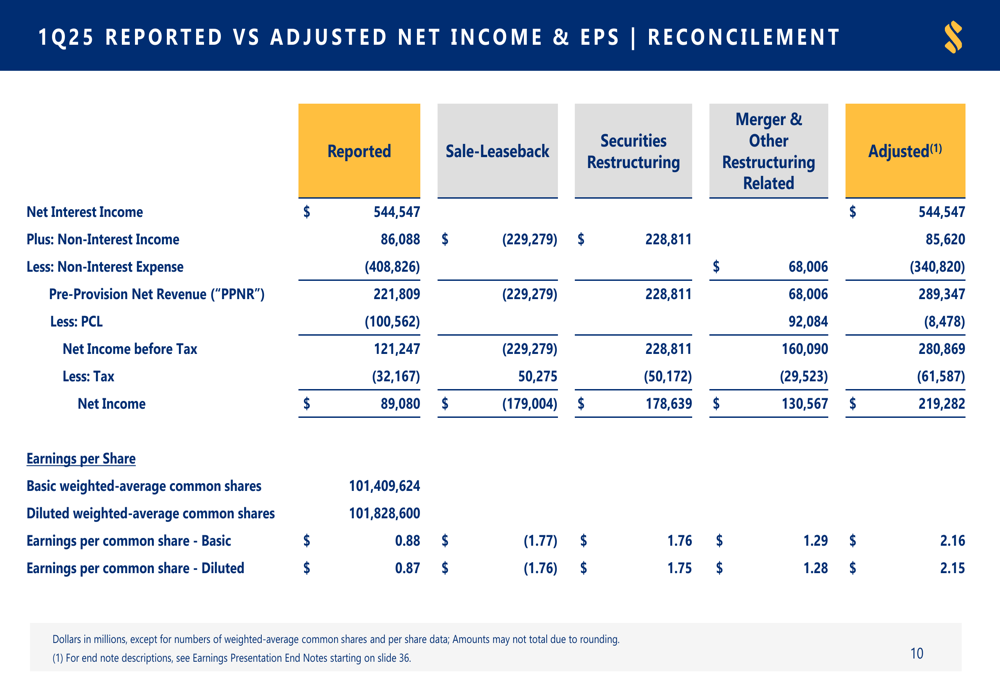
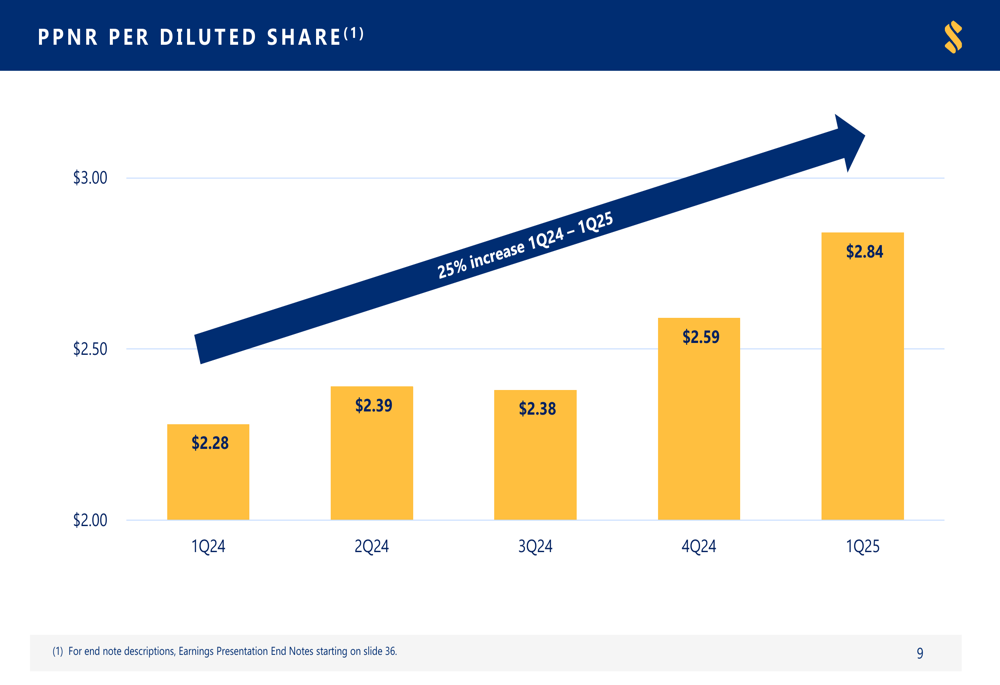
South State reported diluted earnings per share of $0.87 for Q1 2025, but adjusted EPS reached $2.15 after accounting for one-time items related to a sale-leaseback transaction and securities restructuring. The company’s pre-provision net revenue (PPNR) grew to $289.3 million, representing a 25% year-over-year increase in PPNR per share.
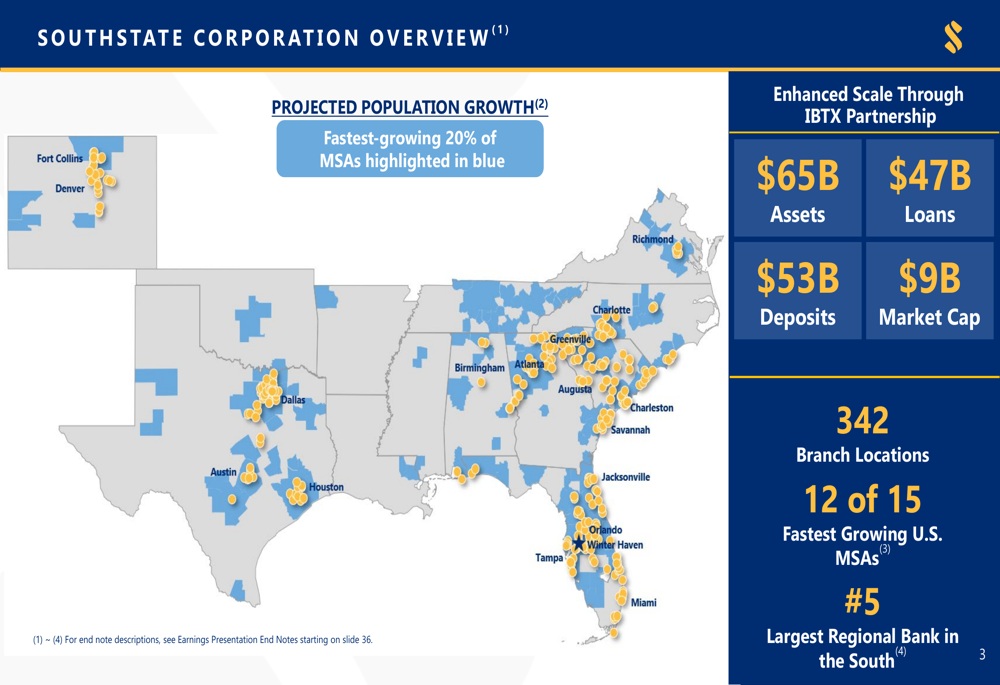
The acquisition of Independent Bank Group significantly expanded South State’s footprint, boosting total assets to $65 billion, loans to $47 billion, and deposits to $53 billion. The company now operates 342 branch locations and ranks as the fifth-largest regional bank in the South.
As shown in the following overview of South State’s key metrics and market position:
Strategic Initiatives
South State’s acquisition strategy has focused on expanding in high-growth markets throughout the Southern United States. The company’s presentation emphasized that its 8-state branch footprint would represent the world’s third-largest economy if measured as a country, highlighting the economic significance of its operating regions.
The company’s strategic positioning is illustrated in this map showing its presence in high-growth markets:
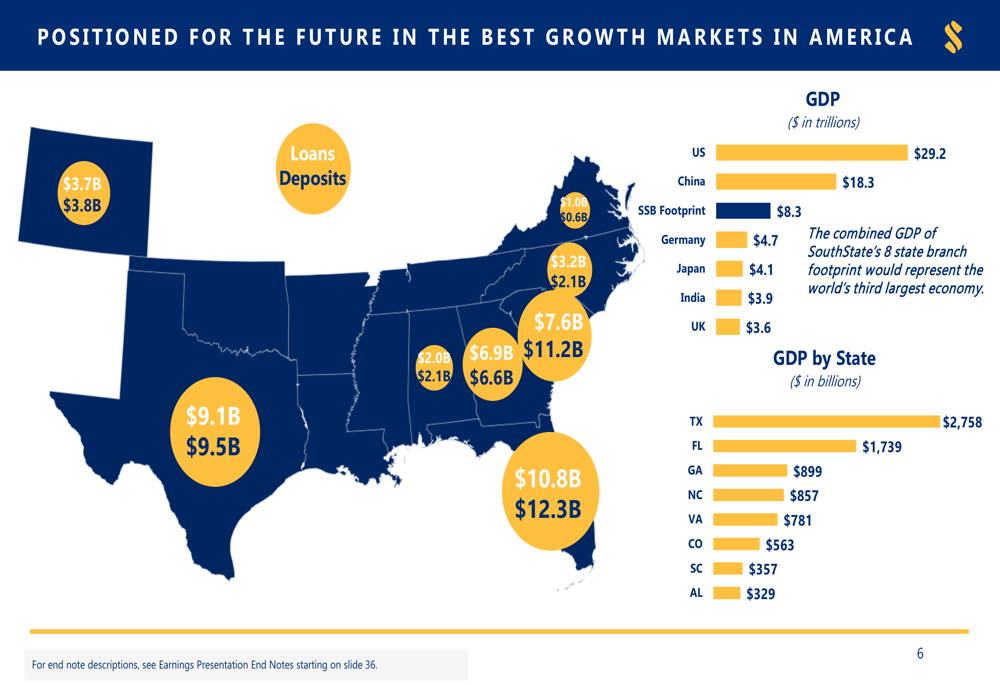
South State has benefited from significant population migration trends, with the South gaining over 2.8 million residents between April 2020 and July 2024, while other regions experienced population losses. This demographic shift supports the company’s focus on Southern markets, which are projected to continue growing faster than the national average through 2030.
The company’s competitive advantage is built on three pillars: geography (targeting fast-growing markets), scale (operating in the regulatory sweet spot of $60-80 billion in assets), and business model (emphasizing local market leadership with income statement control).
Quarterly Performance Highlights
South State’s Q1 2025 results were significantly impacted by several one-time transactions. The company executed a sale-leaseback transaction resulting in a net gain of $229 million, while simultaneously restructuring $1.8 billion of securities, resulting in a $229 million loss. These transactions, along with merger-related expenses, created a substantial difference between reported and adjusted financial metrics.
The reconciliation between reported and adjusted results is detailed in the following chart:
The company’s pre-provision net revenue (PPNR) per diluted share has shown consistent growth over the past five quarters, increasing from $2.28 in Q1 2024 to $2.84 in Q1 2025, representing a 25% year-over-year improvement. This trend demonstrates the company’s underlying earnings power beyond the one-time adjustments.
The PPNR growth trend is illustrated in this chart:
Detailed Financial Analysis
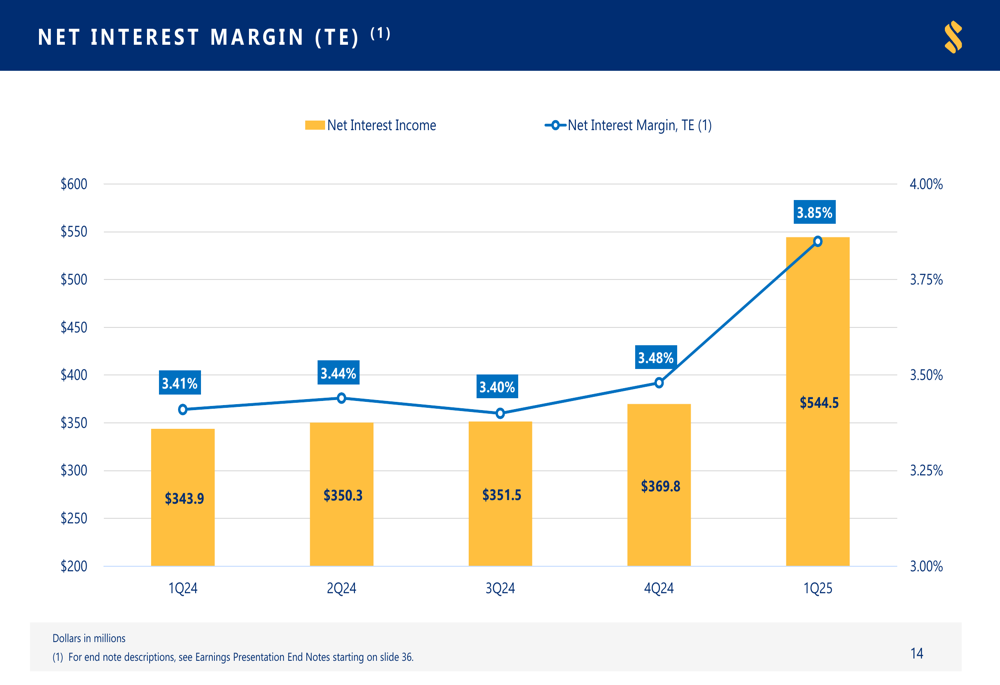
South State’s net interest margin (NIM) improved significantly to 3.85% in Q1 2025, up from 3.48% in Q4 2024 and 3.41% in Q1 2024. This improvement was accompanied by substantial growth in net interest income, which reached $544.5 million in Q1 2025, compared to $369.8 million in the previous quarter.
The net interest margin trend is shown in the following chart:
The company’s loan portfolio reached $46.8 billion as of March 31, 2025, with a diversified mix across investor commercial real estate (36%), consumer real estate (21%), commercial and industrial (17%), owner-occupied commercial real estate (16%), construction and development loans (8%), and consumer/other loans (2%).
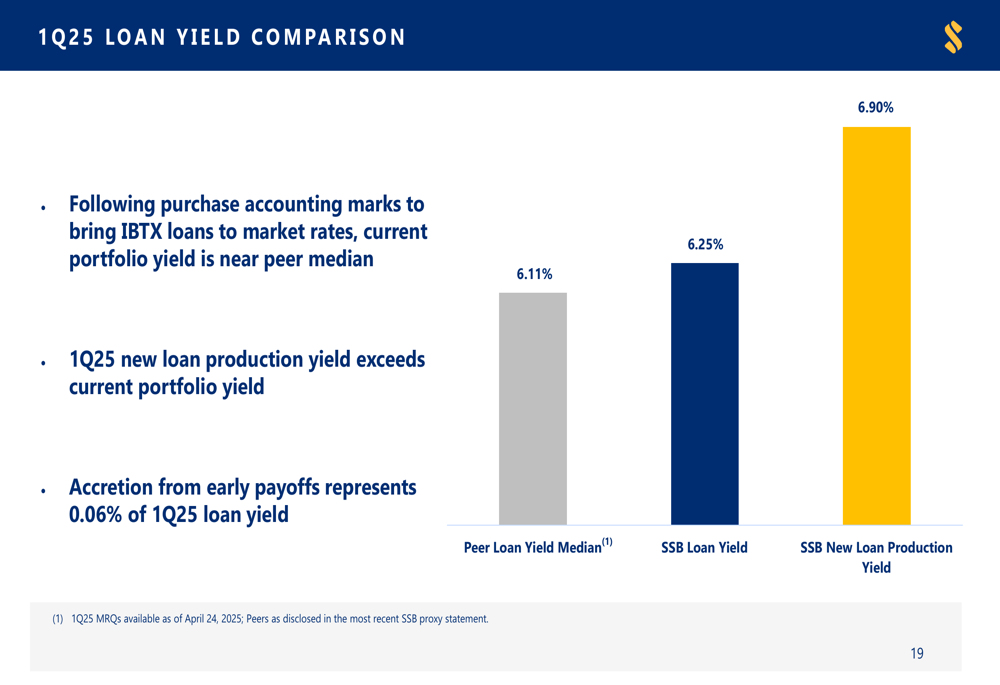
South State’s loan yield of 6.25% exceeds the peer median of 6.11%, while its new loan production yield stands at an even higher 6.90%, positioning the company favorably in the current interest rate environment. This competitive advantage is illustrated in the following comparison:
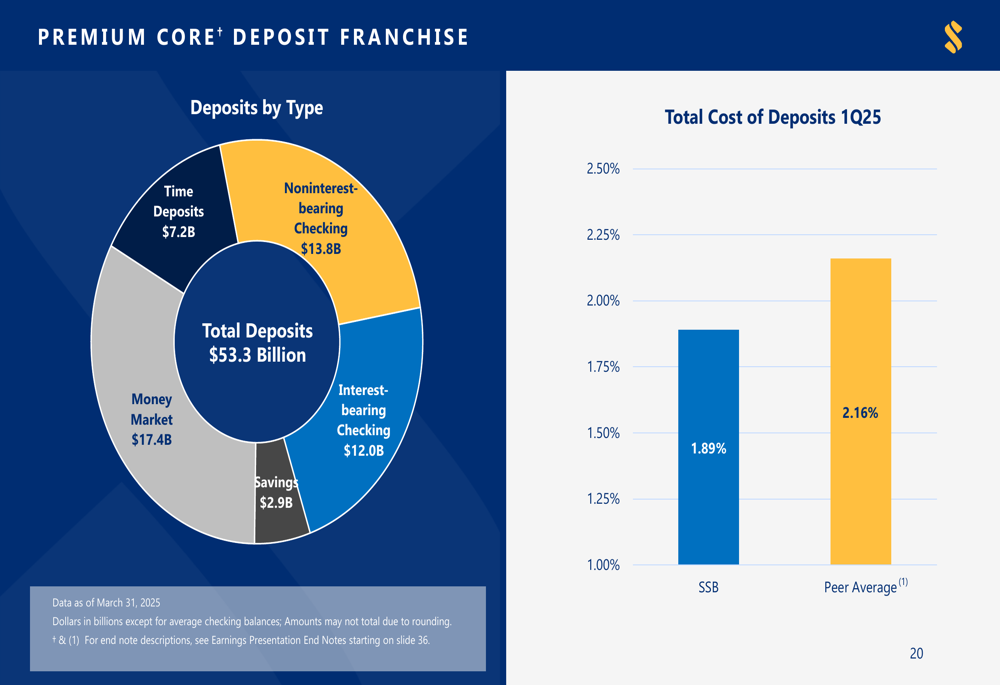
The company’s deposit franchise remains strong, with total deposits of $53.3 billion as of March 31, 2025. The deposit mix includes money market accounts (33%), noninterest-bearing checking (26%), interest-bearing checking (22%), time deposits (14%), and savings accounts (5%). Notably, South State’s cost of deposits at 1.89% compares favorably to the peer average of 2.16%.
The deposit composition and cost advantage are shown in this chart:
Forward-Looking Statements
Looking ahead, South State appears well-positioned to leverage its expanded footprint in high-growth markets. The integration of Independent Bank Group will likely continue to impact results in coming quarters as synergies are realized. The company’s improved net interest margin and competitive deposit costs provide a solid foundation for future profitability.
The company’s asset quality metrics remain stable, with controlled levels of nonperforming assets and adequate loan loss reserves. Capital ratios have decreased slightly following the acquisition but remain at satisfactory levels, with a total risk-based capital ratio of 13.7% as of Q1 2025.
South State’s strategic focus on high-growth Southern markets, coupled with its scale advantages and local market leadership model, positions the company to potentially outperform peers as it fully integrates its recent acquisition and capitalizes on favorable demographic trends in its footprint.
Full presentation:
This article was generated with the support of AI and reviewed by an editor. For more information see our T&C.