Two 59%+ winners, four above 25% in Aug – How this AI model keeps picking winners

Introduction & Market Context
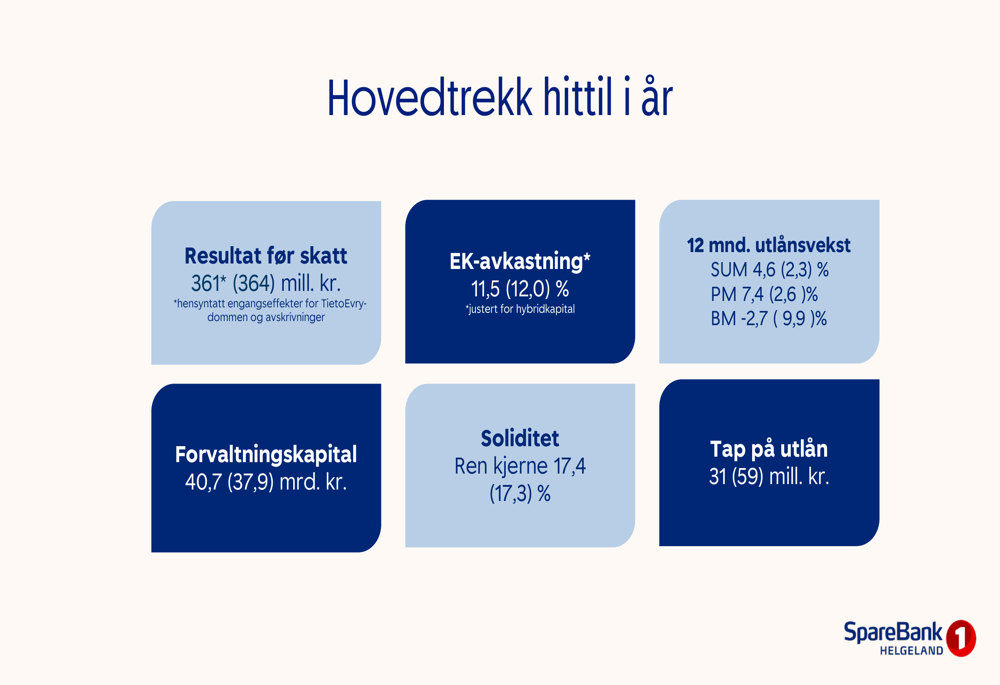
SpareBank 1 Helgeland presented its second quarter 2025 results on August 15, 2025, revealing stable overall performance despite pressures on net interest income and rising operating costs. The Norwegian regional bank, which serves as a key financial institution in the Helgeland region, reported a profit before tax of 171 million NOK for Q2 2025, bringing the first-half profit to 361 million NOK, nearly unchanged from the 364 million NOK recorded in the same period last year.
The bank’s stock (OB:HELG) closed at 167.02 NOK on August 14, 2025, down 0.58% for the day, with the shares trading between a 52-week range of 126.02 NOK to 189 NOK.
Quarterly Performance Highlights
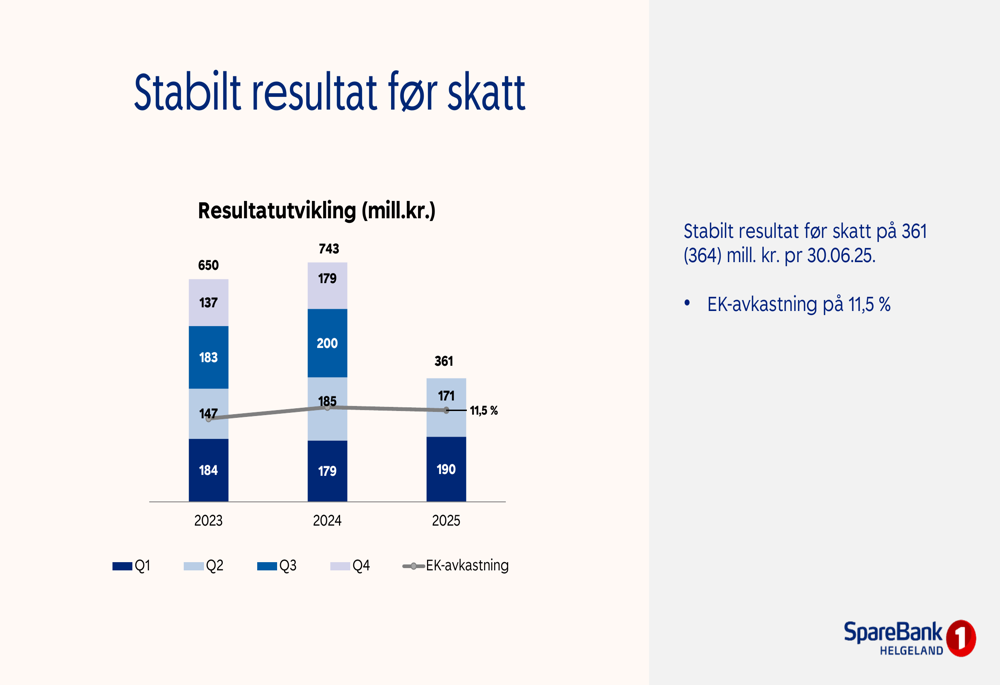
SpareBank 1 Helgeland maintained relatively stable profits in the first half of 2025 compared to the same period in 2024, with return on equity at 11.5%, slightly below the 12.0% achieved in the prior year period but still approaching the bank’s target of exceeding 12%.
As shown in the following summary of key financial metrics for the first half of 2025:
The quarterly profit trend shows consistency over recent quarters, with Q2 2025 profit before tax at 171 million NOK, following 190 million NOK in Q1 2025. This represents a modest decline from the previous quarter but remains in line with the bank’s performance over the past two years.
The following chart illustrates the stability in the bank’s quarterly profit performance:
Detailed Financial Analysis
SpareBank 1 Helgeland faced pressure on its net interest income, which declined to 234 million NOK in Q2 2025 from 236 million NOK in Q1 2025. More significantly, the net interest margin as a percentage of average assets under management fell to 2.35% from 2.43% in the previous quarter, continuing a downward trend observed over several quarters.
This margin compression is illustrated in the following chart:
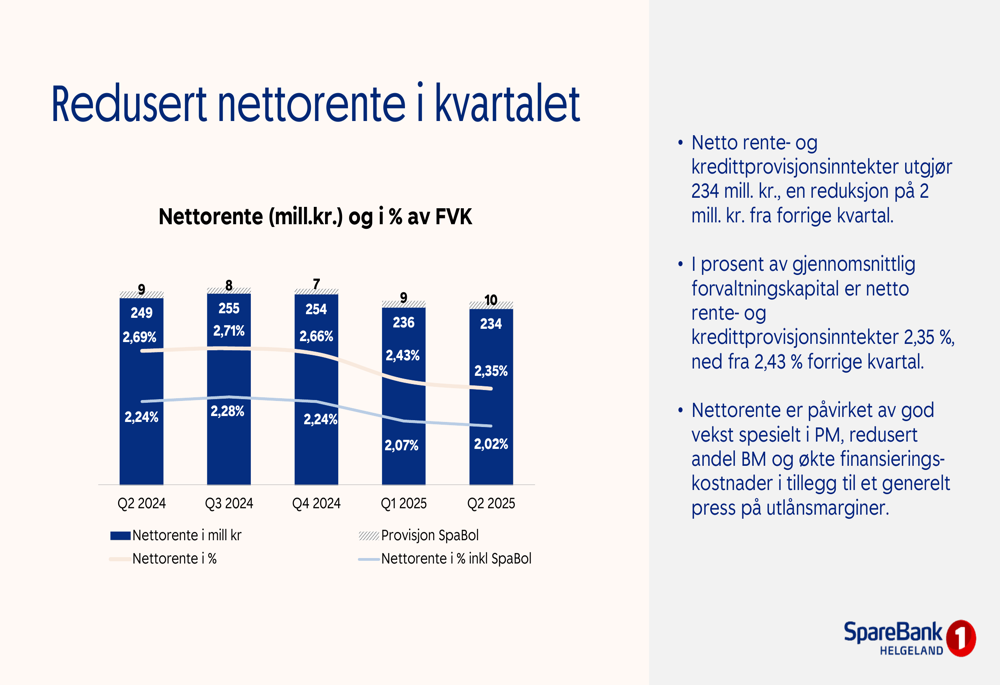
The bank attributed the declining net interest income to several factors, including strong growth in the personal market segment, reduced business market lending, increased financing costs, and general pressure on lending margins.
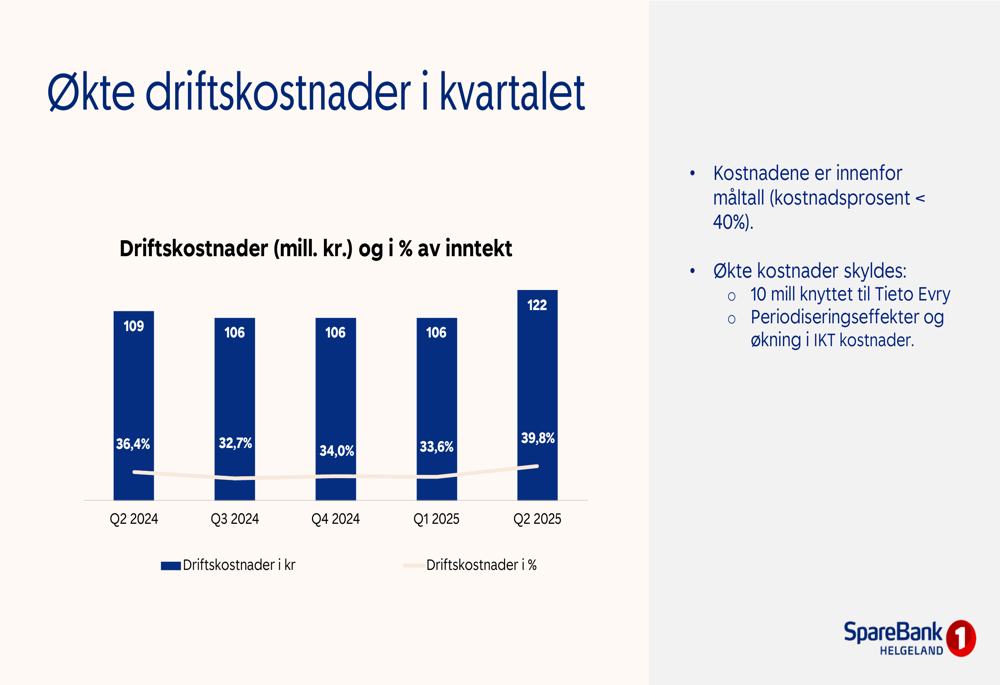
Operating expenses increased significantly to 122 million NOK in Q2 2025, up from 106 million NOK in Q1 2025, with the cost-to-income ratio rising to 39.8%. Despite this increase, the ratio remains within the bank’s target of keeping costs below 40% of income. The bank cited a 10 million NOK expense related to Tieto Evry and increases in IT costs as primary drivers of the higher expenses.
The following chart shows the trend in operating expenses:
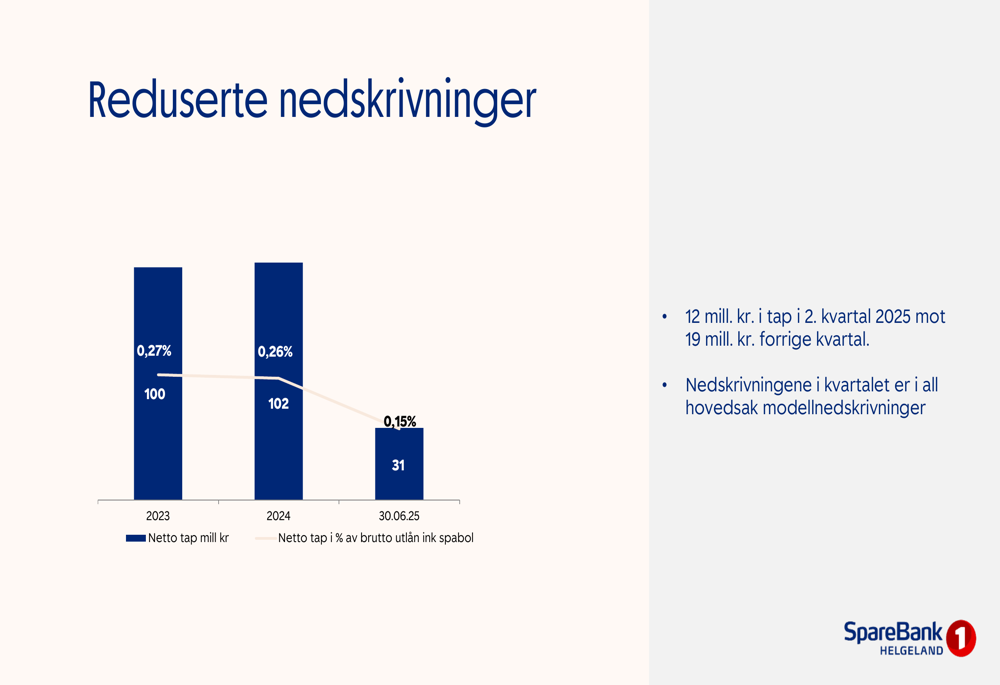
A positive development was the continued reduction in loan impairments, which decreased to 12 million NOK in Q2 2025 from 19 million NOK in Q1 2025. For the first half of 2025, loan losses totaled 31 million NOK, significantly lower than the 59 million NOK recorded in the same period last year. The bank noted that impairments in the quarter were primarily model-based.
The trend in reduced loan impairments is shown in the following chart:
Loan Portfolio and Credit Quality
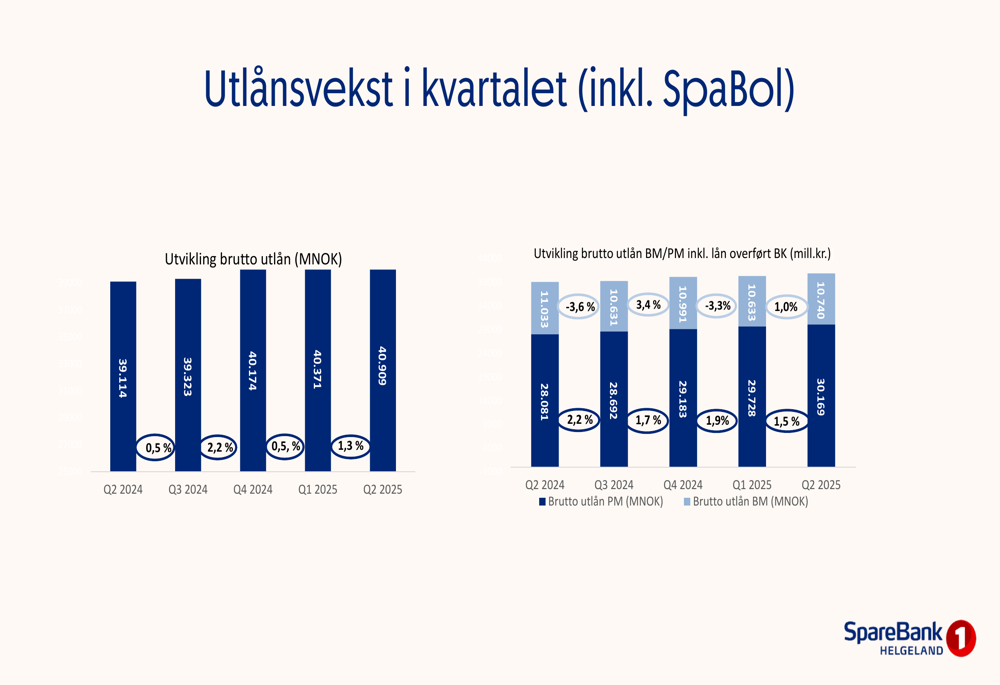
SpareBank 1 Helgeland reported loan growth of 1.3% for the quarter, with personal market loans increasing by 1.4% and business market loans by 1.0%. The 12-month growth rates show a more pronounced divergence, with personal market loans growing by 7.4% while business market loans declined by 2.7%.
The following chart illustrates the loan growth trends:
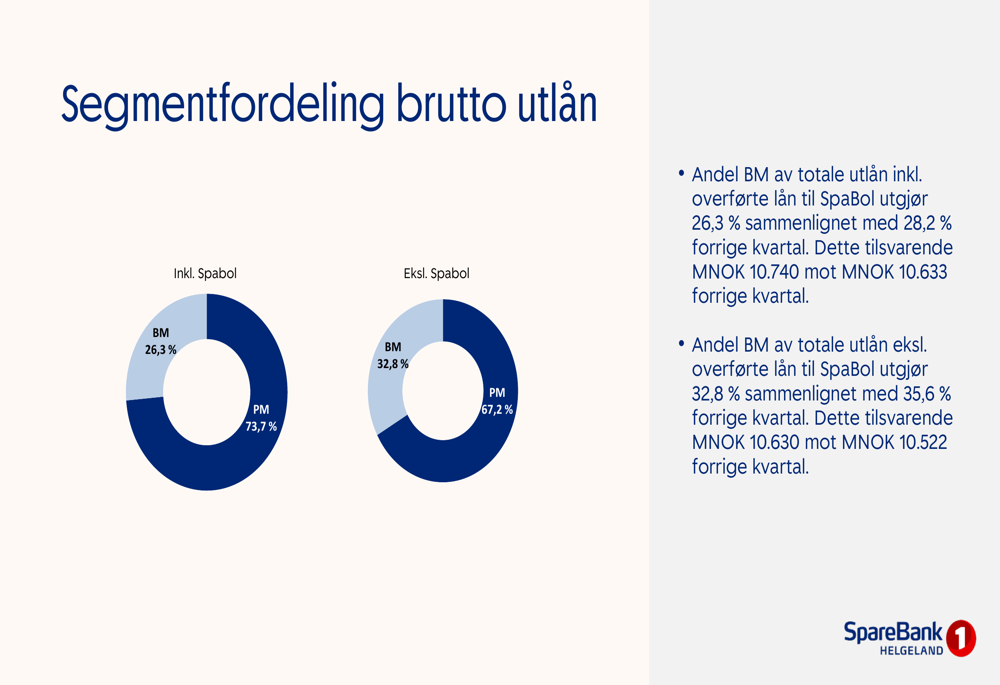
This growth pattern has shifted the composition of the loan portfolio, with personal market loans now representing 73.7% of total loans (including those transferred to SpareBank 1 Boligkreditt), up from previous periods. Business market loans have correspondingly decreased to 26.3% of the total portfolio.
The loan portfolio segmentation is visualized in the following pie charts:
Within the business market portfolio, property management remains the largest segment at 13.5% of gross loans, followed by transport and services at 5.5%, and agriculture and forestry at 4.3%. The bank characterized its business loan portfolio as well-diversified with loyal business customers.
Credit quality showed improvement, with net non-performing and impaired engagements decreasing by 30 million NOK from the previous quarter to 441 million NOK. The bank reported that 88.4% of gross loans were in the lowest risk category (Stage 1), with only 1.9% in Stage 2 and 9.7% in Stage 3.
Capital and Liquidity Position
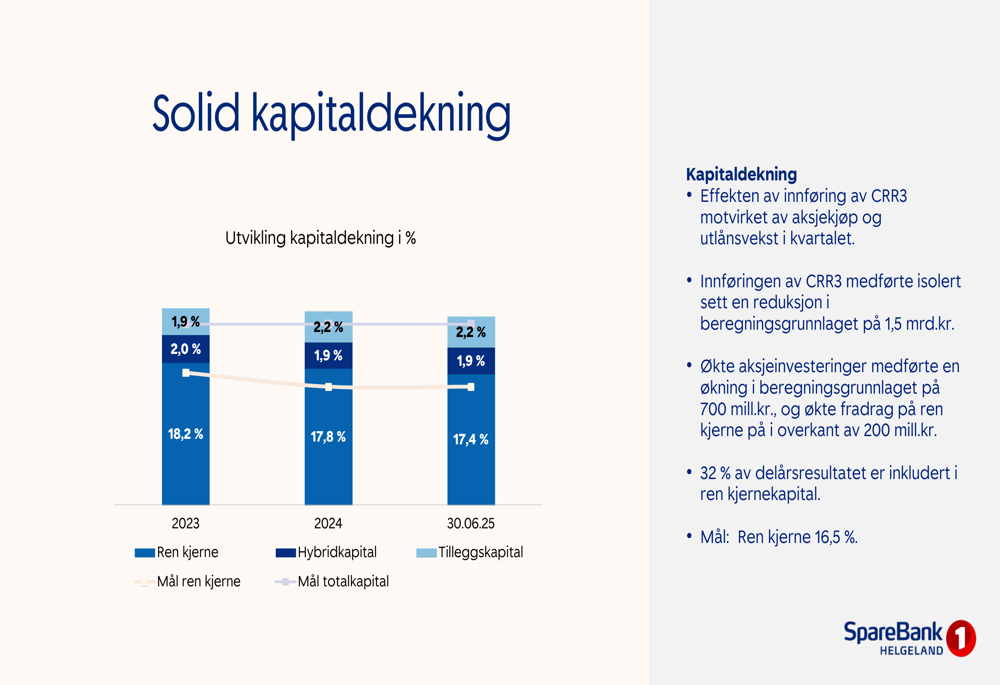
SpareBank 1 Helgeland maintained a strong capital position, with a Core Equity Tier 1 ratio of 17.4% as of June 30, 2025, slightly above the 17.3% reported in the prior year period and well above the bank’s target of 16.5%.
The following chart shows the bank’s capital adequacy ratios:
The bank reported that it is preparing for expected MREL (Minimum Requirements for own funds and Eligible Liabilities) requirements, which has led to an increase in senior financing. The funding maturity profile shows a well-distributed maturity schedule, with 89.8% of financing classified as long-term, up from 82.0% previously.
Deposits grew by 3.15% in the last quarter, with 60.5% of deposits covered by the deposit guarantee scheme. The bank noted that 54.1% of deposits are under 2 million NOK, indicating a stable and diversified deposit base.
Forward-Looking Statements
SpareBank 1 Helgeland continues to position itself as a driver for growth in the Helgeland region, with a focus on maintaining strong capital ratios while managing the shift in its loan portfolio toward the personal market segment. The bank is actively preparing for upcoming regulatory requirements, particularly the expected MREL requirements.
The bank has also updated its sustainability initiatives, including revising its double materiality analysis in the second quarter of 2025, demonstrating its commitment to integrating sustainability into its business operations.
While facing challenges from margin pressure and increased operating costs, the bank’s strong capital position, improving asset quality, and stable profit performance provide a solid foundation for navigating the current economic environment.
Full presentation:
This article was generated with the support of AI and reviewed by an editor. For more information see our T&C.