Barclays now sees two Fed cuts this year, says jumbo Fed cuts ’very unlikely’

Introduction & Market Context
Synchrony Financial (NYSE:SYF) reported its second quarter 2025 financial results on July 22, showing substantial earnings growth despite a slight revenue decline. The company’s stock was down 2.06% in premarket trading to $68.01, suggesting investors may be reacting to the company’s revised full-year outlook rather than the strong quarterly performance.
The financial services company delivered diluted earnings per share of $2.50, representing a 61% increase compared to $1.55 in the same quarter last year. This significant earnings growth came despite a 2% year-over-year decrease in net revenue to $3.65 billion, highlighting improved operational efficiency and lower credit loss provisions.
Quarterly Performance Highlights
Synchrony’s second quarter showed notable improvement in several key metrics, particularly in earnings and credit performance. Net earnings increased 50% year-over-year to $967 million, while return on assets reached 3.2%.
As shown in the following comprehensive quarterly review:
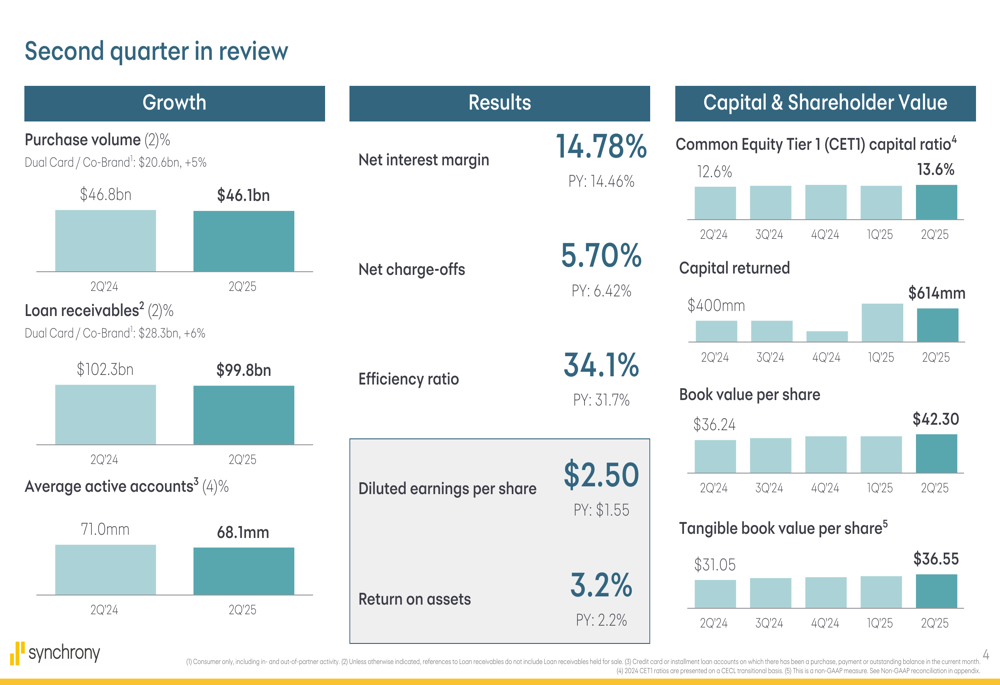
Purchase volume grew 2% to $46.1 billion, with the Dual Card/Co-Brand segment showing stronger growth of 5% to reach $20.6 billion. Loan receivables increased 2% to $99.8 billion, again with Dual Card/Co-Brand outperforming at 6% growth to $28.3 billion. The company maintained 68.1 million average active accounts.
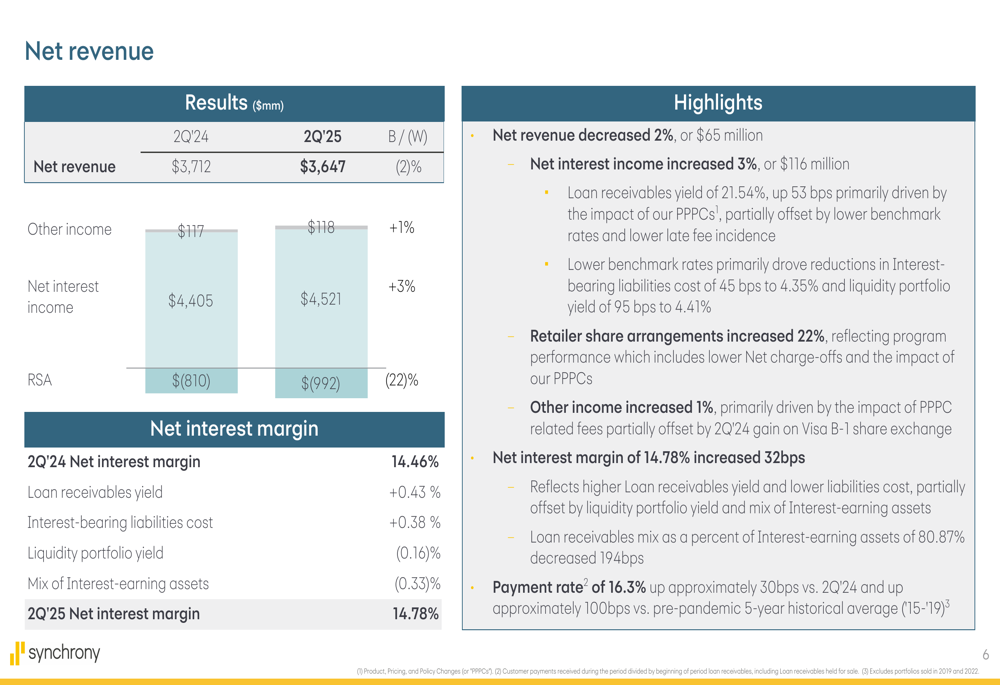
Net interest margin improved to 14.78%, up 32 basis points from the previous year, while net charge-offs decreased to 5.70% from 6.31% in Q2 2024. The efficiency ratio worsened slightly to 34.1% from 31.7% a year earlier.
Detailed Financial Analysis
The company’s financial results showed mixed performance across different metrics. While net revenue decreased 2% to $3.65 billion, net interest income increased 3% to $4.52 billion. This was offset by a 22% increase in retailer share arrangements.
The following slide details the net revenue components and margin analysis:
A significant positive factor was the 32% decrease in provision for credit losses to $1.15 billion, compared to $1.69 billion in the same period last year. This substantial reduction contributed significantly to the bottom-line improvement.
Operating expenses increased 6% to $1.25 billion, with employee costs rising 17% to $509 million, representing the largest increase among expense categories.
Credit Performance
Synchrony’s credit metrics showed notable improvement year-over-year, with net charge-offs decreasing to 5.70% from 6.31% in Q2 2024. The company also demonstrated better sequential performance in charge-off rates compared to historical averages.
The following slide illustrates the improving credit trends across multiple metrics:
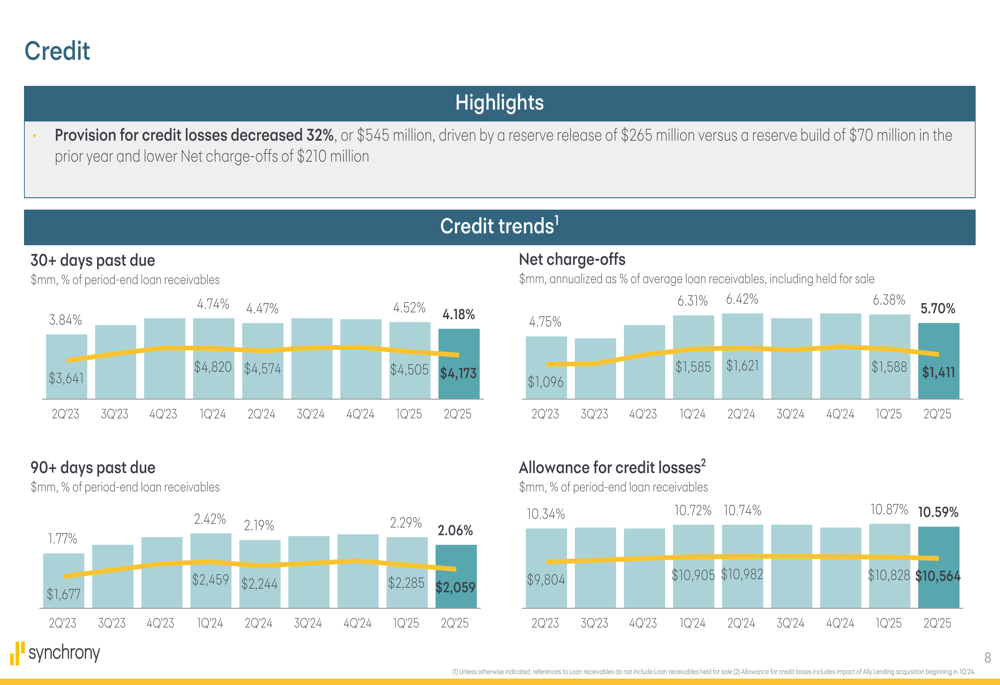
The 30+ days past due rate decreased to 4.18% from 4.74% a year earlier, while the 90+ days past due rate improved to 2.06% from 2.42%. The allowance for credit losses as a percentage of period-end loan receivables was 10.59%, slightly lower than the 10.72% reported in Q2 2024.
These improvements in credit metrics suggest that despite economic challenges, Synchrony’s underwriting standards and collection efforts are yielding positive results.
Strategic Initiatives
Synchrony continues to leverage its strategic partnerships with major brands including Amazon (NASDAQ:AMZN), Walmart (NYSE:WMT) (OnePay), and PayPal (NASDAQ:PYPL). The company highlighted consistent execution across various economic environments.
As shown in the following strategic highlights slide:
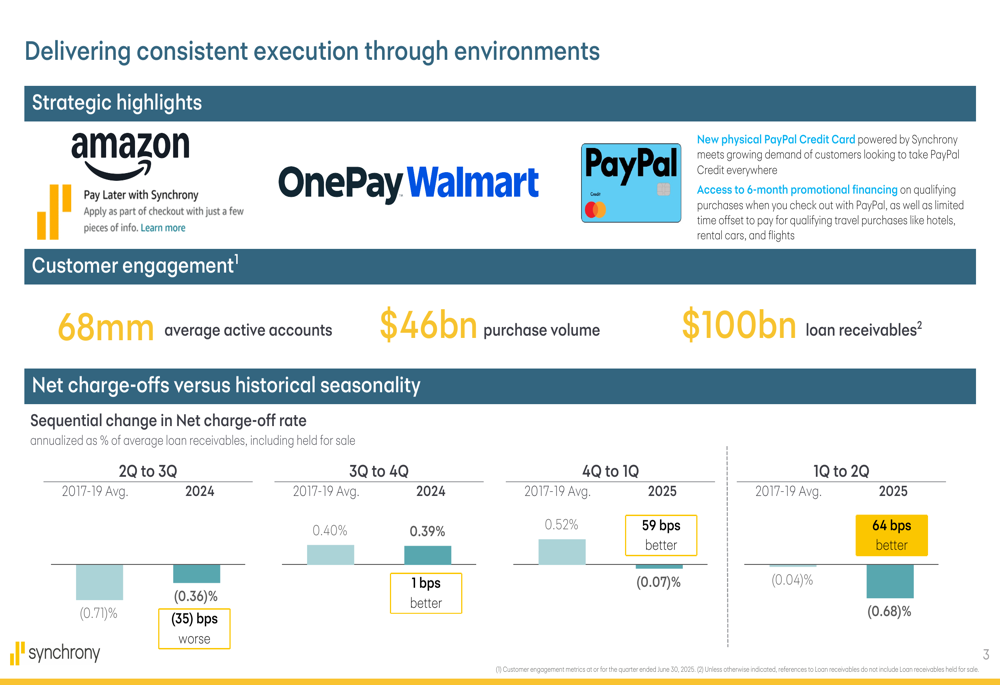
The company noted that the sequential change in net charge-off rates has been better than historical averages in recent quarters, demonstrating resilience in its credit portfolio management.
Synchrony also mentioned that the Walmart/OnePay launch is planned for Fall 2025, representing a significant growth opportunity in the coming quarters.
Capital Position and Shareholder Returns
Synchrony maintained a strong capital position with a Common Equity Tier 1 (CET1) capital ratio of 13.6%, up from 12.6% in Q2 2024. The company returned $614 million to shareholders during the quarter.
The following slide details the company’s funding, capital, and liquidity positions:
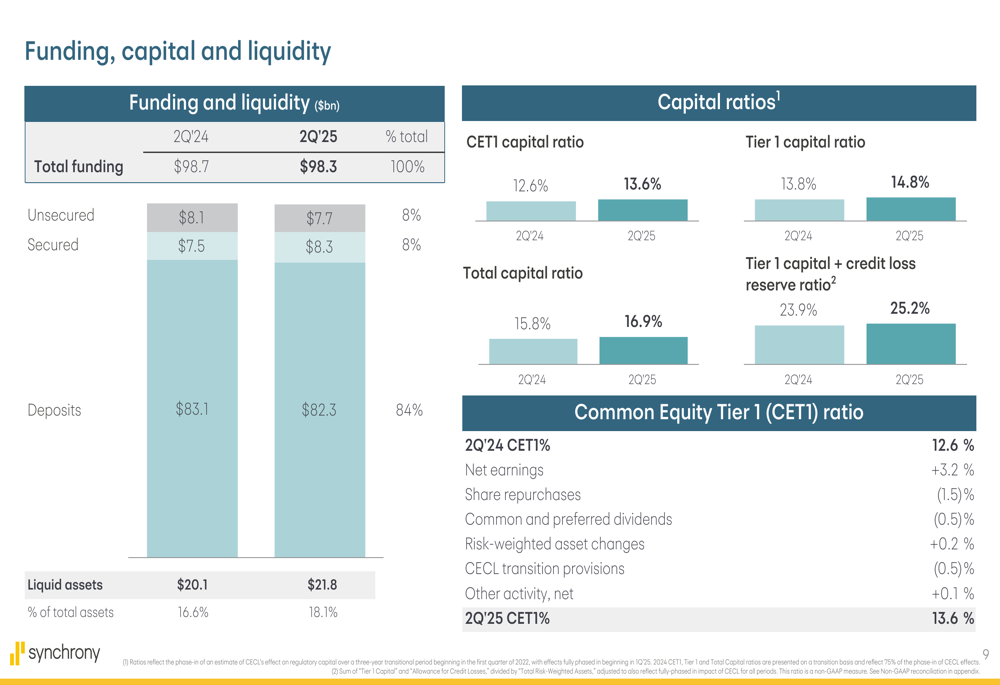
Book value per share increased to $42.30, while tangible book value per share rose to $36.55. The company’s funding sources remained stable with deposits accounting for 84% of total funding.
Forward-Looking Statements
Synchrony revised its full-year 2025 outlook, adjusting several key metrics. The company now expects flat loan receivables growth, down from the previous guidance of low single-digit growth. Revenue guidance was lowered to $15.0-15.3 billion from the previous $15.2-15.7 billion range.
The baseline outlook is presented in the following slide:
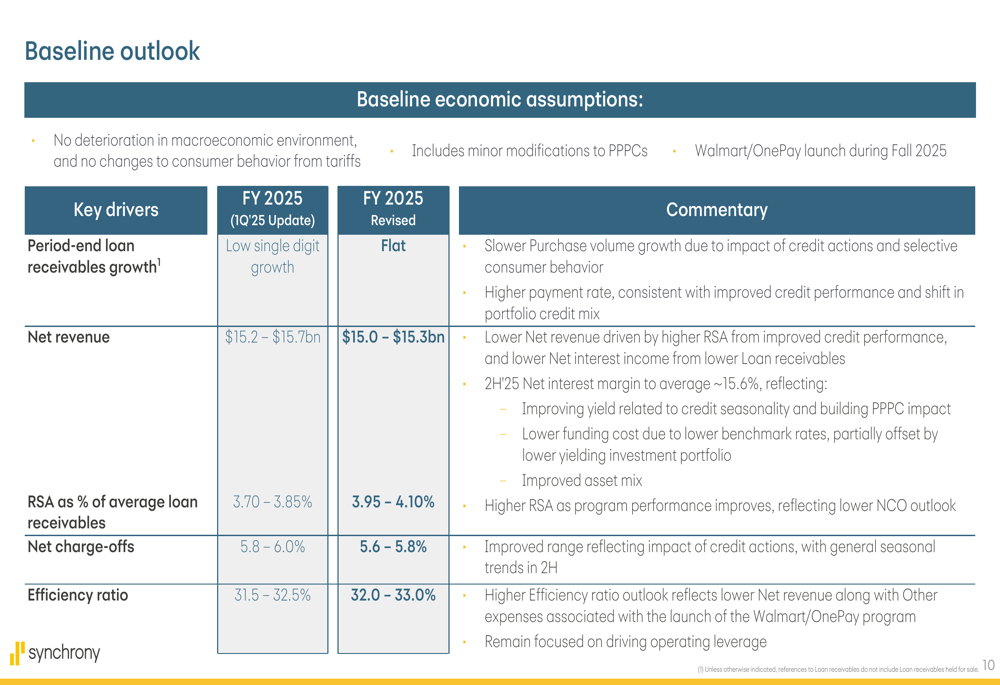
Despite the reduced growth expectations, Synchrony improved its net charge-off outlook to 5.6-5.8% from the previous 5.8-6.0% range. However, the company increased its projection for retailer share arrangements as a percentage of average loan receivables to 3.95-4.10% from 3.70-3.85%, and slightly worsened its efficiency ratio outlook to 32.0-33.0% from 31.5-32.5%.
The revised outlook assumes no deterioration in the macroeconomic environment and no changes to consumer behavior from tariffs, suggesting cautious optimism about the remainder of 2025.
In conclusion, while Synchrony delivered impressive earnings growth and improved credit metrics in Q2 2025, the revised full-year outlook points to more modest expectations for the remainder of the year, which may explain the negative premarket reaction despite the strong quarterly performance.
Full presentation:
This article was generated with the support of AI and reviewed by an editor. For more information see our T&C.