Is this U.S.-China selloff a buy? A top Wall Street voice weighs in

Introduction & Market Context
TD SYNNEX Corp (NYSE:SNX) reported record-breaking third quarter fiscal 2025 results on September 25, with the stock rising 2.43% in premarket trading to $154.00 after closing at $150.34 the previous day. The IT distribution giant continues to build on its strong momentum from earlier quarters, with significant growth across all regions and product categories.
The company’s presentation revealed substantial progress in its strategic transformation, particularly in high-growth technology segments. This performance comes as TD SYNNEX benefits from an improving IT spending environment while successfully executing its long-term strategy of shifting toward higher-margin business areas.
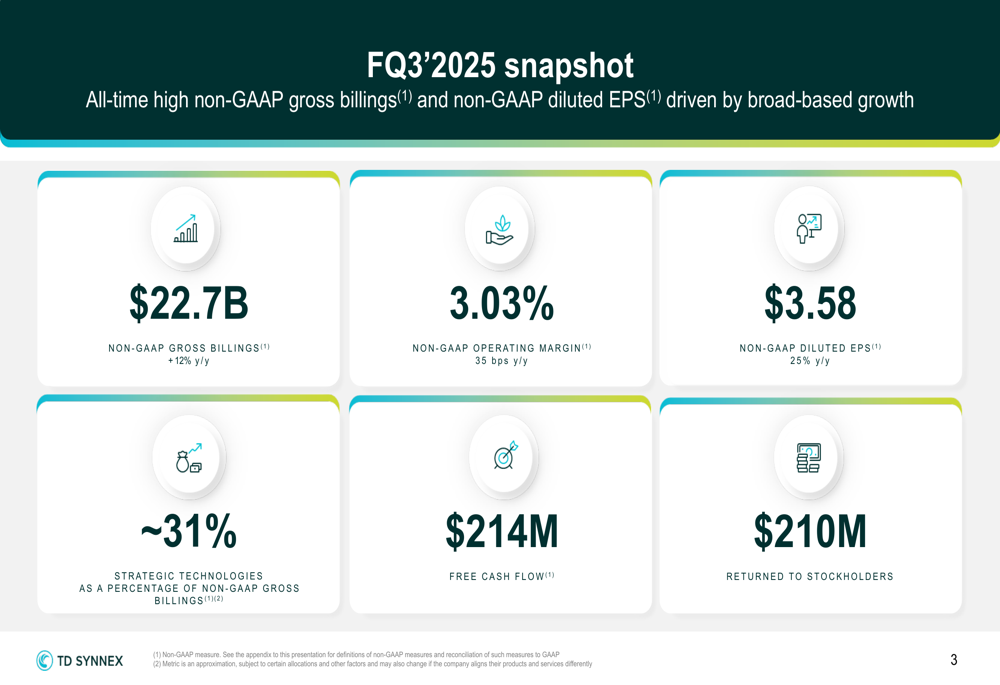
As shown in the following snapshot of key Q3 FY2025 metrics, TD SYNNEX delivered impressive results across all major financial indicators:
Quarterly Performance Highlights
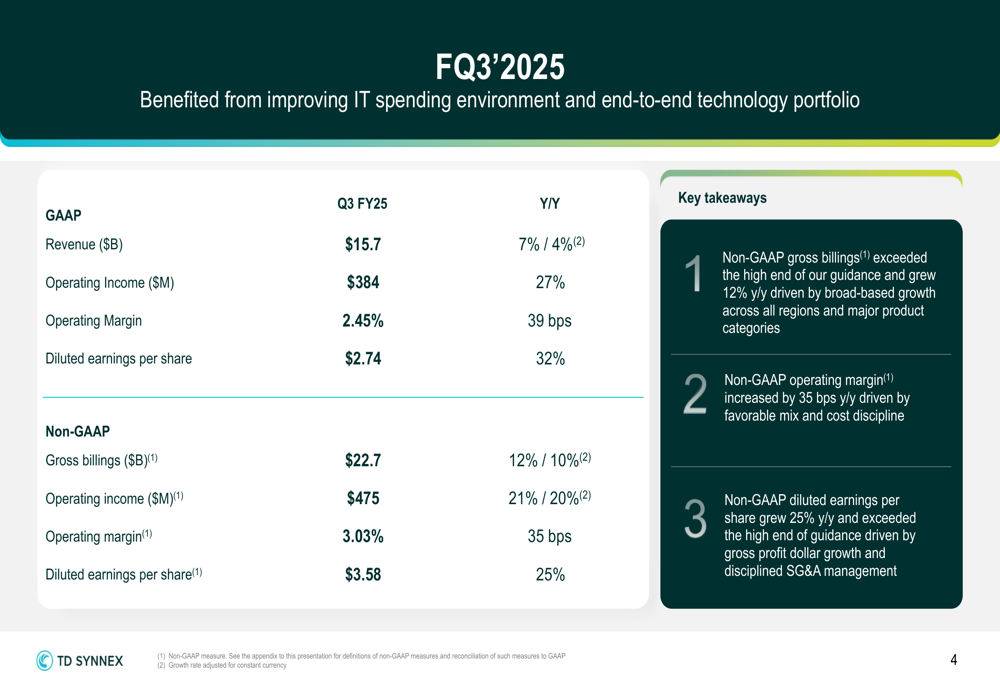
TD SYNNEX reported non-GAAP gross billings of $22.7 billion for Q3 FY2025, representing a 12% year-over-year increase (10% in constant currency). This growth significantly outpaced the 7% revenue growth reported in Q2, indicating accelerating business momentum. The company’s non-GAAP operating margin expanded to 3.03%, up 35 basis points year-over-year, while non-GAAP diluted EPS jumped 25% to $3.58.
The detailed financial results show strong performance across both GAAP and non-GAAP metrics, with operating income growth of 27% and 21% respectively. The company attributed these results to an improving IT spending environment and its comprehensive end-to-end technology portfolio.
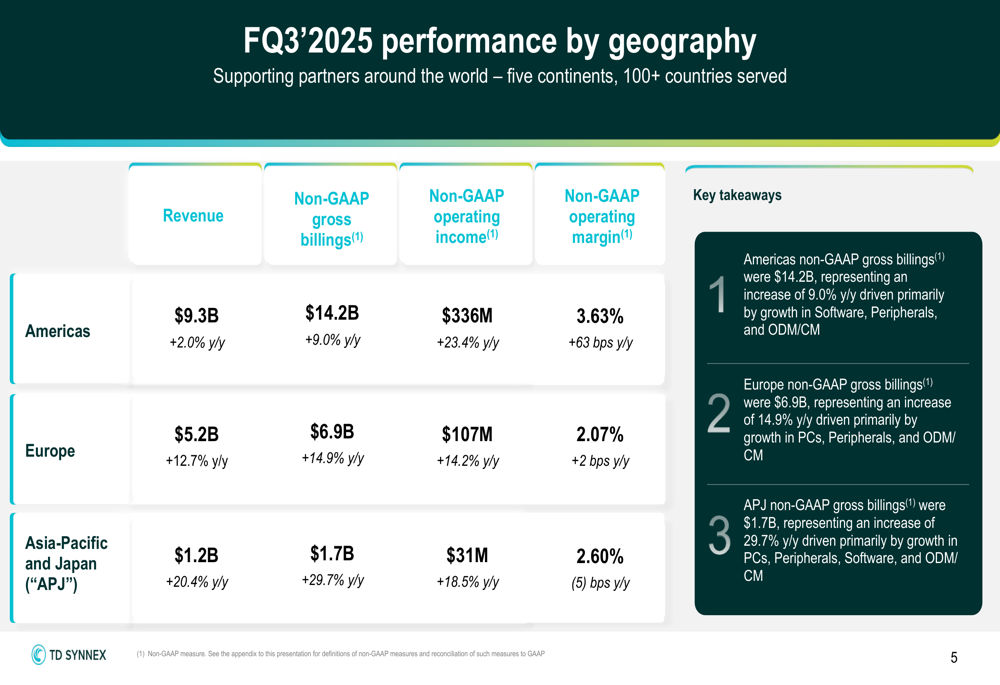
Geographically, TD SYNNEX demonstrated growth across all regions. The Americas segment, which accounts for the largest portion of the business, saw non-GAAP gross billings increase by 9.0% to $14.2 billion, with operating margin expanding by 63 basis points to 3.63%. Europe delivered 14.9% growth to $6.9 billion, while the Asia-Pacific and Japan region showed the strongest growth at 29.7% to reach $1.7 billion.
These results build on the momentum reported in Q2 2025, when the company posted $21.6 billion in gross billings and exceeded earnings expectations with EPS of $2.99 against a forecast of $2.71. The Q3 performance demonstrates continued acceleration across key metrics.
Product Portfolio & Strategic Technologies
TD SYNNEX’s balanced product portfolio showed strong growth across multiple categories. Software led with 26% year-over-year growth, representing 22% of non-GAAP gross billings. The ODM/CM (Original Design Manufacturer/Contract Manufacturer) segment showed the most dramatic growth at 57%, while PCs grew 10% to account for 17% of billings.
The following chart illustrates the company’s diverse portfolio mix and corresponding growth rates:
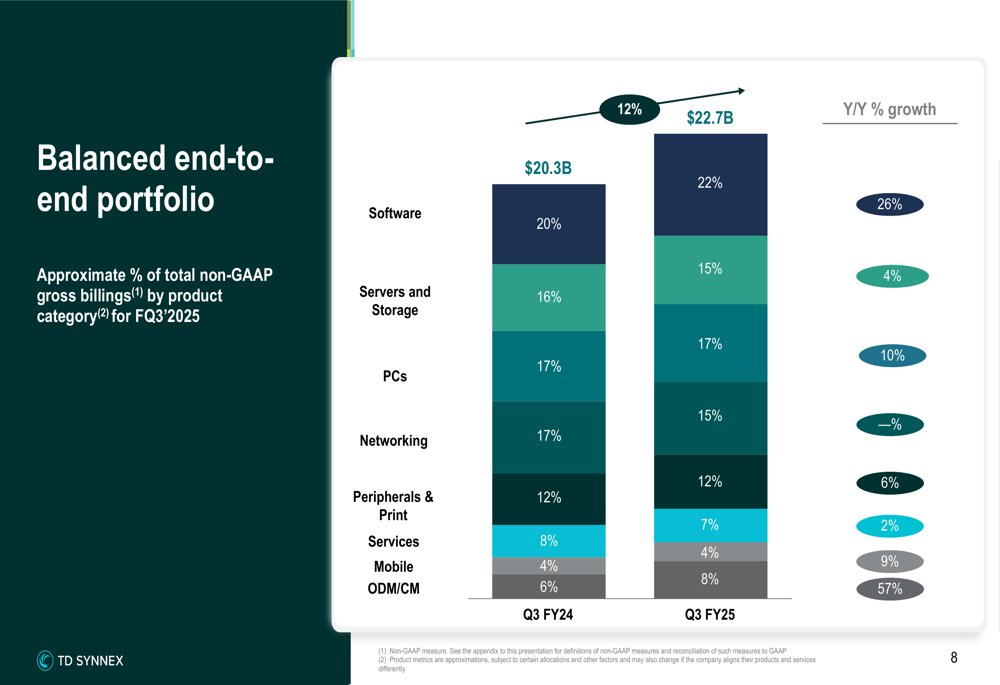
A key highlight of the presentation was the continued expansion of strategic technologies, which now represent approximately 31% of non-GAAP gross billings, up from 25% in FY2024 and 17% in FY2021. These strategic areas include cloud, data/AI/IoT, security, and hyperscale infrastructure, which are driving higher margins and positioning the company for long-term growth.
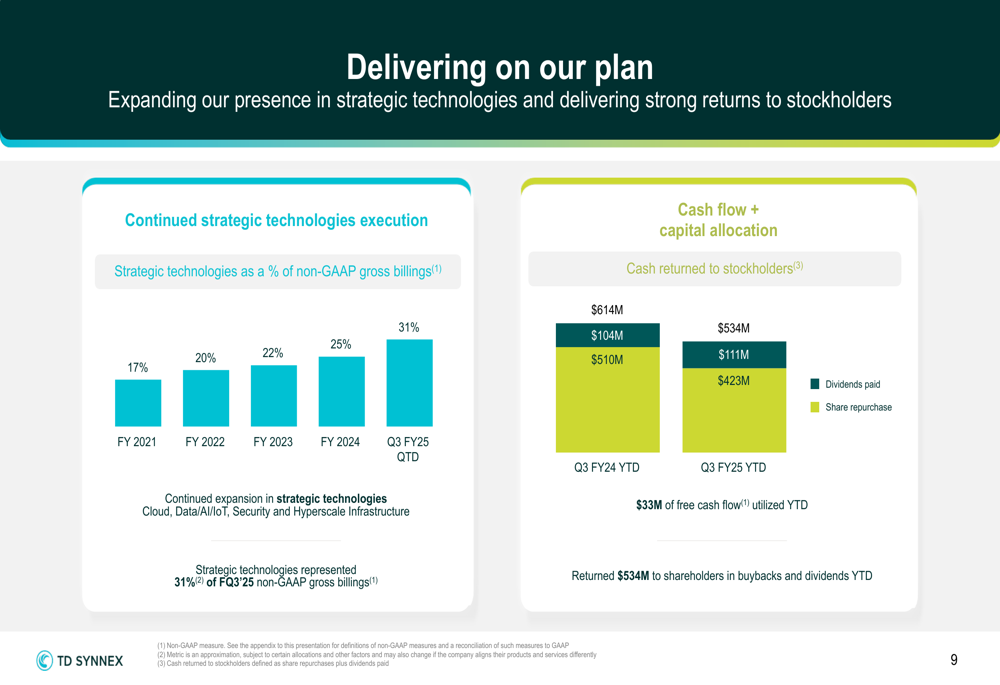
During the Q2 earnings call, CEO Patrick Zammit had emphasized that "Our North Star remains generating profitable growth and free cash flow." The Q3 results demonstrate successful execution against this strategy, with the company returning $210 million to stockholders in the quarter through share repurchases and dividends, bringing the year-to-date total to $534 million.
Financial Outlook & Guidance
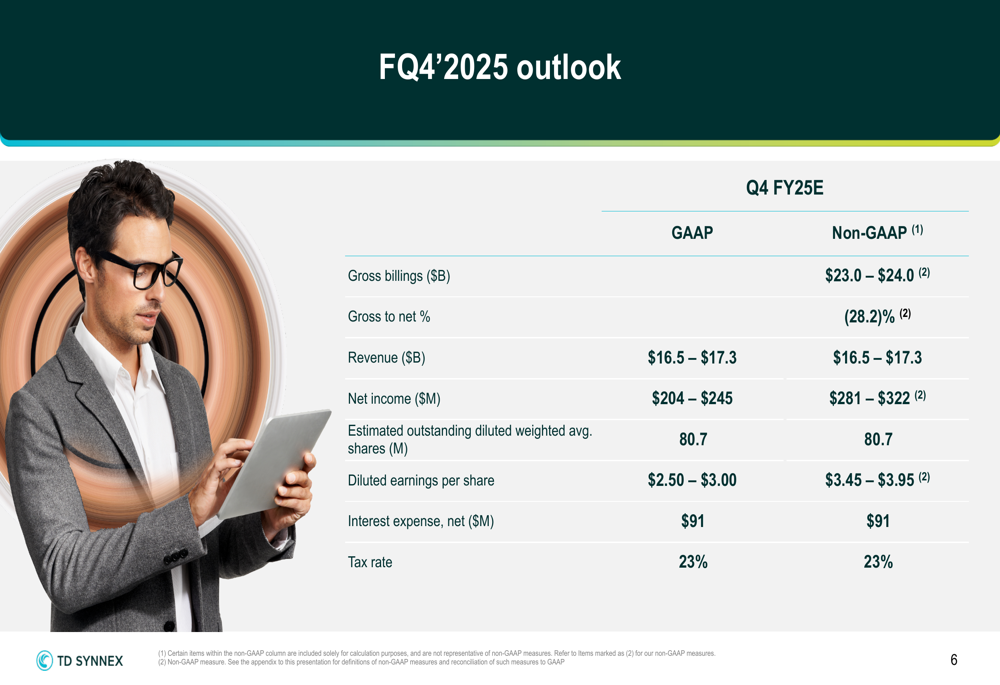
Looking ahead to the fourth quarter of fiscal 2025, TD SYNNEX provided a positive outlook with non-GAAP gross billings expected to range between $23.0 billion and $24.0 billion, representing potential continued growth from Q3. The company projects non-GAAP diluted EPS between $3.45 and $3.95, compared to the $3.58 achieved in Q3.
This guidance suggests continued momentum into the final quarter of the fiscal year, building on the company’s strong performance throughout 2025. The outlook aligns with management’s previous comments during the Q2 earnings call about being "in a strong financial position heading into the second half of the year."
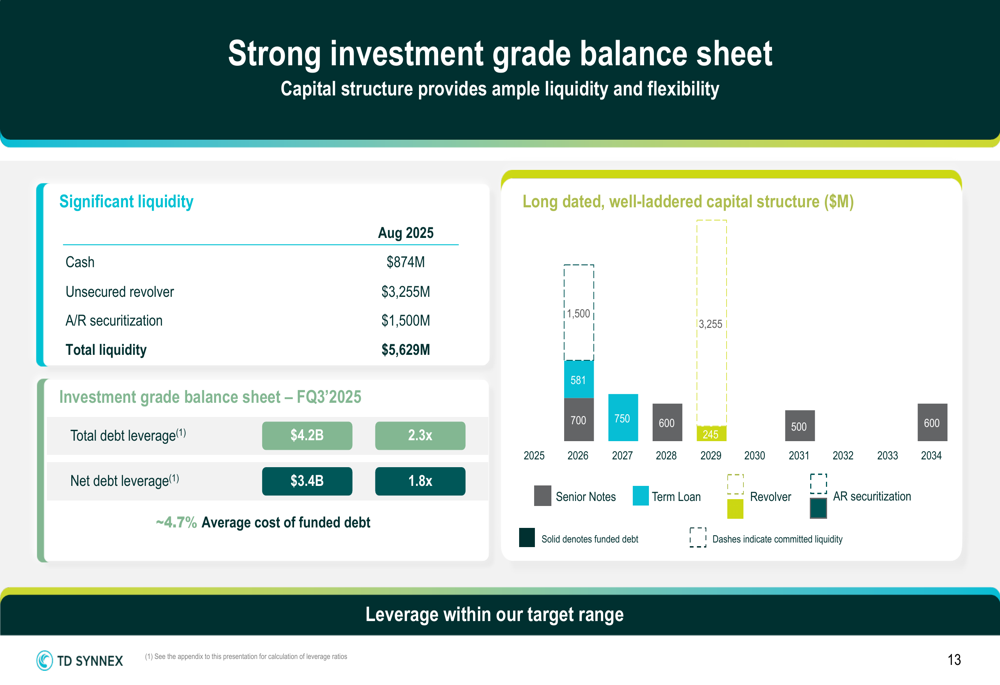
TD SYNNEX maintains a strong balance sheet to support its growth initiatives, with total liquidity of $5.6 billion as of August 2025, including $874 million in cash and substantial available credit facilities. The company’s total debt leverage stands at 2.3x, within its target range, with an average cost of funded debt of approximately 4.7%.
Long-term Strategy & Value Creation
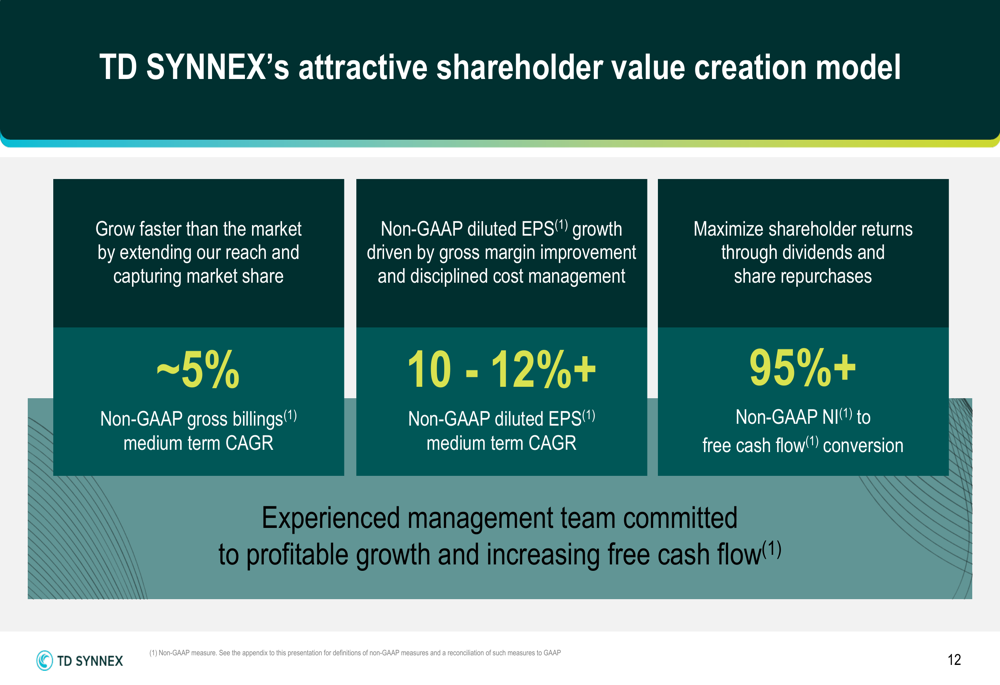
TD SYNNEX outlined its long-term value creation model, targeting approximately 5% non-GAAP gross billings medium-term compound annual growth rate (CAGR) and 10-12%+ non-GAAP diluted EPS medium-term CAGR. These targets are supported by the company’s focus on extending market reach, improving gross margins, and disciplined cost management.
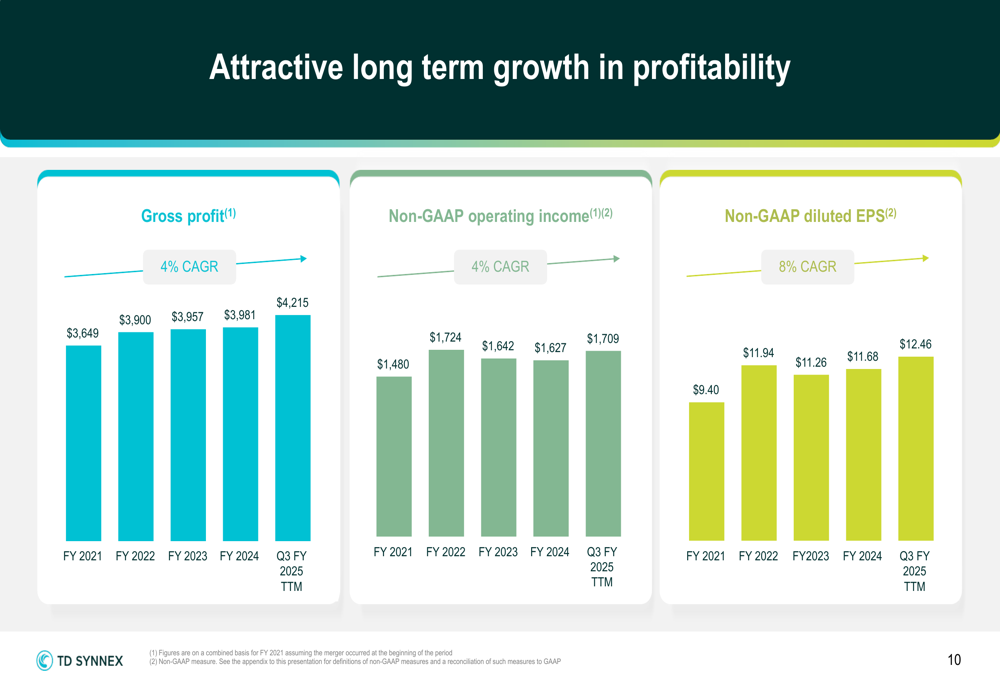
The company’s long-term profitability trends demonstrate consistent growth across key metrics. Gross profit has grown at a 4% CAGR since FY2021, while non-GAAP diluted EPS has increased at an 8% CAGR over the same period, reaching $12.46 on a trailing twelve-month basis as of Q3 FY2025.
TD SYNNEX continues to position itself to benefit from industry evolution, transitioning from a traditional linear distribution model to a more complex ecosystem orchestration approach. This strategic shift allows the company to expand its addressable market and develop "as-a-service" capabilities that align with changing customer demands.
The company’s strong Q3 performance and positive outlook reflect successful execution of its strategic initiatives, particularly the expansion of higher-margin strategic technologies and disciplined capital allocation. With record gross billings and EPS, TD SYNNEX demonstrates its ability to drive growth while navigating the evolving IT distribution landscape.
Full presentation:
This article was generated with the support of AI and reviewed by an editor. For more information see our T&C.