These are top 10 stocks traded on the Robinhood UK platform in July

Introduction & Market Context
TrueCar Inc (NASDAQ:TRUE) released its first quarter 2025 supplemental materials on May 6, 2025, revealing mixed results that highlight the company’s ongoing transition challenges. The automotive digital marketplace reported revenue growth but faced profitability headwinds as expenses outpaced gains.
TrueCar’s stock has struggled recently, closing at $1.48 on May 5, down 5.13% for the session, though showing signs of recovery with a 4.73% gain in after-hours trading. The company’s shares remain near the lower end of their 52-week range of $1.25-$4.62, reflecting investor concerns about the path to sustainable profitability.
Quarterly Performance Highlights
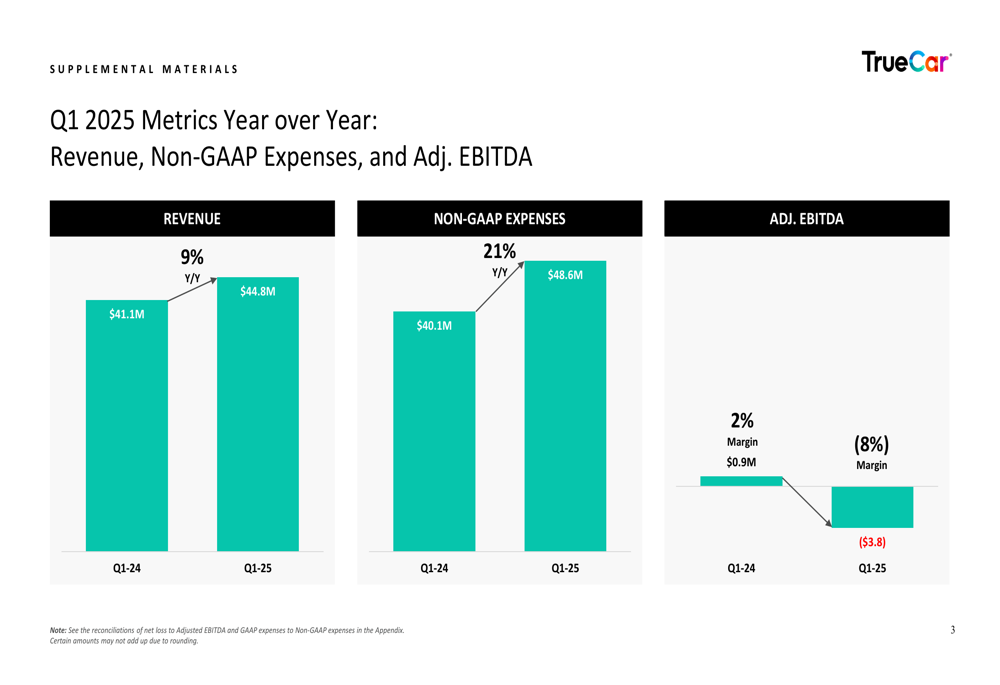
TrueCar reported Q1 2025 revenue of $44.8 million, representing a 9% year-over-year increase from $41.1 million in Q1 2024. However, this growth was overshadowed by a 21% jump in non-GAAP expenses to $48.6 million, resulting in adjusted EBITDA turning negative at -$3.8 million (-8% margin), compared to a positive $0.9 million (2% margin) in the same period last year.
As shown in the following chart of key financial metrics:
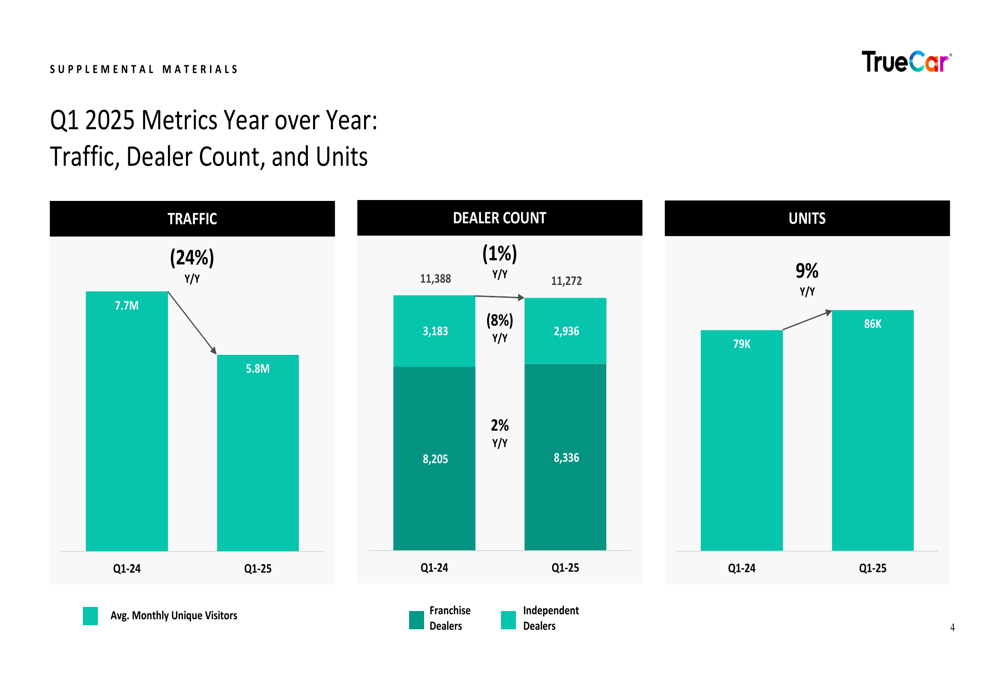
The company’s operational metrics presented a mixed picture. While total units increased by 9% year-over-year to 86,000, average monthly unique visitors (traffic) declined significantly by 24% to 5.8 million. The dealer count remained relatively stable with a slight 1% decrease to 11,272 dealers.
The following chart illustrates these operational trends:
Detailed Financial Analysis
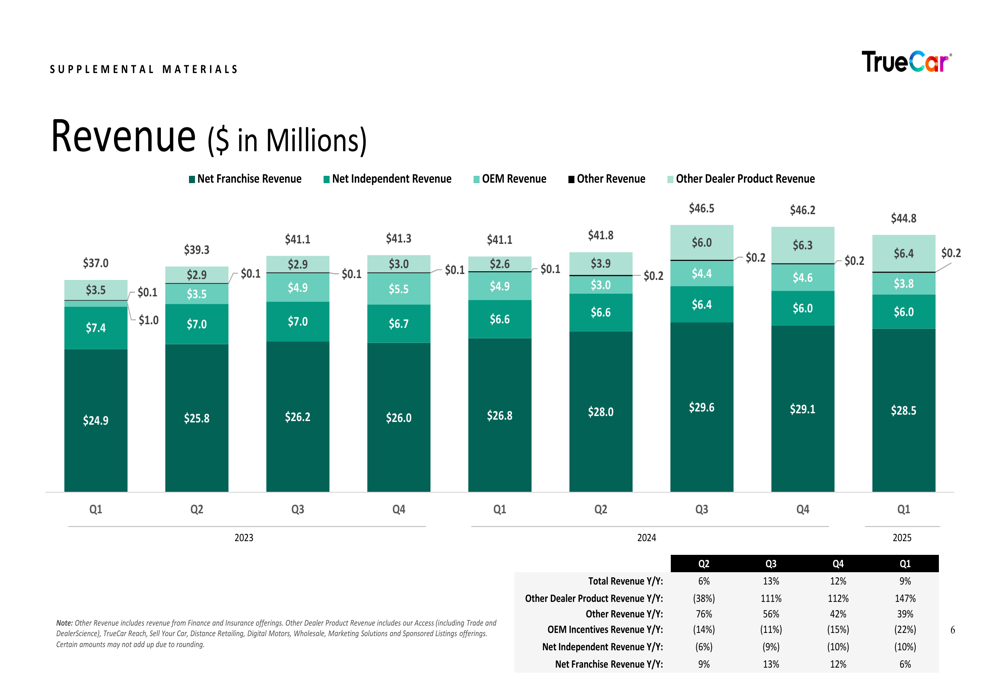
TrueCar’s revenue growth was driven primarily by its independent dealer segment, which contributed $28.5 million (up from $26.8 million in Q1 2024), and other dealer product revenue, which reached $6.4 million (up from $6.0 million). Franchise dealer revenue also showed improvement at $3.8 million, up from $2.6 million in Q1 2024. However, OEM incentive revenue declined by 22% year-over-year to $6.0 million.
The revenue breakdown by source is illustrated in the following chart:
On the expense side, sales and marketing costs increased to $24.5 million in Q1 2025 from $21.4 million in Q1 2024, representing 54.6% of revenue compared to 52.0% a year earlier. Technology and development expenses rose slightly to $7.6 million, while general and administrative expenses decreased to $8.8 million from $9.4 million in the prior year.
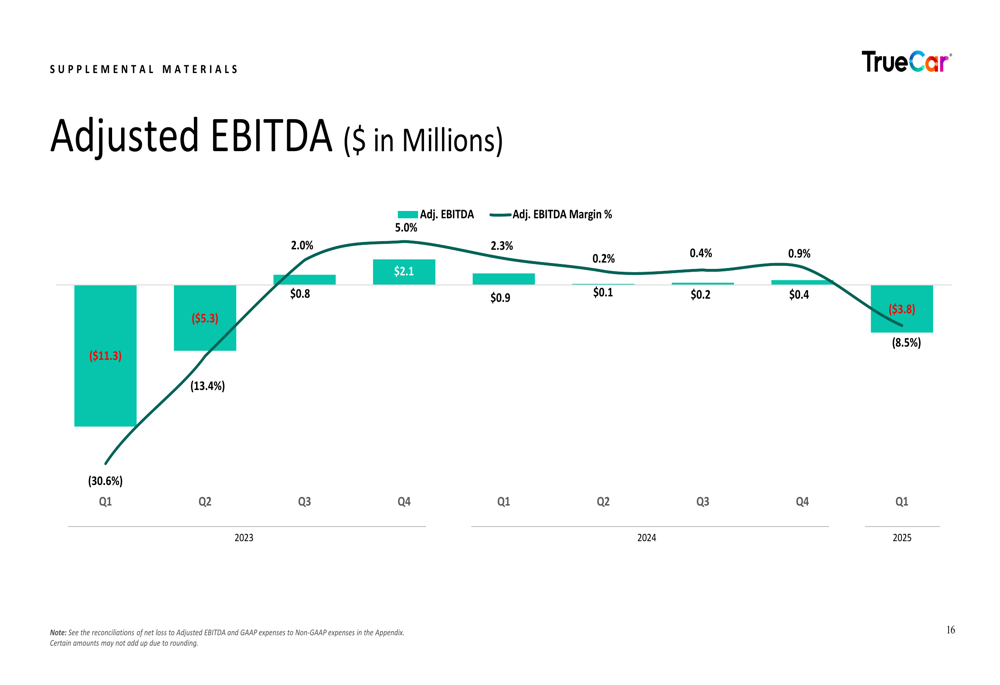
The expense growth outpacing revenue led to the deterioration in adjusted EBITDA, which has swung from positive to negative territory:
Strategic Initiatives
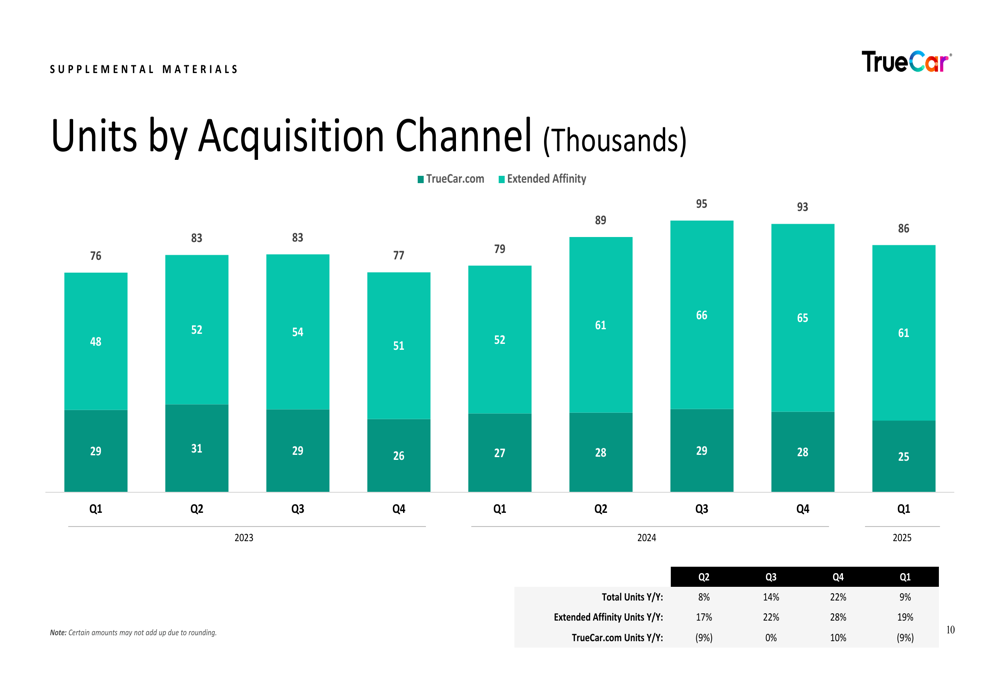
TrueCar’s results reveal a strategic shift in its business model. While direct traffic to TrueCar.com declined, the company successfully grew units through its Extended Affinity channel, which increased by 19% year-over-year to 61,000 units, now representing approximately 71% of total units.
This channel shift is clearly illustrated in the following chart:
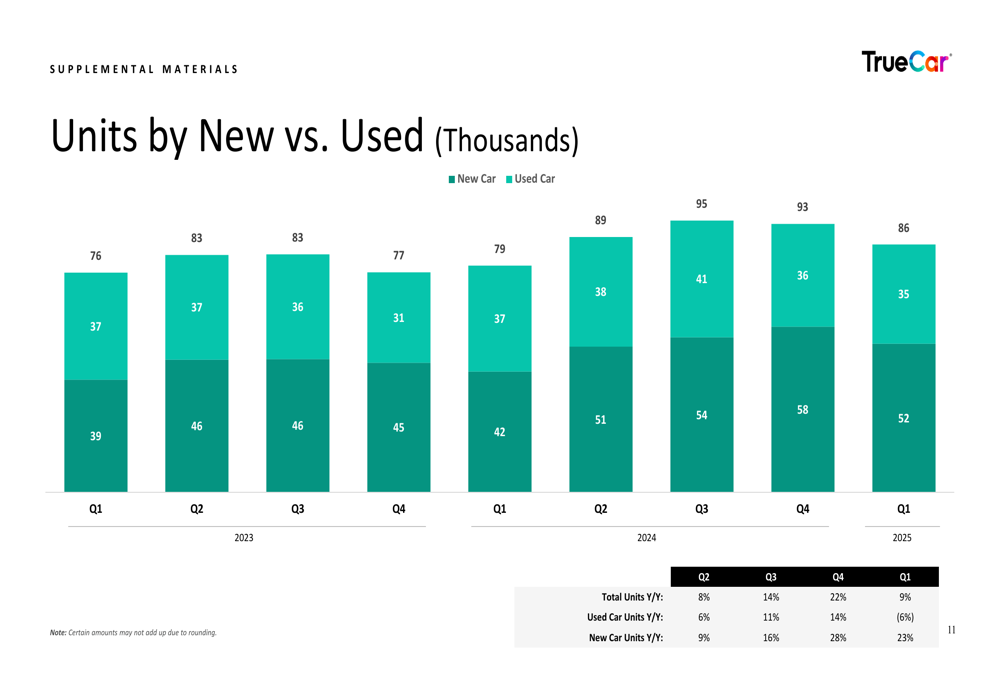
Additionally, TrueCar is experiencing stronger growth in new car sales compared to used vehicles. New car units increased by 23% year-over-year to 52,000, while used car units declined by 6% to 35,000. This shift toward new vehicles comes despite industry challenges in new car affordability and availability.
The following chart shows the new versus used car unit breakdown:
Forward-Looking Implications
The Q1 2025 results raise questions about TrueCar’s previously stated goal of achieving profitability on a reported basis in 2025, which was mentioned during the company’s Q4 2024 earnings call. The widening losses in Q1 suggest that the company faces significant challenges in balancing growth investments with profitability.
The decline in direct traffic remains a concern, as it indicates potential weakening of TrueCar’s brand position in the market. However, the company’s ability to grow units despite traffic declines demonstrates improved conversion efficiency and the success of its Extended Affinity partnerships.
For investors, the key question remains whether TrueCar can control its expense growth while maintaining revenue momentum. The company’s monetization per unit has remained relatively flat at $517, indicating that revenue growth is primarily volume-driven rather than through increased pricing power.
As TrueCar continues its strategic evolution in a competitive automotive marketplace landscape, the company will need to demonstrate that its investments in sales and marketing can deliver sustainable growth while bringing expenses back in line with revenue to restore positive EBITDA margins in future quarters.
Full presentation:
This article was generated with the support of AI and reviewed by an editor. For more information see our T&C.