Bank of America just raised its EUR/USD forecast

Introduction & Market Context
U.S. Bancorp (NYSE:USB) presented its first quarter 2025 earnings on April 16, showcasing steady financial performance amid economic uncertainties. As the largest non-GSIB bank in the United States, U.S. Bancorp emphasized its diversified revenue mix and consistent expense discipline. Despite beating earnings expectations, the stock declined 1.22% to $38.16 in trading following the release, reflecting broader market concerns about economic headwinds.
The bank reported earnings per share of $1.03, delivering a return on tangible common equity of 17.5% and demonstrating positive operating leverage of 270 basis points year-over-year on an adjusted basis. This marks the third consecutive quarter of revenues outpacing expenses on an adjusted basis.
As shown in the following highlights slide, U.S. Bancorp maintained its focus on expense discipline, diversified revenue generation, and capital accretion:
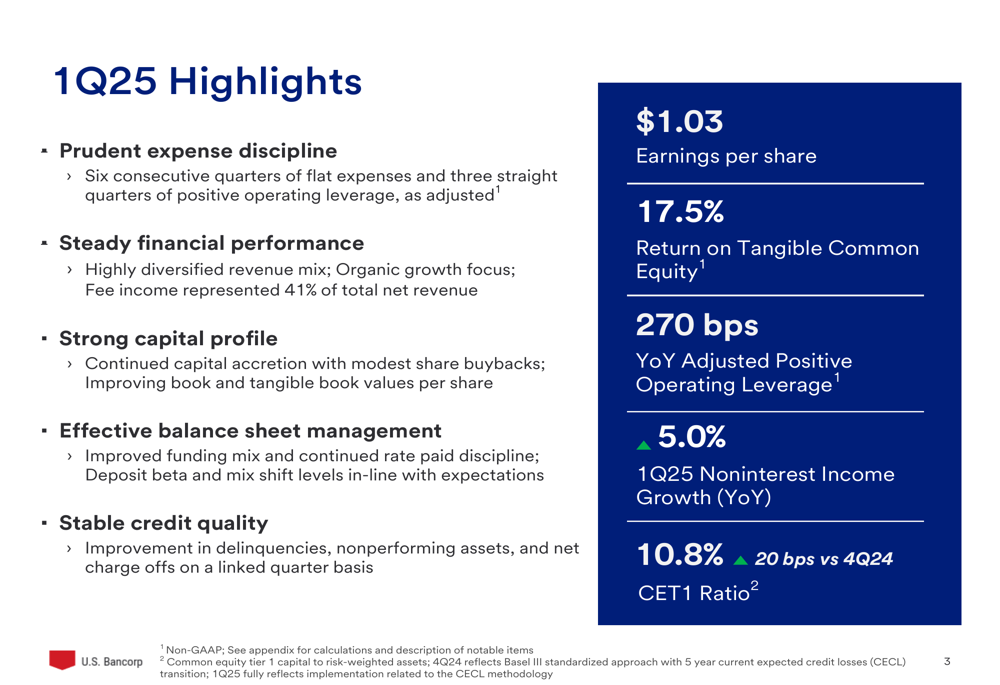
Quarterly Performance Highlights
U.S. Bancorp reported net income of $1.71 billion for Q1 2025, representing a 12.6% increase year-over-year but a 2.1% decrease compared to the previous quarter. The bank’s diluted earnings per share of $1.03 showed a 14.4% improvement from the same period last year.
Total (EPA:TTEF) assets stood at $676.5 billion, with earning assets of $613.8 billion. Loans increased 0.9% quarter-over-quarter to $381.8 billion, while deposits decreased 1.1% to $512.5 billion, which the bank attributed to seasonal patterns and continued pricing discipline.
The comprehensive results summary provides a detailed view of the bank’s performance across key financial metrics:
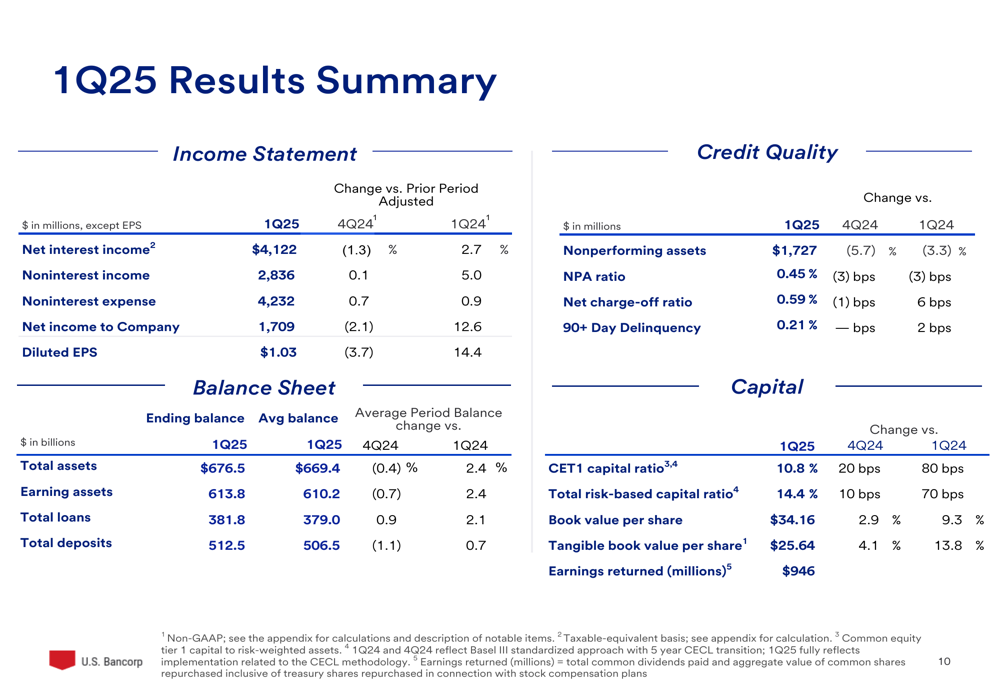
Credit quality remained stable with improvements in several key metrics. The nonperforming assets ratio decreased to 0.45%, down 3 basis points both quarter-over-quarter and year-over-year. The net charge-off ratio improved slightly to 0.59%, down 1 basis point from the previous quarter but up 6 basis points year-over-year.
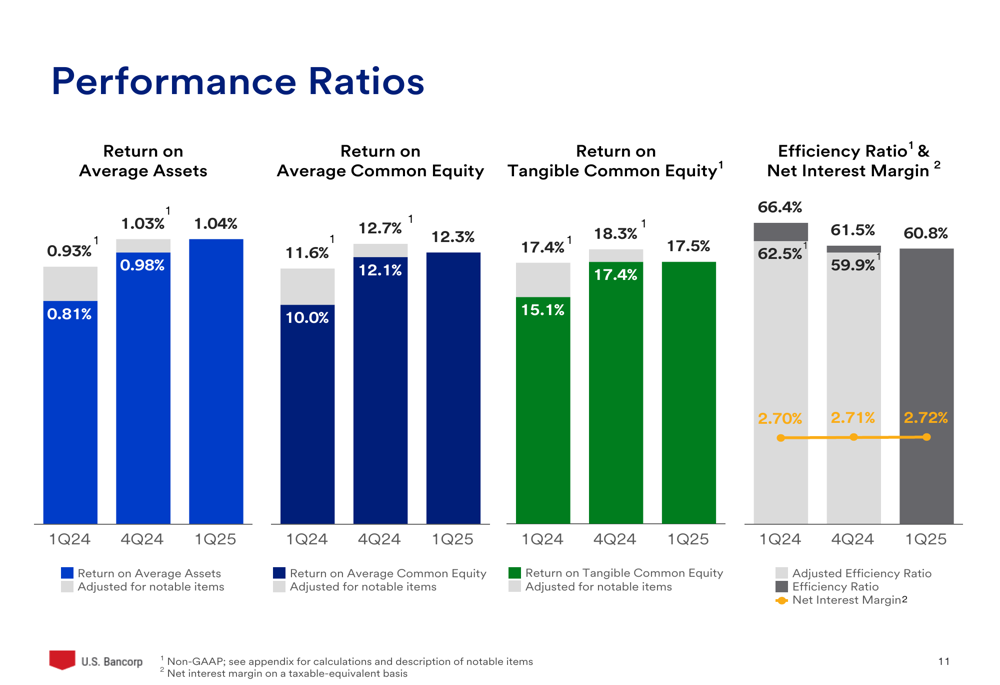
The bank’s performance ratios showed consistent improvement, with return on average assets increasing to 1.03% from 0.93% a year ago, and the adjusted efficiency ratio improving to 60.8% from 62.5% in the same period:
Strategic Priorities and Medium-Term Targets
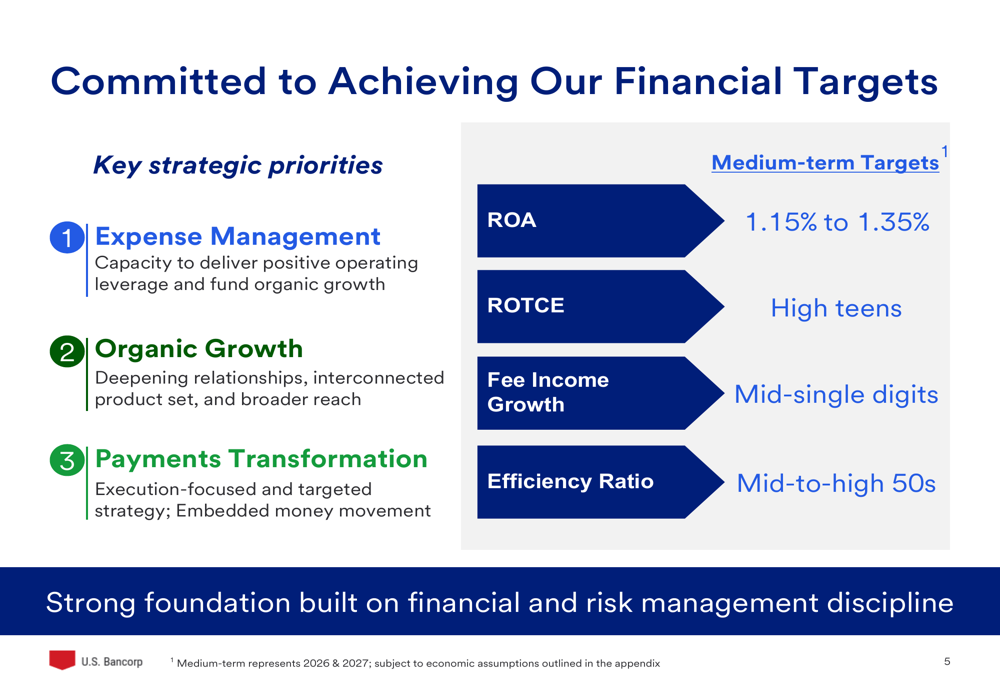
U.S. Bancorp outlined three key strategic priorities to achieve its medium-term financial targets: expense management, organic growth, and payments transformation. The bank aims to deliver positive operating leverage while funding organic growth initiatives, deepen client relationships through an interconnected product set, and execute a targeted payments strategy focused on embedded money movement.
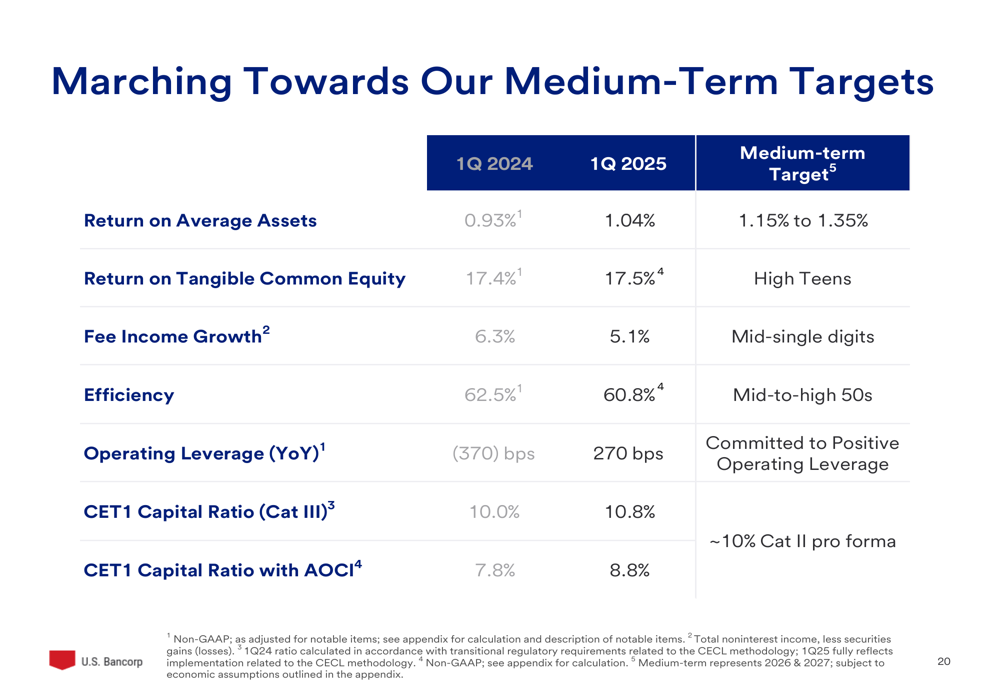
For 2026-2027, U.S. Bancorp has set ambitious medium-term targets, including a return on assets of 1.15% to 1.35%, return on tangible common equity in the high teens, mid-single-digit fee income growth, and an efficiency ratio in the mid-to-high 50s.
The following slide illustrates the bank’s strategic priorities and medium-term financial targets:
The bank is making measurable progress toward these targets, as shown in the comparison between current performance and medium-term goals:
Expense Management and Operating Leverage
A cornerstone of U.S. Bancorp’s strategy is its disciplined approach to expense management. The bank has maintained flat expenses for six consecutive quarters while delivering positive operating leverage for three straight quarters. This has been achieved through four key initiatives: real estate rationalization, organizational simplicity, AI/automation, and location optimization.
The following chart illustrates the bank’s expense discipline and the resulting positive operating leverage:
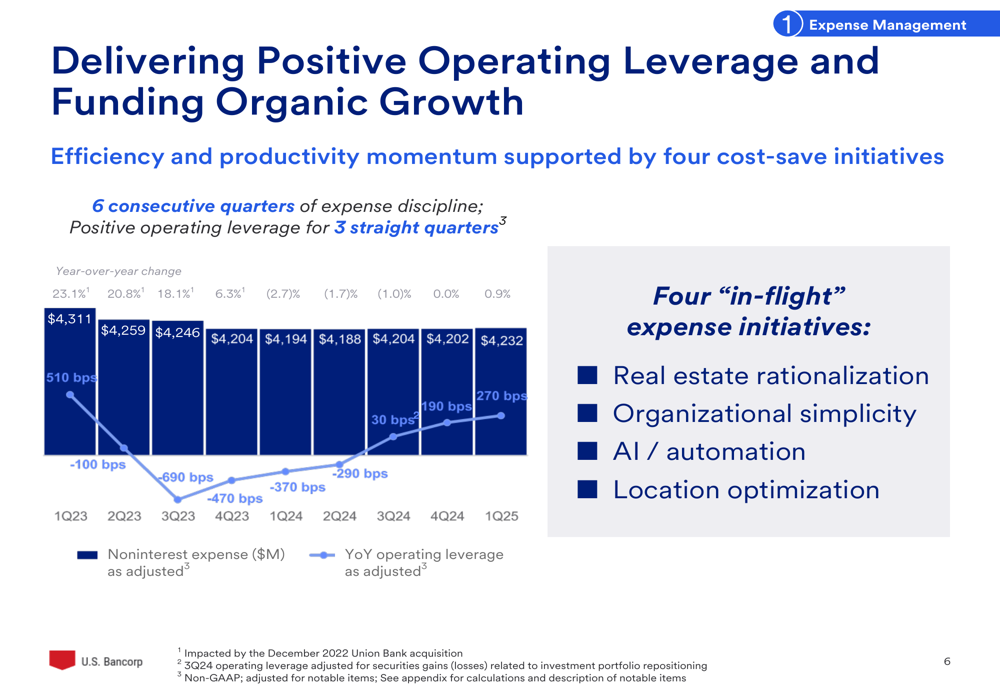
This expense discipline has enabled U.S. Bancorp to invest in growth initiatives while improving efficiency. The adjusted efficiency ratio improved to 60.8% in Q1 2025 from 62.5% a year earlier, demonstrating progress toward the medium-term target of mid-to-high 50s.
Fee Income and Payments Business
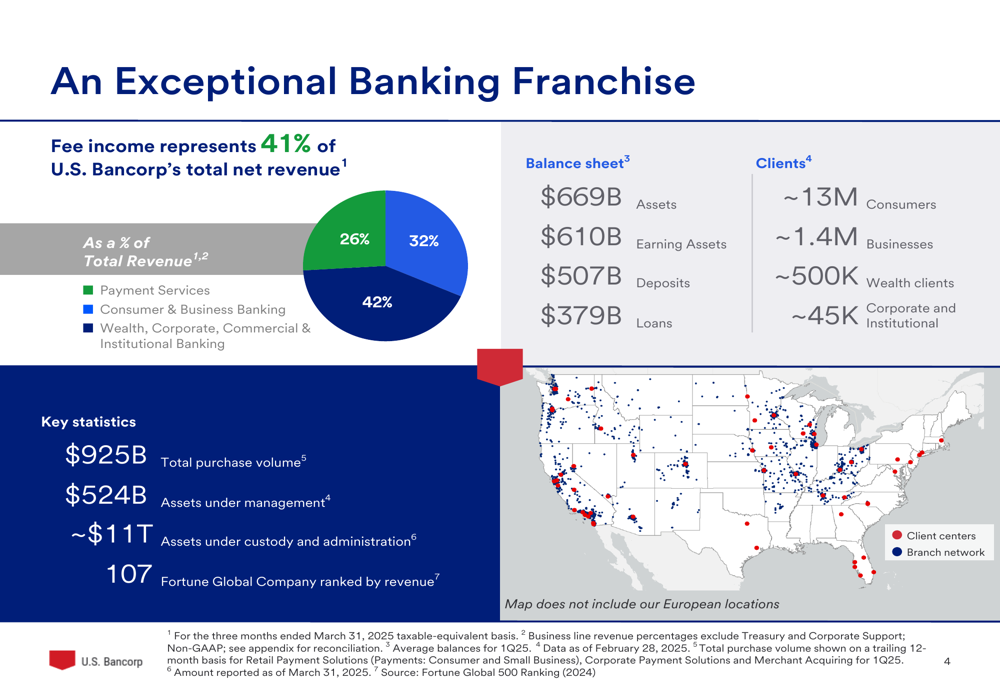
Fee income represented 41% of U.S. Bancorp’s total net revenue in Q1 2025, highlighting the bank’s diversified revenue mix. Noninterest income grew 5.0% year-over-year to $2.84 billion, driven by higher revenue across most fee income categories.
The bank’s exceptional franchise is built on a strong client base and diverse business mix:
U.S. Bancorp is prioritizing organic growth opportunities, with a focus on improving fee revenue momentum. The bank saw strong growth in trust and investment management, capital markets, and mortgage banking revenue in 2024:
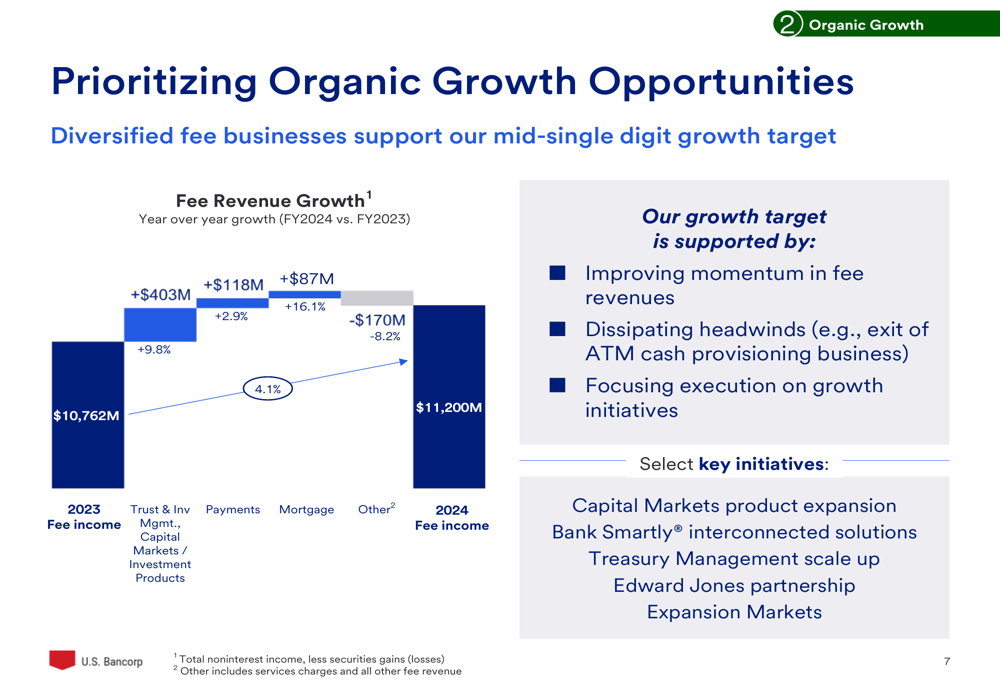
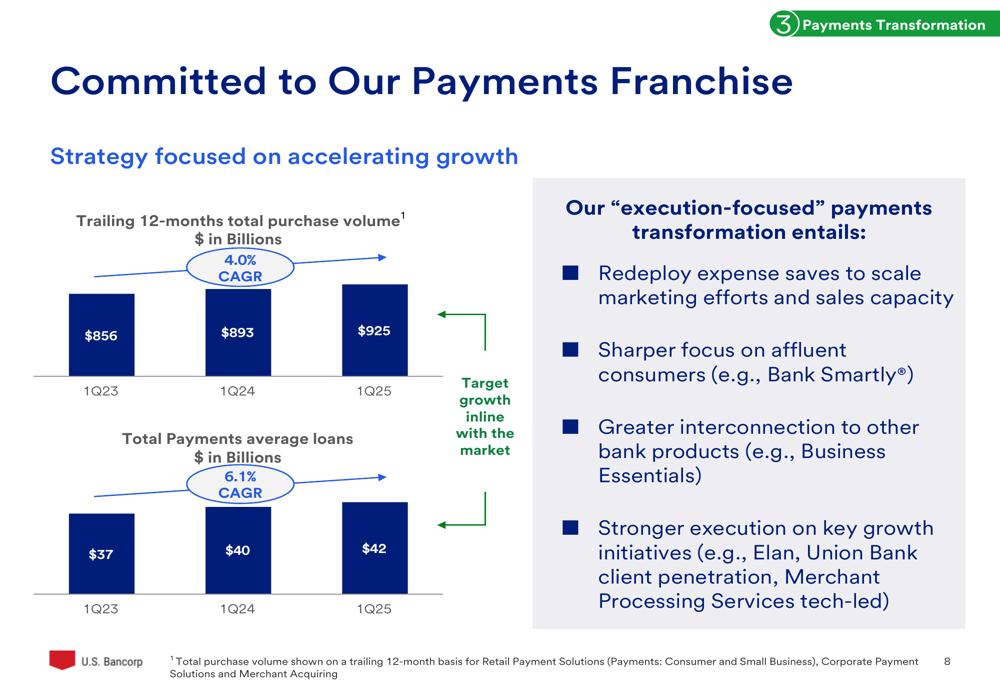
The payments business remains a key differentiator for U.S. Bancorp. The bank is committed to accelerating growth in this area through redeploying expense savings to scale marketing efforts and sales capacity, focusing on affluent consumers, and strengthening execution on key growth initiatives:
Balance Sheet and NIM Expansion Path
U.S. Bancorp’s balance sheet showed modest growth, with total average loans increasing to $379 billion in Q1 2025 from $371 billion in Q1 2024. The bank maintained its investment portfolio at $171 billion, supporting a balanced approach to managing capital, liquidity, and interest rate risk.
The net interest margin (NIM) increased slightly to 2.72% in Q1 2025 from 2.71% in Q4 2024 and 2.70% in Q1 2024. Looking ahead, U.S. Bancorp expects NIM to expand to over 3.00% in the medium term, driven by loan growth/mix and fixed asset repricing, investment portfolio management and fixed repricing, and deposit mix and funding optimization.
The following slide outlines the bank’s projected balance sheet path and NIM expansion drivers:
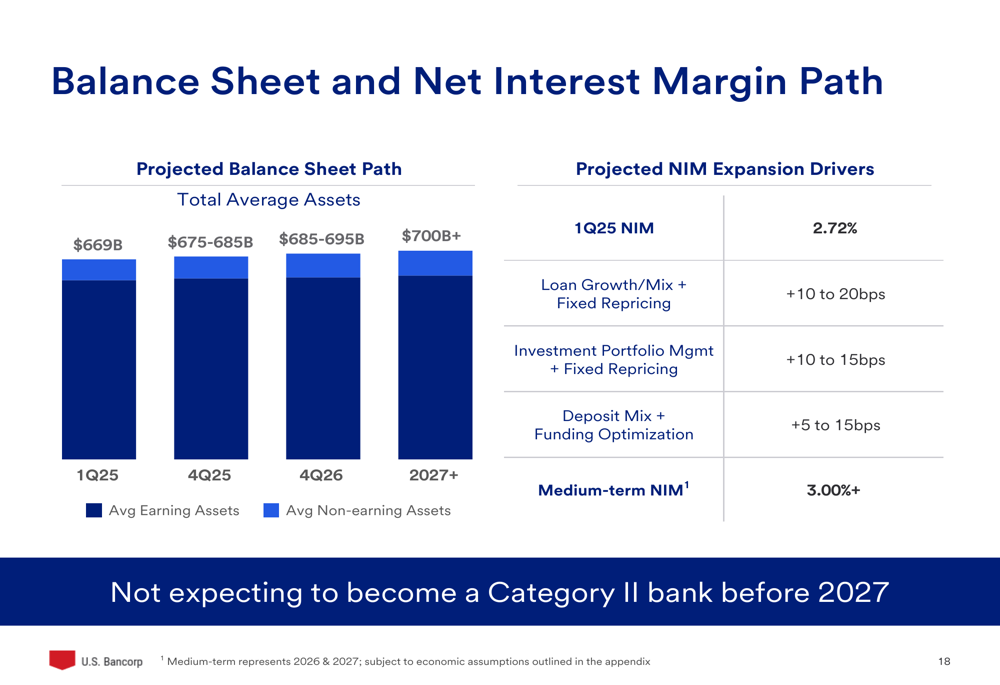
Importantly, U.S. Bancorp does not expect to become a Category II bank before 2027, which has implications for its regulatory requirements and capital planning.
Forward Guidance and Outlook
For the second quarter of 2025, U.S. Bancorp expects net interest income to be in the range of $4.1 billion to $4.2 billion, total noninterest income of approximately $2.9 billion, and total noninterest expense of $4.2 billion or lower. The bank anticipates delivering positive operating leverage of 200+ basis points year-over-year on an adjusted basis.
For the full year 2025, U.S. Bancorp projects total net revenue growth of 3% to 5% compared to 2024 and positive operating leverage of more than 200 basis points.
The detailed guidance for Q2 and FY 2025 is presented in the following slide:
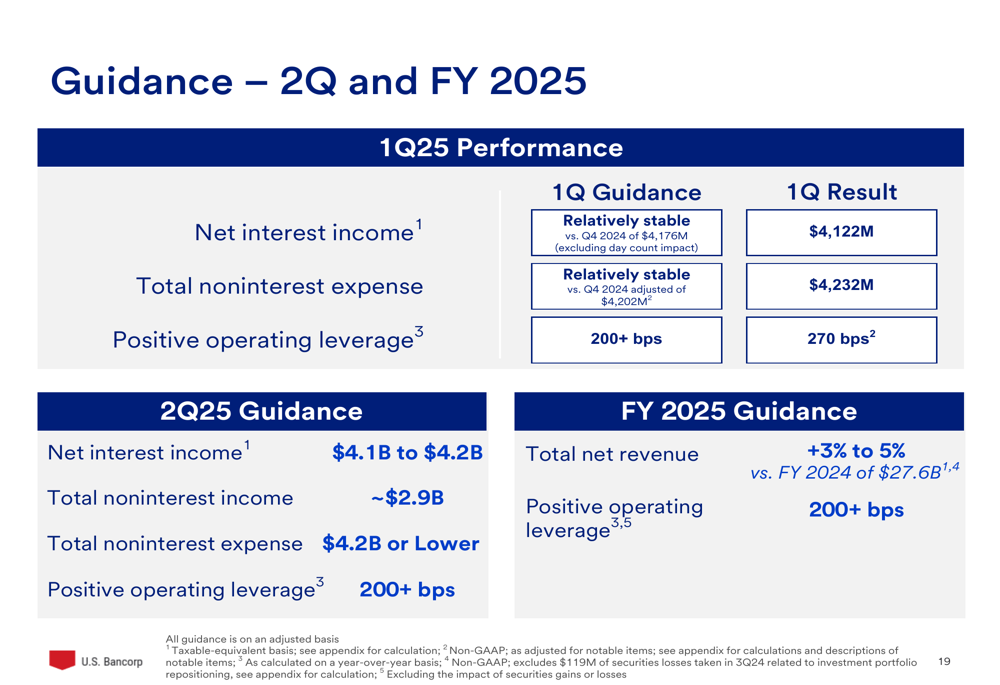
These projections are based on several key assumptions, including modest GDP growth, a stable unemployment rate, moderating inflation, current tax policy, a Fed Funds rate path consistent with market expectations (including two rate cuts in 2025), an upward-sloping yield curve driven by rate cuts, and stable credit quality.
Despite the positive outlook presented in the slides, investors should note that the stock declined following the earnings release, suggesting some market skepticism about the bank’s ability to achieve its targets in the current economic environment. The discrepancy between the reported EPS of $1.03 in the presentation and $1.30 mentioned in some earnings coverage also warrants attention and clarification from investors.
Overall, U.S. Bancorp’s Q1 2025 presentation depicts a bank making steady progress on its strategic priorities, with a clear path toward achieving its medium-term financial targets through disciplined expense management, organic growth initiatives, and a focused payments transformation strategy.
Full presentation:
This article was generated with the support of AI and reviewed by an editor. For more information see our T&C.