Microvast Holdings announces departure of chief financial officer

Executive Summary
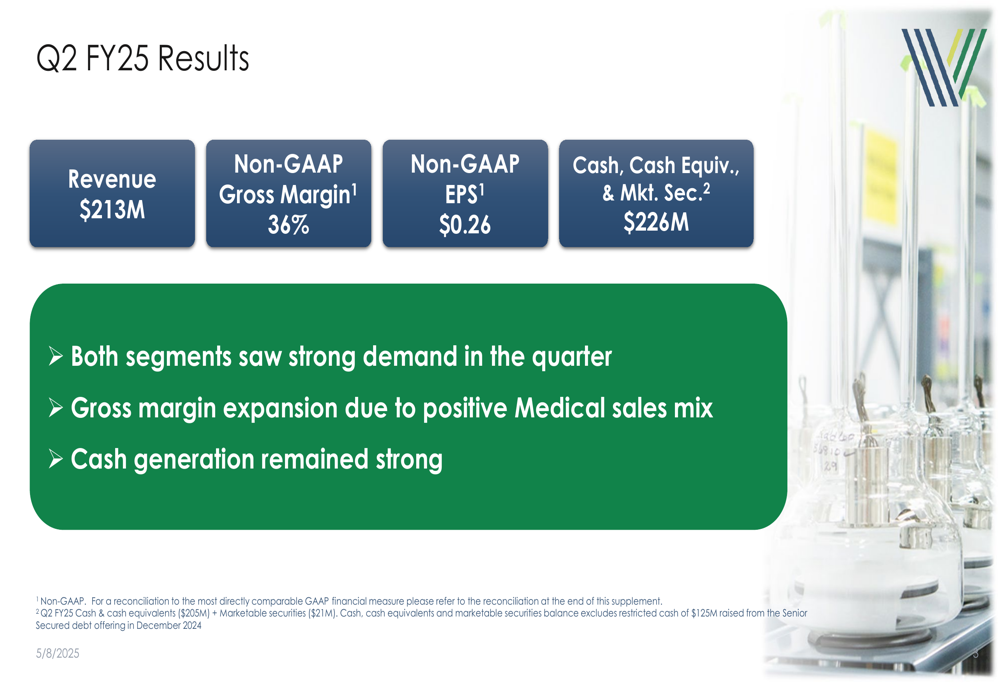
Varex Imaging Corporation (NASDAQ:VREX), a provider of medical and industrial imaging solutions, reported solid financial results for the second quarter of fiscal year 2025, with significant improvements in profitability metrics despite modest revenue growth. The company’s presentation, released on May 8, 2025, highlighted a 3% year-over-year revenue increase to $213 million, while non-GAAP earnings per share surged 63% to $0.26.
The strong performance was driven by margin expansion, with non-GAAP gross margin improving 350 basis points to 36%, and adjusted EBITDA increasing 38% to $34 million. However, the company’s guidance for Q3 FY25 suggests potential headwinds ahead, with projected revenue of $180-$200 million and non-GAAP EPS between ($0.05) and $0.10.
As shown in the following chart of Q2 FY25 key financial metrics:
Quarterly Performance Highlights
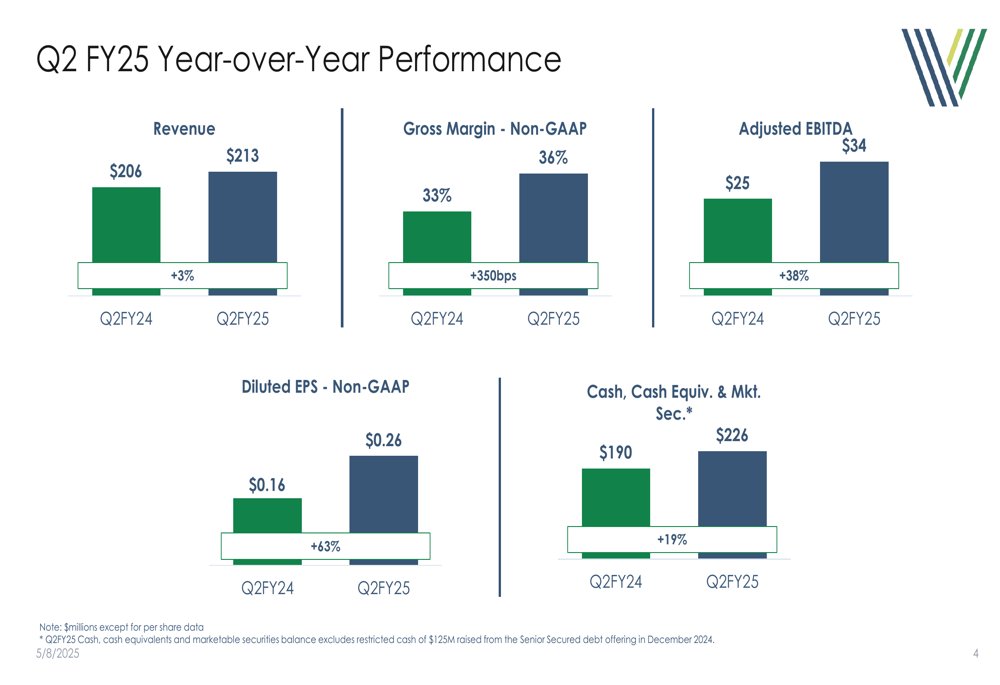
Varex delivered substantial year-over-year improvements across all major financial metrics in Q2 FY25. Revenue increased by 3% to $213 million compared to $206 million in the same quarter last year. More impressively, non-GAAP gross margin expanded by 350 basis points to 36%, driving a 63% increase in non-GAAP diluted EPS to $0.26.
The company’s adjusted EBITDA saw a significant 38% year-over-year increase to $34 million, reflecting improved operational efficiency and favorable product mix. Cash, cash equivalents, and marketable securities reached $226 million, a 19% increase from the prior year.
The following chart illustrates the year-over-year performance improvements:
On a GAAP basis, operating income increased substantially to $22 million (10% of revenue) compared to $8 million (4% of revenue) in Q2 FY24. GAAP diluted EPS improved to $0.17 from $0.03 in the prior year period. The company also reduced operating expenses to $55 million (26% of revenue) from $58 million (28% of revenue) in the same quarter last year.
Segment and Geographic Performance
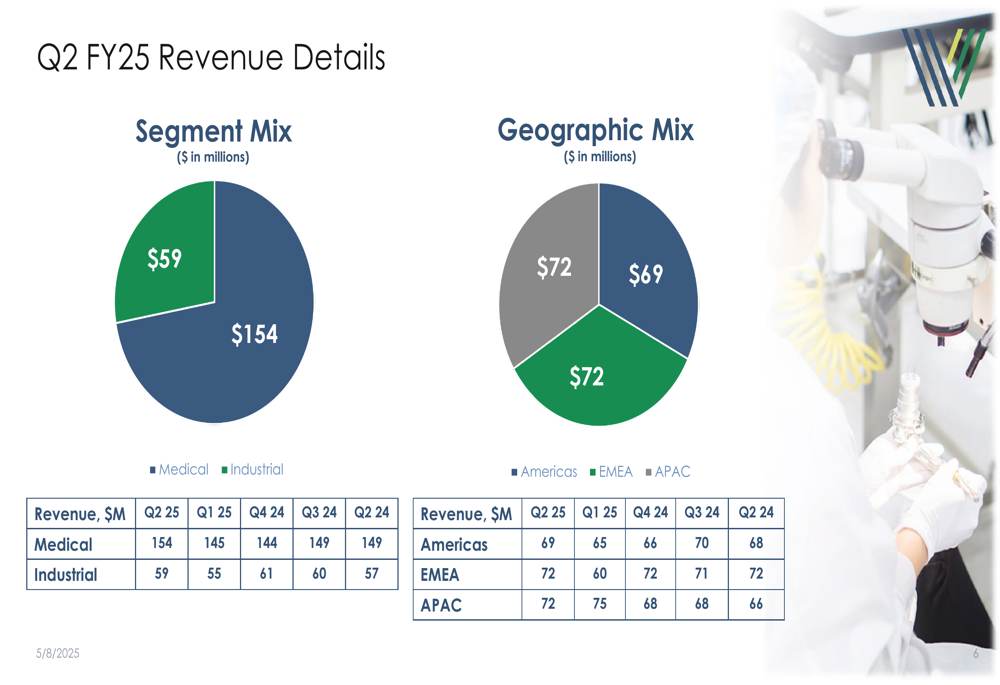
Both of Varex’s business segments contributed to the quarter’s growth. The Medical (TASE:BLWV) segment generated revenue of $154 million, up from $149 million in Q2 FY24, while the Industrial segment contributed $59 million, compared to $57 million in the prior year period.
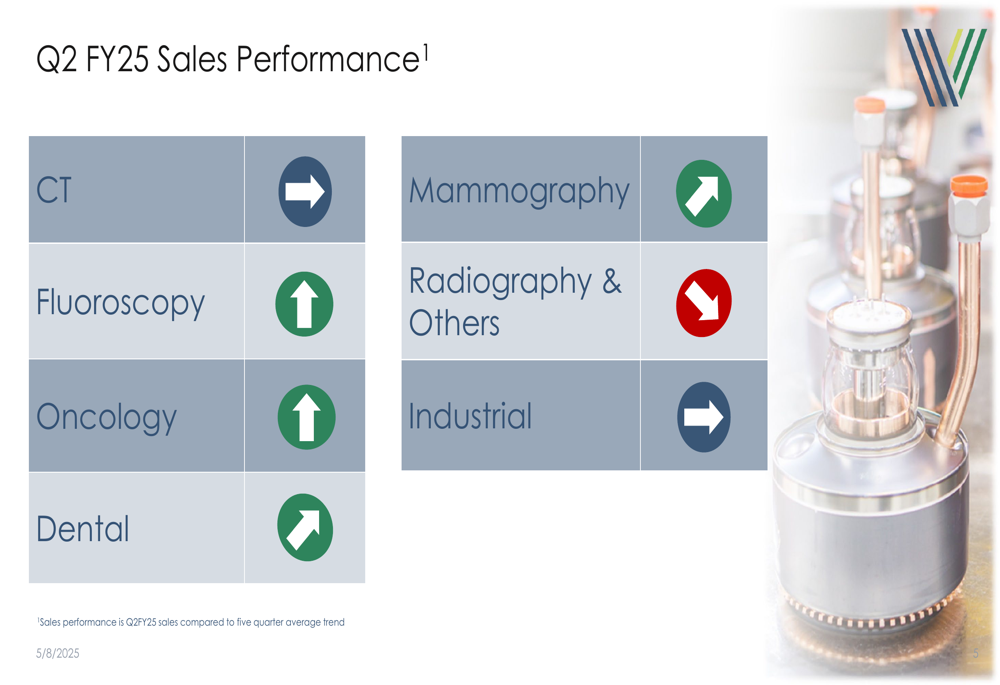
Within the Medical segment, several product lines showed positive momentum compared to the five-quarter average trend. Fluoroscopy, Oncology, Dental, and Mammography all trended upward, while CT remained flat and Radiography & Others declined.
The following slide shows the sales performance trends by product line:
Geographically, Varex maintained a balanced revenue distribution across its three major regions. The Americas contributed $69 million, EMEA (Europe, Middle East, and Africa) generated $72 million, and APAC (Asia-Pacific) also delivered $72 million in revenue. This geographic diversification helps mitigate regional market risks.
The following chart breaks down revenue by segment and geographic region:
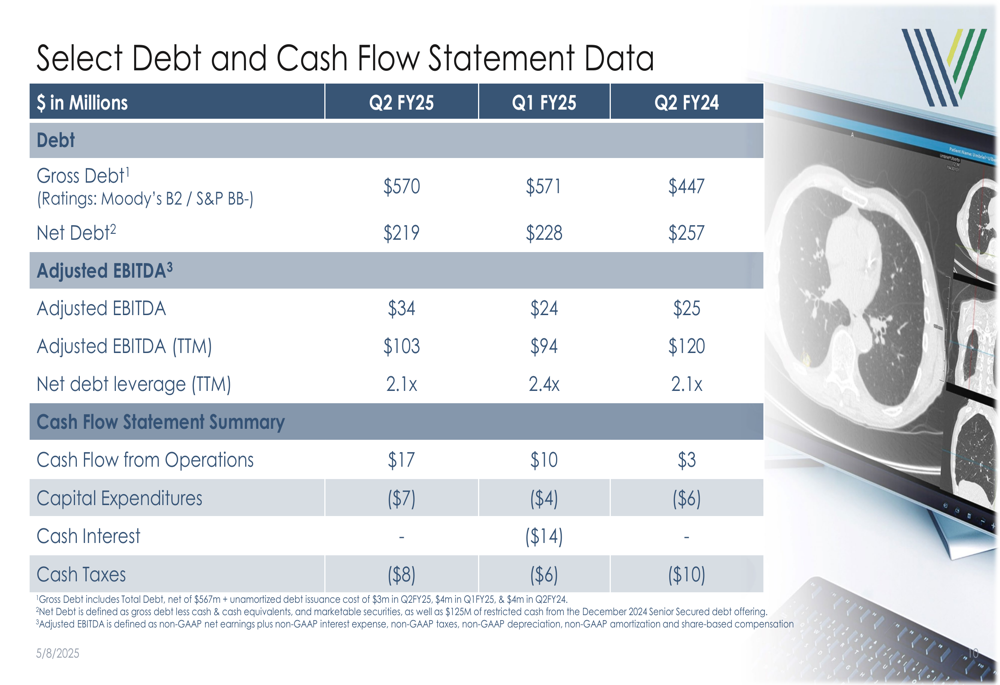
Balance Sheet and Cash Flow
Varex continued to strengthen its financial position during the quarter. Cash, cash equivalents, and marketable securities increased to $226 million, up from $219 million in Q1 FY25 and $190 million in Q2 FY24. This balance excludes $125 million of restricted cash raised from a Senior Secured debt offering in December 2024.
The company’s net debt decreased to $219 million from $228 million in the previous quarter and $257 million in the prior year period. With trailing twelve-month adjusted EBITDA of $103 million, the net debt leverage ratio improved to 2.1x from 2.4x in Q1 FY25.
Cash flow from operations showed significant improvement, reaching $17 million in Q2 FY25 compared to just $3 million in Q2 FY24. Capital expenditures were $7 million, resulting in free cash flow of approximately $10 million for the quarter.
The following slide provides details on the company’s debt position and cash flow:
Working capital metrics also improved, with Days Sales Outstanding (DSO) decreasing to 62 days from 67 days in the prior year period, indicating more efficient collection of receivables.
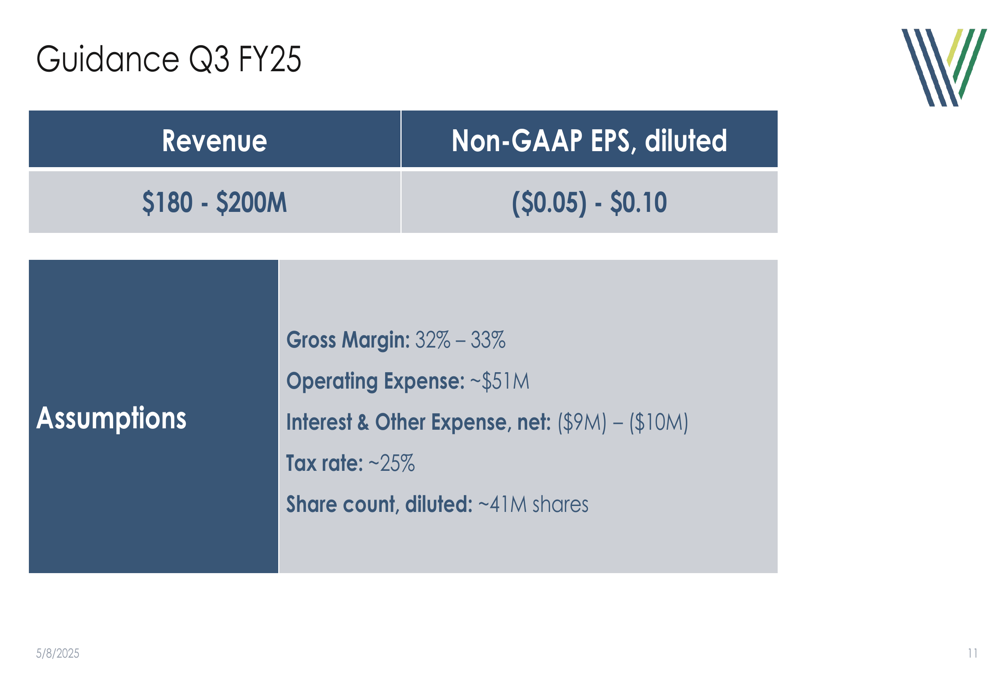
Guidance and Forward-Looking Statements
Despite the strong Q2 performance, Varex provided a more cautious outlook for the third quarter of fiscal year 2025. The company expects revenue to range between $180 million and $200 million, which would represent a sequential decline from Q2. Non-GAAP diluted EPS is projected to be between ($0.05) and $0.10.
The guidance assumes a gross margin of 32-33%, down from the 36% achieved in Q2 FY25, suggesting potential challenges in product mix or pricing. Operating expenses are expected to remain relatively stable at approximately $51 million.
The following slide details the company’s guidance for Q3 FY25:
This cautious outlook aligns with some of the challenges mentioned in previous earnings calls, including competitive pressures from Asia-based manufacturers and market conditions in China. However, the company’s strong cash position provides financial flexibility to navigate these challenges while continuing to invest in growth initiatives.
In extended trading following the earnings release, Varex shares were trading at $8.65, up 6.12% from the closing price of $8.17, suggesting a positive initial market reaction to the Q2 results despite the cautious Q3 guidance. However, the stock remains significantly below its 52-week high of $16.93, reflecting ongoing market concerns about the company’s long-term growth prospects in a competitive imaging market.
Full presentation:
This article was generated with the support of AI and reviewed by an editor. For more information see our T&C.