Novo Nordisk, Eli Lilly slide after Trump comments on weight loss drug pricing

Introduction & Market Context
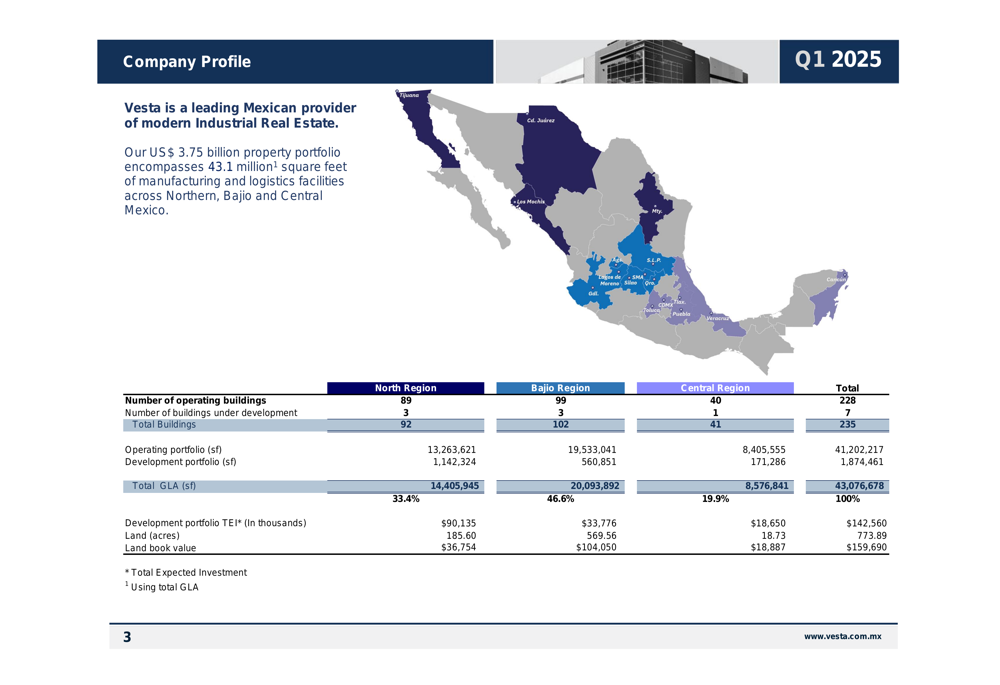
Corporacion Inmobiliaria Vesta (BMV:VESTA), a leading Mexican industrial real estate developer, presented its Q1 2025 financial results on April 24, 2025, highlighting solid operational performance despite facing market valuation challenges. The company, which owns and manages a portfolio valued at US$3.75 billion, reported continued growth in its core financial metrics while maintaining high occupancy rates across its industrial properties.
Vesta’s portfolio now encompasses 43.1 million square feet of manufacturing and logistics facilities spread across 235 buildings in three key Mexican regions. The company’s presentation revealed a striking disconnect between its operational performance and market valuation, with shares trading at a significant discount to net asset value.
Quarterly Performance Highlights
Vesta reported total revenues of $67.1 million for Q1 2025, representing a 10.7% increase compared to the $60.6 million recorded in Q1 2024. This growth was accompanied by strong profitability metrics, with adjusted NOI increasing by 8.2% to $62.1 million and maintaining a robust margin of 95.7%.
As shown in the following financial summary:
Adjusted EBITDA rose by 9.3% to $55.3 million, resulting in an EBITDA margin of 85.2%. The company’s Funds From Operations (FFO) metric, which real estate investment companies often use to measure cash flow, increased to $45.0 million from $40.4 million in the prior year.
Despite these positive operational results, Vesta’s market capitalization decreased from Ps.56.7 billion to Ps.39.6 billion, reflecting broader market challenges or investor concerns not immediately evident in the company’s financial performance.
Portfolio Performance and Occupancy
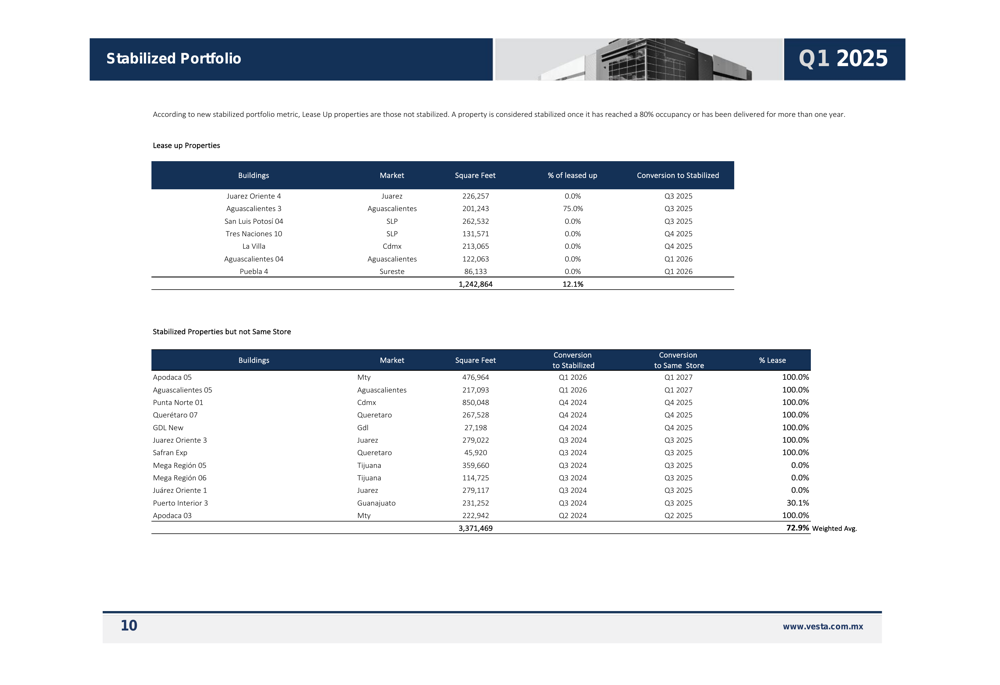
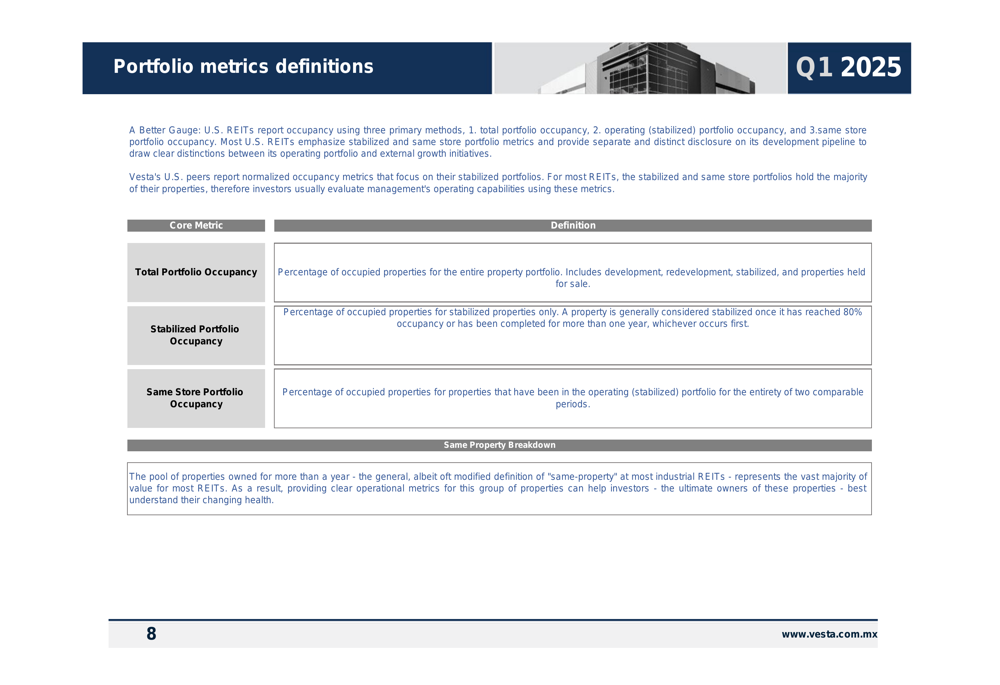
Vesta maintained high occupancy rates across its portfolio categories, demonstrating the continued demand for industrial real estate in Mexico. The same store portfolio, which includes properties held throughout the comparative periods, showed an impressive 97.4% occupancy rate. The stabilized portfolio registered 95.3% occupancy, while the total portfolio, including properties under development, stood at 92.8%.
The company’s portfolio metrics by region reveal strong performance across its geographical footprint:
The Central region achieved 100% occupancy across its 7.3 million square feet, while the North and Bajio regions maintained strong occupancy rates of 97.2% and 96.4%, respectively. These high occupancy levels support Vesta’s consistent revenue generation and underpin its strong NOI margins.
Historical portfolio metrics demonstrate Vesta’s ability to maintain high occupancy rates over time:
Development and Growth Strategy
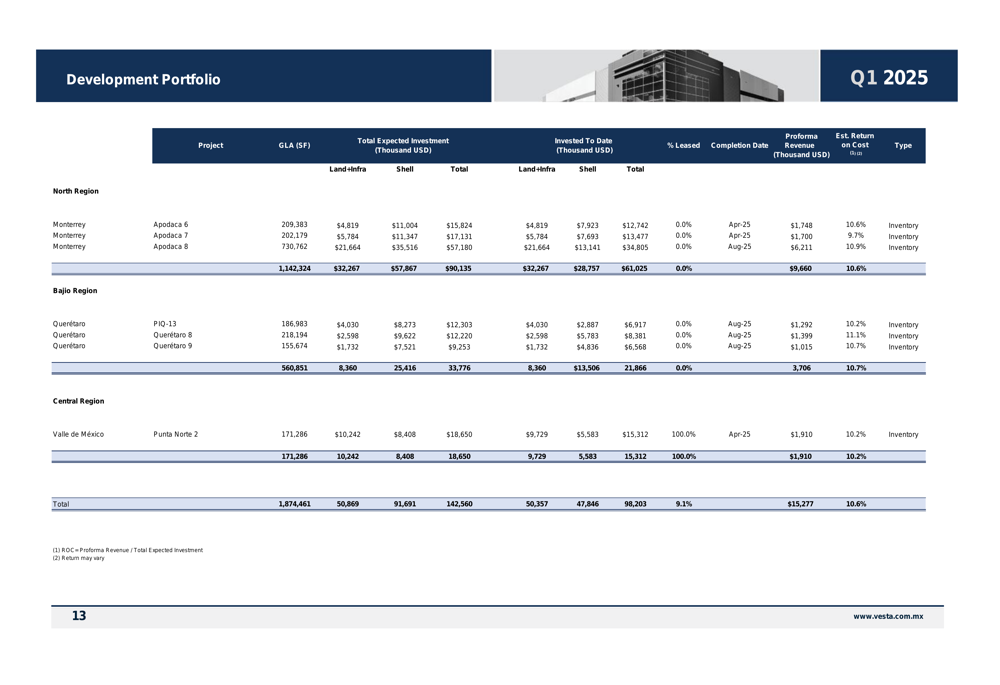
Vesta continues to invest in its future growth through an active development pipeline across its three operational regions. The company’s development portfolio includes projects totaling 1.87 million square feet with a total expected investment of $142.6 million.
The development strategy is illustrated in the following breakdown:
The North region represents the largest portion of development activity with 1.14 million square feet under construction and a total expected investment of $90.1 million. Meanwhile, the Central region has already secured 100% pre-leasing for its development projects, reducing leasing risk for that portion of the pipeline.
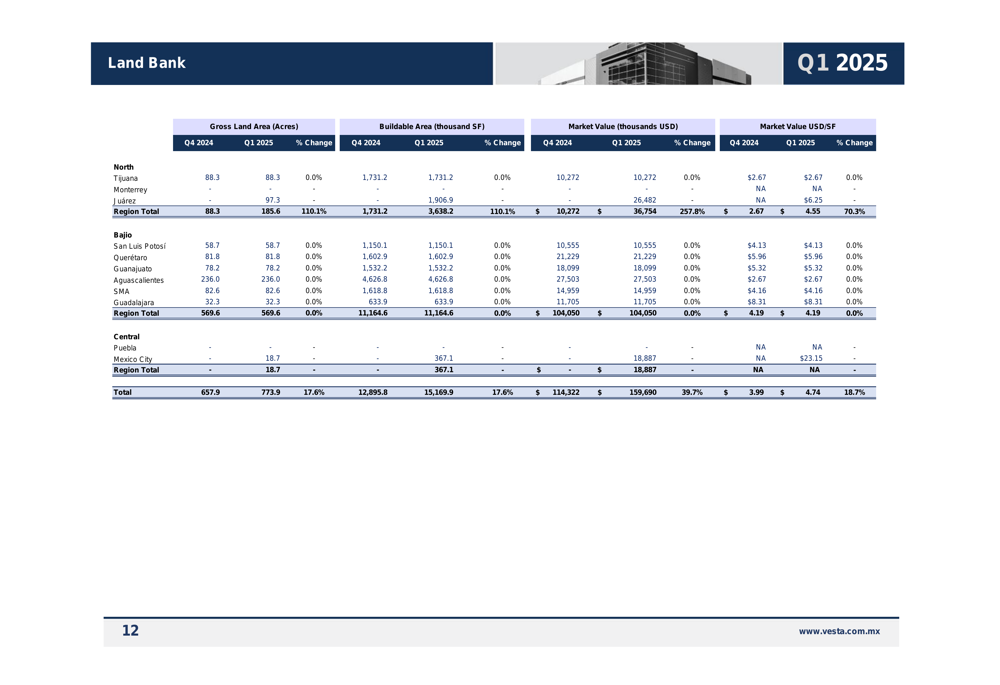
Supporting its long-term growth prospects, Vesta maintains a substantial land bank of 773.89 acres, with the majority (569.6 acres) located in the Bajio region. This land reserve provides significant capacity for future development as market conditions warrant.
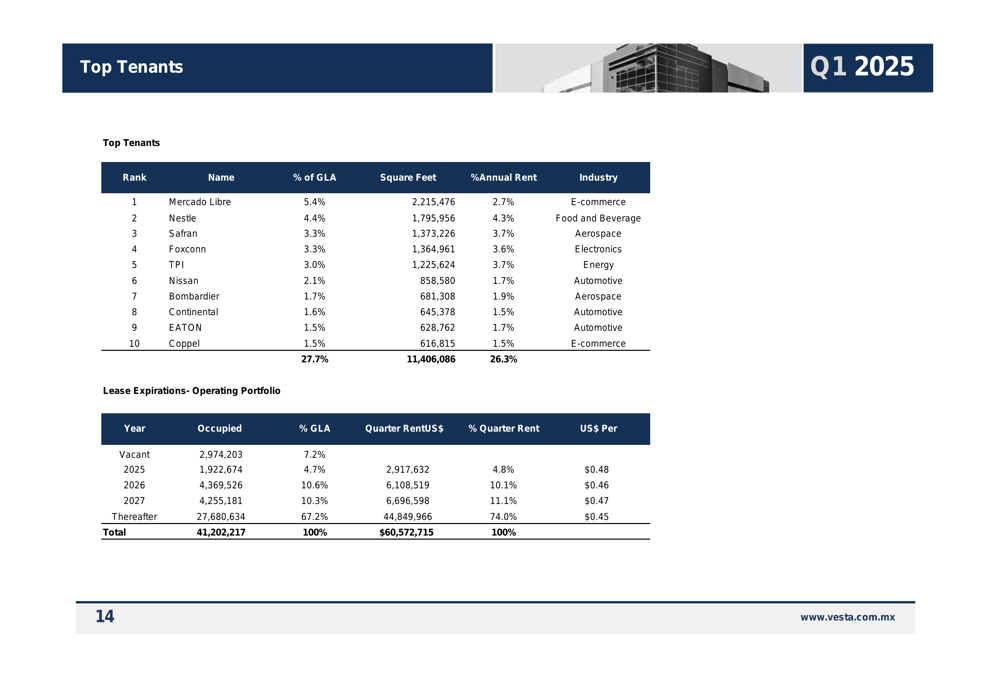
The company’s tenant diversification strategy is evident in its top tenant breakdown:
E-commerce giant Mercado Libre represents Vesta’s largest tenant at 5.4% of gross leasable area (GLA), while the top 10 tenants collectively account for 27.7% of the portfolio. This diversification helps mitigate tenant concentration risk while maintaining exposure to growing sectors of the Mexican economy.
Valuation and Market Perception
Perhaps the most striking aspect of Vesta’s presentation is the significant disconnect between the company’s net asset value (NAV) and its market price. As of Q1 2025, Vesta’s NAV per share stood at $3.53, while its market price was just $2.30, representing a discount of 34.7%.
This valuation gap is illustrated in the following chart:
The historical trend shows that while Vesta has typically traded at a discount to NAV in recent years, the current discount is particularly pronounced. This suggests potential undervaluation of the stock, especially considering the company’s strong operational performance and high occupancy rates.
Forward Outlook
Vesta’s leasing activity in Q1 2025 included 1,299 thousand square feet of renewals, demonstrating strong tenant retention. The company’s development pipeline and land bank position it well for future growth, while its reduced debt levels (down from $847.1 million to $801.2 million year-over-year) provide financial flexibility.
The significant discount to NAV presents both a challenge and an opportunity for Vesta. While the market appears to be undervaluing the company’s assets and cash flow generation, this valuation gap could potentially narrow if the company continues to deliver solid operational results and effectively communicates its value proposition to investors.
For investors, Vesta’s Q1 2025 presentation highlights a company with strong fundamentals and growth prospects in the industrial real estate sector, particularly as nearshoring trends continue to benefit Mexican industrial markets. The current valuation discount may represent an opportunity, though investors should consider the factors driving this market perception before making investment decisions.
Full presentation:
This article was generated with the support of AI and reviewed by an editor. For more information see our T&C.