Microvast Holdings announces departure of chief financial officer

Weatherford International PLC (NASDAQ:WFRD) released its first quarter 2025 investor presentation on April 23, revealing a significant revenue decline offset by substantial margin improvement and continued financial discipline. The oilfield services company reported a 12% year-over-year revenue drop while achieving a 354 basis point expansion in adjusted EBITDA margins.
Executive Summary
Weatherford reported Q1 2025 revenue of $1,193 million, down 11% sequentially and 12% year-over-year. Despite the revenue decline, the company achieved adjusted EBITDA of $253 million, representing a 25% year-over-year increase and a margin of 21.2% – up 354 basis points from the same period last year. Net income reached $76 million with basic earnings per share of $1.04.
As shown in the following comprehensive overview of Weatherford’s Q1 2025 performance, the company maintained strong financial discipline while continuing to return capital to shareholders:
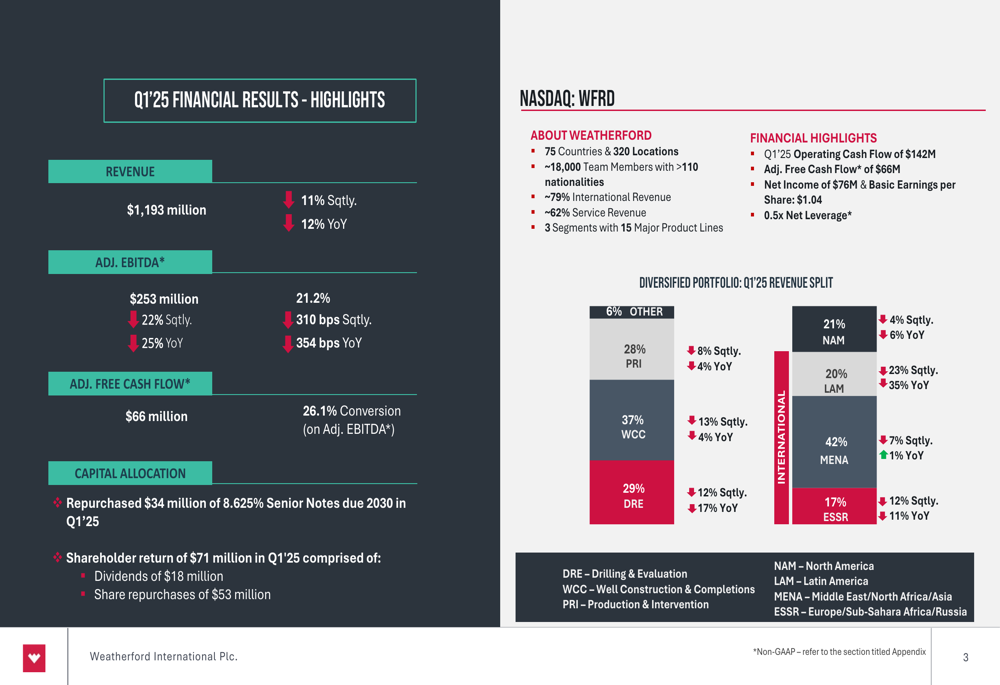
The company highlighted its global footprint spanning 75 countries with 320 locations and approximately 18,000 team members. International revenue accounts for approximately 79% of total revenue, with service revenue comprising about 62%. This diversification has helped Weatherford navigate challenging market conditions.
Quarterly Performance Highlights
Weatherford’s revenue declined across all segments and most regions in Q1 2025. The company’s consolidated revenue performance shows the sequential and year-over-year changes by geography and segment:
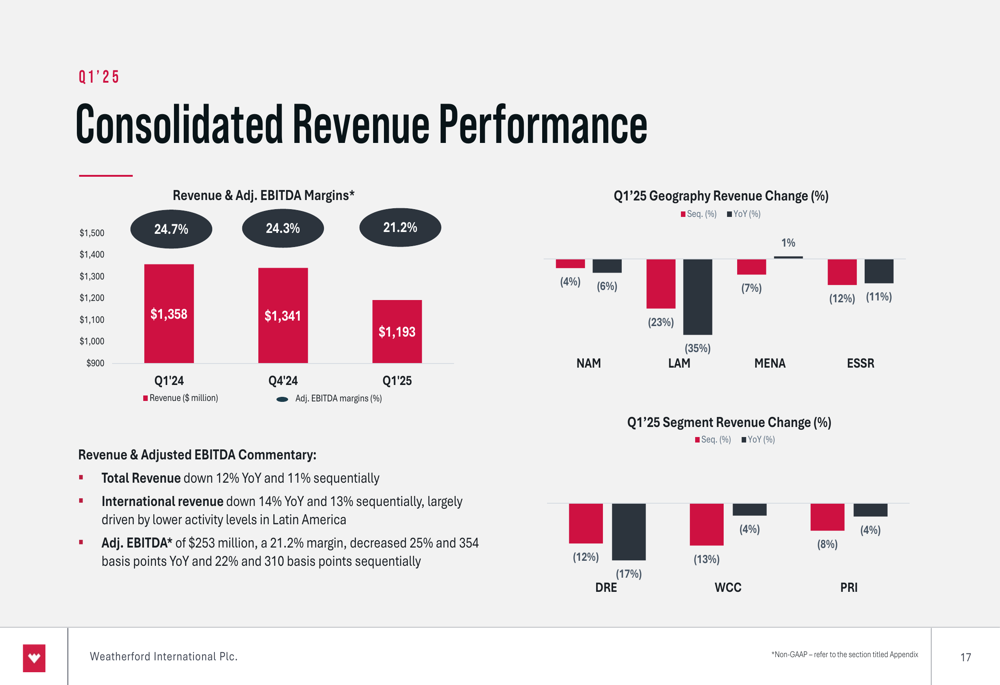
By segment, Drilling and Evaluation (DRE) revenue decreased 17% year-over-year, Well Construction and Completions (WCC) fell 4%, and Production and Intervention (PRI) declined 4%. Geographically, North America (NAM) revenue was down 6% year-over-year, Latin America (LAM) decreased 35%, Middle East and North Africa (MENA) grew slightly by 1%, and Europe/Sub-Saharan Africa/Russia (ESSR) declined 11%.
The consolidated financial summary provides a detailed breakdown of Weatherford’s performance metrics:
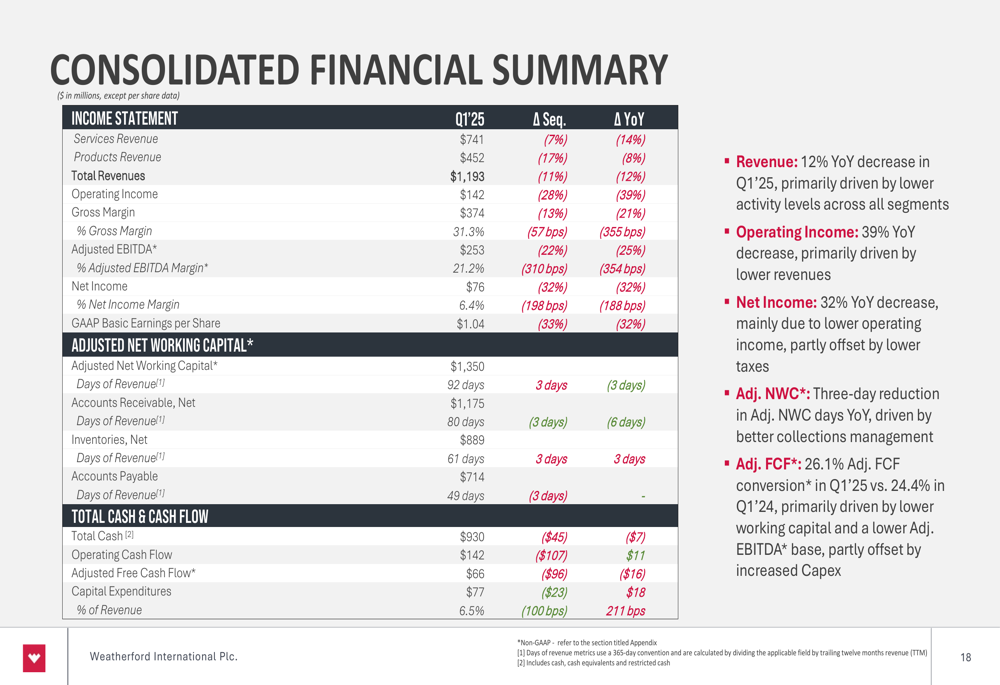
Despite the revenue challenges, Weatherford’s adjusted EBITDA margin improved significantly to 21.2%, up 354 basis points year-over-year. This margin expansion demonstrates the company’s ability to maintain profitability through operational efficiency and cost discipline even as revenue declined.
Balance Sheet & Capital Allocation
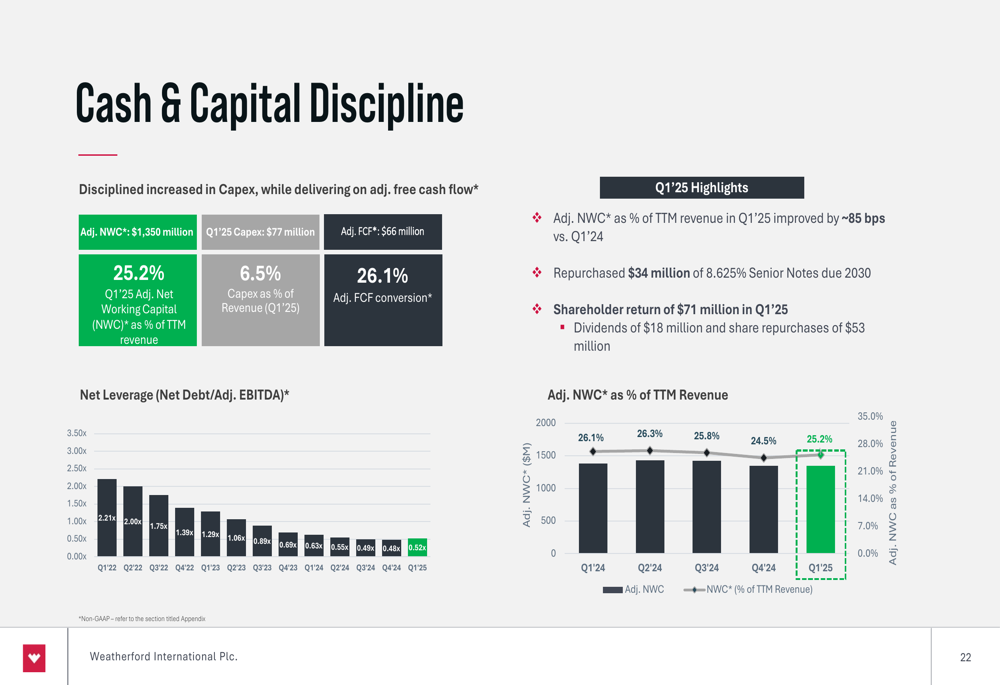
Weatherford maintained a robust balance sheet with total liquidity of $1.3 billion, including unrestricted cash and credit facility availability. The company’s net leverage ratio stands at a healthy 0.5x, reflecting its strong financial position.
The following slide illustrates Weatherford’s balance sheet strength and liquidity position:
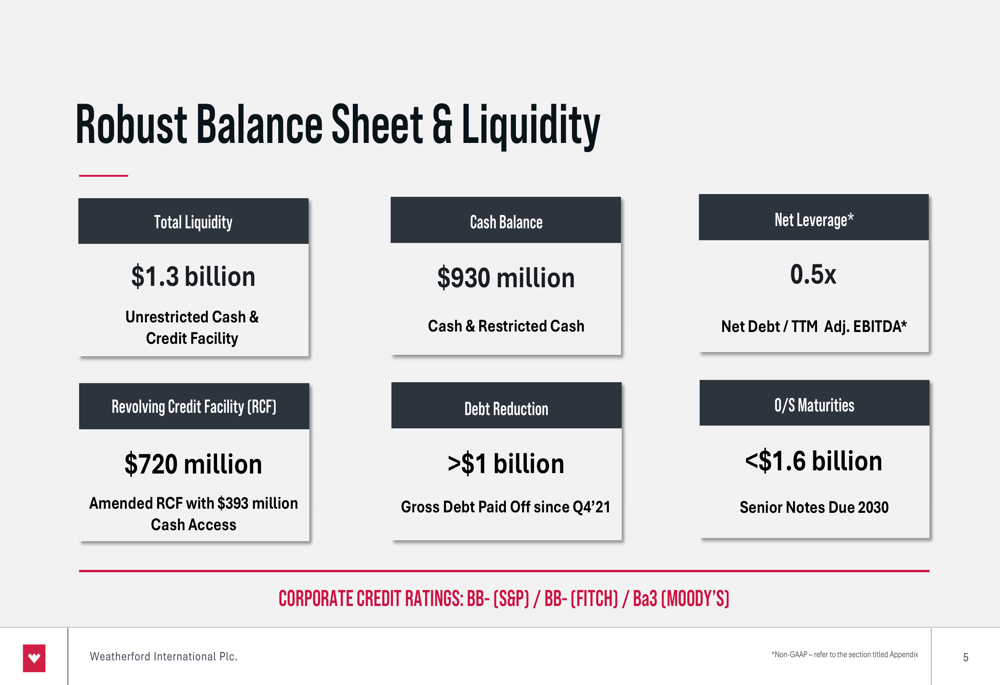
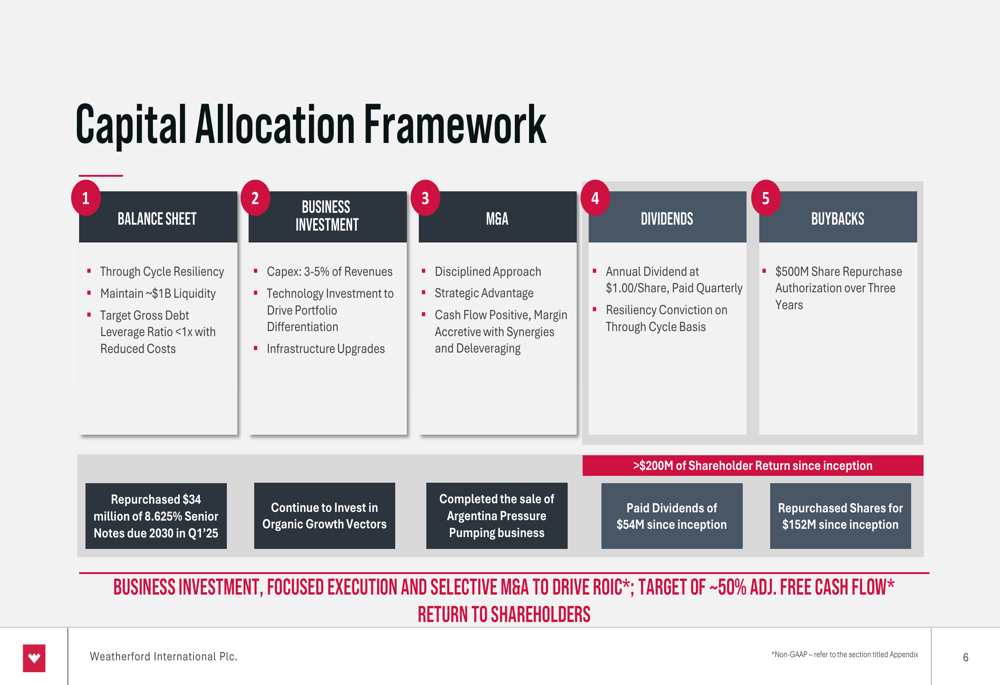
In line with its capital allocation framework, Weatherford returned $71 million to shareholders in Q1 2025, including $18 million in dividends and $53 million in share repurchases. Additionally, the company repurchased $34 million of its 8.625% Senior Notes due 2030, continuing its debt reduction strategy.
The company’s comprehensive capital allocation framework balances five key priorities:
Weatherford’s focus on cash and capital discipline has yielded significant improvements in working capital efficiency, with adjusted net working capital at 25.2% of trailing twelve-month revenue:
Strategic Priorities & Outlook
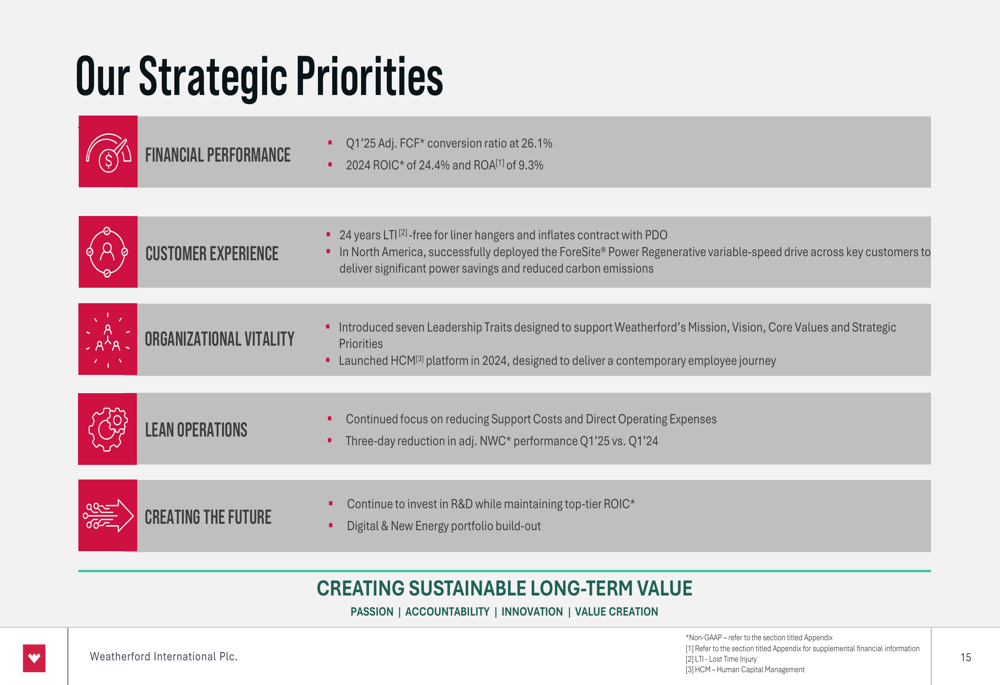
Weatherford outlined its strategic priorities focused on financial performance, customer experience, organizational vitality, LEAN operations, and creating the future. These priorities support the company’s goals of sustainable profitability and positive free cash flow.
The detailed strategic priorities showcase specific achievements across each focus area:
Looking ahead, Weatherford provided guidance for Q2 2025 and the full year:
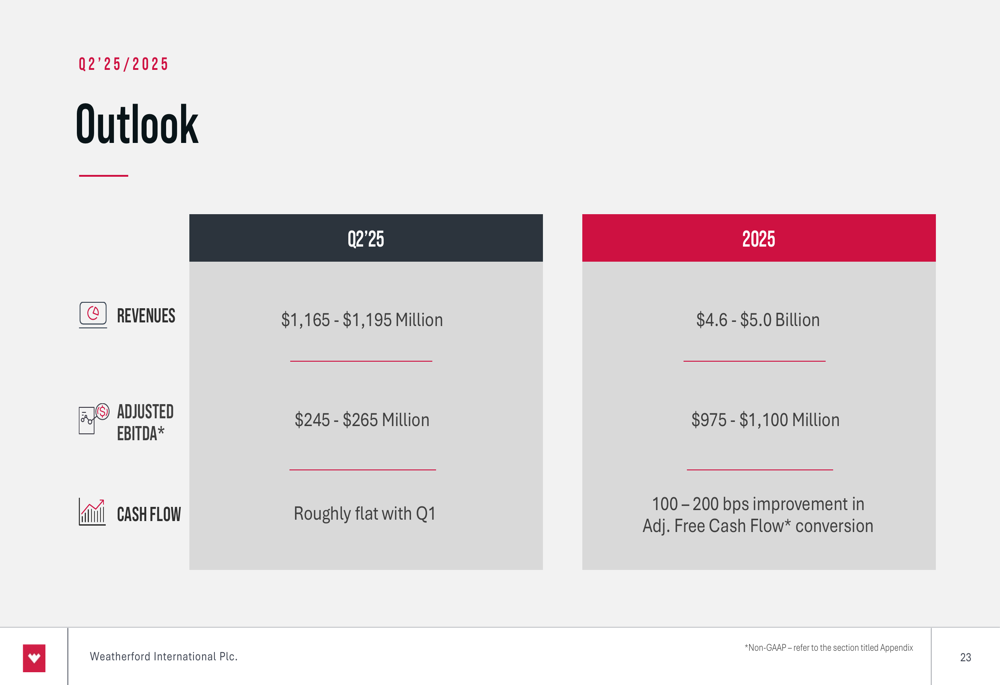
For Q2 2025, the company expects revenues of $1,165-$1,195 million and adjusted EBITDA of $245-$265 million, with cash flow roughly flat compared to Q1. For the full year 2025, Weatherford projects revenues of $4.6-$5.0 billion and adjusted EBITDA of $975-$1,100 million, with a 100-200 basis point improvement in adjusted free cash flow conversion.
Investment Thesis
Weatherford concluded its presentation by highlighting five key reasons to invest in the company:
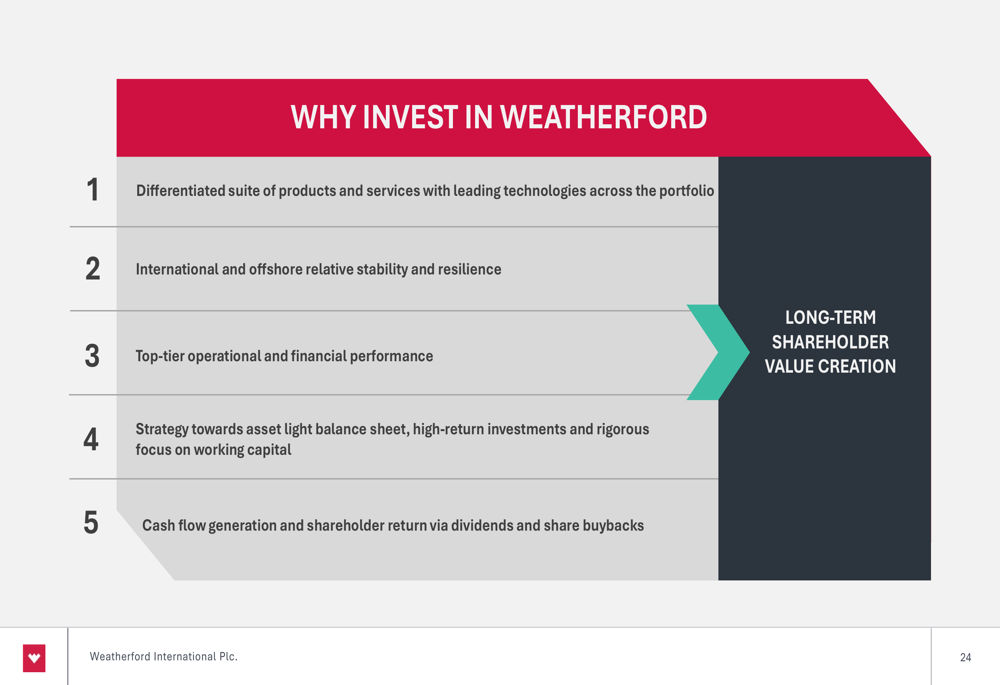
This investment thesis emphasizes Weatherford’s differentiated technology portfolio, international and offshore resilience, operational and financial performance, asset-light balance sheet strategy, and cash flow generation capabilities.
Market Context
The Q1 2025 results represent a significant shift from the company’s performance in late 2024. During Weatherford’s Q3 2024 earnings call, the company reported flat sequential revenue but 7% year-over-year growth, compared to the 11% sequential and 12% year-over-year decline in Q1 2025. This suggests a material deterioration in market conditions since late 2024.
However, Weatherford’s margin performance has improved considerably, with Q1 2025 showing stronger EBITDA margins than discussed in the Q3 2024 call. This aligns with the company’s stated strategy of prioritizing margin expansion and cash generation over revenue growth in challenging market conditions.
Weatherford’s stock closed at $44.97 on April 22, 2025, with a 52-week range of $36.74 to $135.00. The stock was down 2.13% in pre-market trading following the release of the Q1 results.
Full presentation:
This article was generated with the support of AI and reviewed by an editor. For more information see our T&C.