LATAM Airlines pilots in Chile to begin strike at midnight Wednesday
- Stocks are soaring, and valuations are skyrocketing, but there are still bargains aplenty
- Some stocks have rallied but still trade at very attractive P/E ratios
- Are these low P/E stocks worth buying, given their strong fundamentals and favorable technicals?
The price-to-earnings ratio is a cornerstone concept of fundamental analysis, playing a crucial role in gauging the appeal of a company’s valuation. Although limited in its insights when used in isolation, it serves as an excellent initial screening tool.
In this analysis, we'll spotlight three companies from the S&P 500 index that showcase a low P/E ratio.
Among them, Valero Energy (NYSE:VLO) stands out as particularly compelling. Its P/E (4.6x) is notably the lowest among all S&P 500 companies, making it an intriguing contender.
Equally noteworthy is Marathon Petroleum (NYSE:MPC), whose stock price has impressive long-term upside potential and a low P/E ratio of 5.1x, despite the recent rally.
Additionally, with a P/E ratio of 6.6x, The Mosaic Company's (NYSE:MOS) fair value index might serve as a signal for the potential end of a downtrend that has spanned over a year.
Let's take a deeper look into each of the aforementioned companies to better understand their future potential.
1. Valero Energy
In the final days of July, Valero Energy unveiled its Q2 results, sparking pleasant surprises in terms of earnings per share.
This unexpected performance not only set the stage for further upward momentum but also echoed the company's management during a conference call following the financial data release. The management spoke in an upbeat tone about wholesale sales and refining capacity:
"Our product demand demonstrated robustness, and our US wholesale system achieved a remarkable milestone by exceeding one million barrels per day in May and June. The new coke plant has not only expanded the refinery's capacity but has also enhanced its capability to manage increased volumes of heavy crude and residual feedstock."
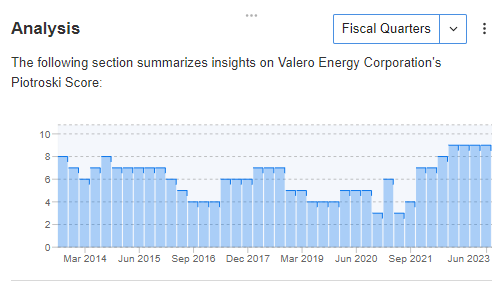
The management's optimistic stance resonates with the company's fundamentals. Apart from very good financial health and fair value indicators, the Piotroski index stands out with a remarkable score of 9 points.
Source: InvestingPro
The Piotroski index comprises a collection of 10 fundamental characteristics that collectively paint a comprehensive picture of a given company. Depending on how many points are fulfilled, the index assigns a score.
Consequently, it holds a crucial role in fundamental analysis, offering insights into a specific company's potential for upside or, conversely, its limitations.
2. Marathon Petroleum
Marathon Petroleum's stock has gone parabolic of late, making new all-time highs in the process, all while maintaining a low P/E ratio of 5.1x. It's worth noting, however, that there's a potential risk of a correction.
In light of this, a favorable scenario for those looking to buy the stock is during a correction when the stock price reaches the support level of around $136.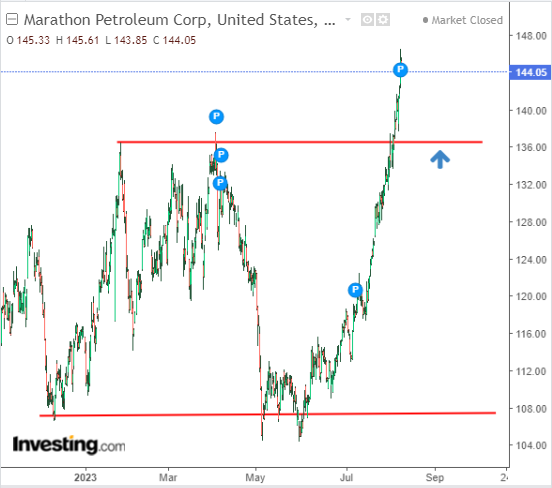
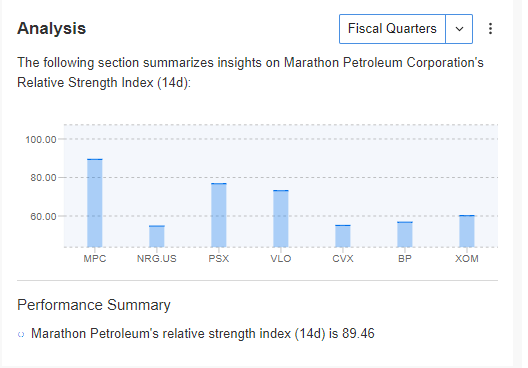
The risk of a correction is suggested, among other things, by the RSI indicator, which with a score of almost 90 points. It is currently in the zone of clear overbought.
Source: InvestingPro
3. The Mosaic Company
The Mosaic Company holds the title of being the largest U.S. producer of phosphate and potash fertilizers, with its operations centered in Florida.
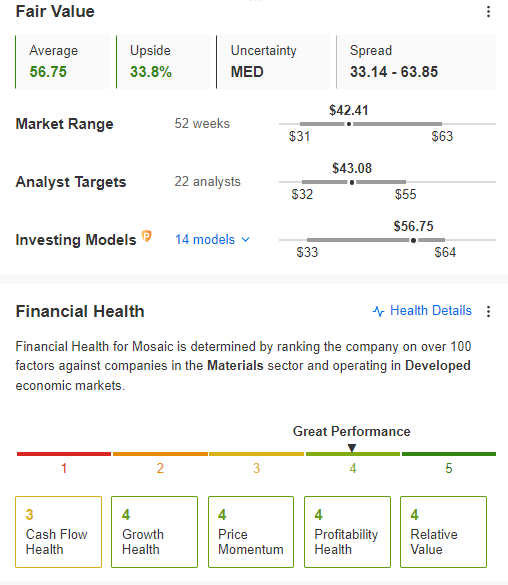
In terms of projected fair value, the company boasts the most substantial percentage return among the stocks mentioned, standing at an impressive 33.8%. Moreover, its financial health is strong.
Source: InvestingPro
If the stock manages to reach the target level of around $56 per share, it would signify a push toward its historical peak. However, to indicate a potential shift in the trend, we first need to observe a break in the trend line and overcome the local resistance around the $43 mark.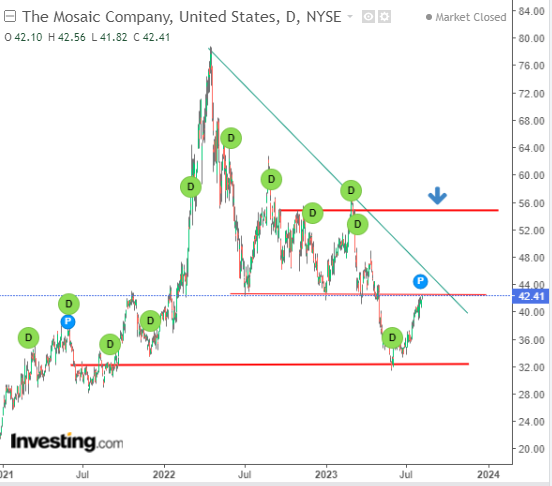
Source: InvestingPro
Adding to this positive outlook is the fact that the stock boasts a low P/E ratio of 6.6x. This further solidifies the upward scenario as the current base case. The key technical signal confirming this trend will be a breakout above the previously mentioned $43 area.
***
Disclaimer: This article is written for informational purposes only; it is not intended to encourage the purchase of assets in any way, nor does it constitute a solicitation, offer, recommendation, advice, counseling, or recommendation to invest. We remind you that all assets are considered from different perspectives and are extremely risky, so the investment decision and the associated risk are the investor's own.

