Walmart halts H-1B visa offers amid Trump’s $100,000 fee increase - Bloomberg
- Gold's trading volume has risen close to $150 billion per day, second only to forex and S&P 500.
- This comes after demand for the yellow metal during the first quarter was the strongest in 8 years.
- So, in this article, we will look at ways to profit if gold begins to rally once again.
- Want to invest by taking advantage of gold opportunities? Don't hesitate. Try InvestingPro: sign up HERE & NOW for less than $10 per month, and get almost 40% off for a limited time on your 1-year plan!
Since October 2023, gold futures have skyrocketed from $1,823.50 to a record-breaking $2,448.80 in April, fueled by a confluence of factors such as elevated geopolitical risks, persistent inflation in the US, and the expectation of a new rate-cut cycle the main central banks around the world.
The yellow metal is experiencing its strongest first-quarter demand in eight years, with daily trading volumes second only to currencies and the S&P 500, at a staggering $150 billion.
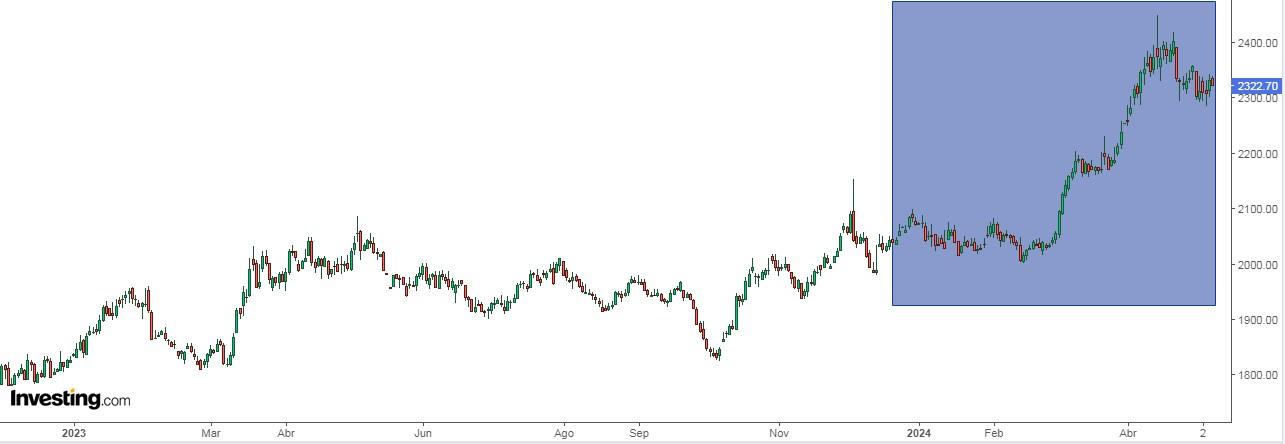
What's Driving the Gold Rally?
- Geopolitical Turmoil: The ongoing war in Ukraine, tensions in the Middle East, and international sanctions have heightened investor anxiety, driving them towards safe-haven assets like gold.
- Central Bank Buying Spree: Central banks, particularly those in China and India, are aggressively accumulating gold reserves. China's central bank, the People's Bank of China, added 27 tonnes to its holdings in the first quarter, marking its 17th consecutive monthly increase. This strategic move is likely driven by a desire to diversify their reserves and reduce dependence on the US dollar, especially in light of potential future sanctions.
- Weaker Dollar: A weakening US dollar makes gold more attractive to international investors, as it becomes cheaper to buy.
- Falling Interest Rates: With expectations of the Fed lowering interest rates in the near future, gold's appeal increases. When interest rates fall, the return on traditional investments like bank deposits diminishes, making gold a more attractive alternative.
Looking to Invest in Gold?
While futures and CFDs offer ways to participate in the gold market, there are other options for investors seeking long-term exposure.
- SPDR Gold Shares (NYSE:GLD): This popular ETF, launched in 2004, tracks the price of gold and boasts over $74 billion in assets under management. It comes with a low expense ratio of 0.40% and is listed on major exchanges like the NYSE, Singapore Stock Exchange, Tokyo Stock Exchange, and Hong Kong Stock Exchange.
- Gold Mining Stocks: Owning shares in gold mining companies offers an indirect way to play the gold market. The performance of these stocks is often tied to the price of gold, but additional factors like company-specific performance can also influence their share price.
Below, we will delve deeper into specific gold mining stocks you can consider investing in.
1. Agnico Eagle Mines Limited
Agnico Eagle Mines Limited (NYSE:AEM) is the world's third-largest gold producer and has increased its reserve base for three consecutive years by developing early-stage projects it bought in recent years. Most of its production is in Canada, but it also has operations in Finland, Australia, and Mexico.
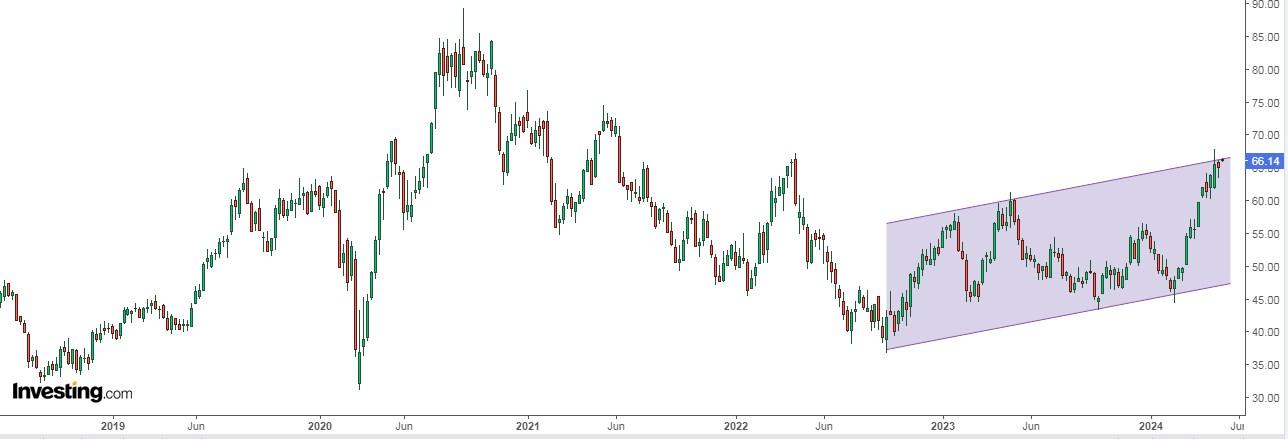
Its dividend yield is 2.42%. On July 31 it presents its results and is expected to increase EPS by 76.77% and revenues by 18.89%.
It reported a strong first quarter and achieved record operating margins and free cash flow for the second consecutive quarter, plus revenues of more than $1.8 billion, a reduction in net debt to $1.3 billion and an expansion of the revolving credit facility to $2 billion. It also received a credit rating upgrade to BAA1 from Moody's (NYSE:MCO).
The potential target could be $73.18.
2. Barrick Gold
Barrick Gold Corp (NYSE:GOLD) is a mining company engaged in gold extraction, production, and sale, in addition to related activities such as exploration and mine development.
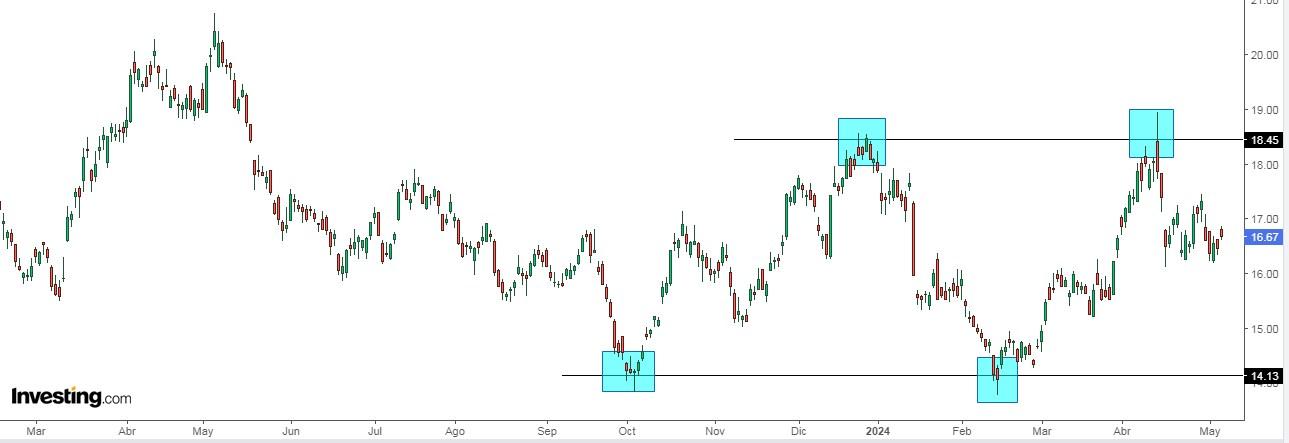
Its dividend yield is 2.40%. On August 5 it presents its accounts and for 2024 it forecasts an increase in EPS of 35.1% and revenues of 8.9%.
Its fair value, based on its fundamentals, is at $20.05 and the market gives it potential at $20.5-21.
3. Franco-Nevada
Franco-Nevada (NYSE:FNV) is a gold royalty company based in Toronto, Canada, which has a diversified portfolio and is listed on the Toronto Stock Exchange and the New York Stock Exchange.
On June 27 it distributes a dividend of $0.36 per share and to receive it, shares must be held by June 13.
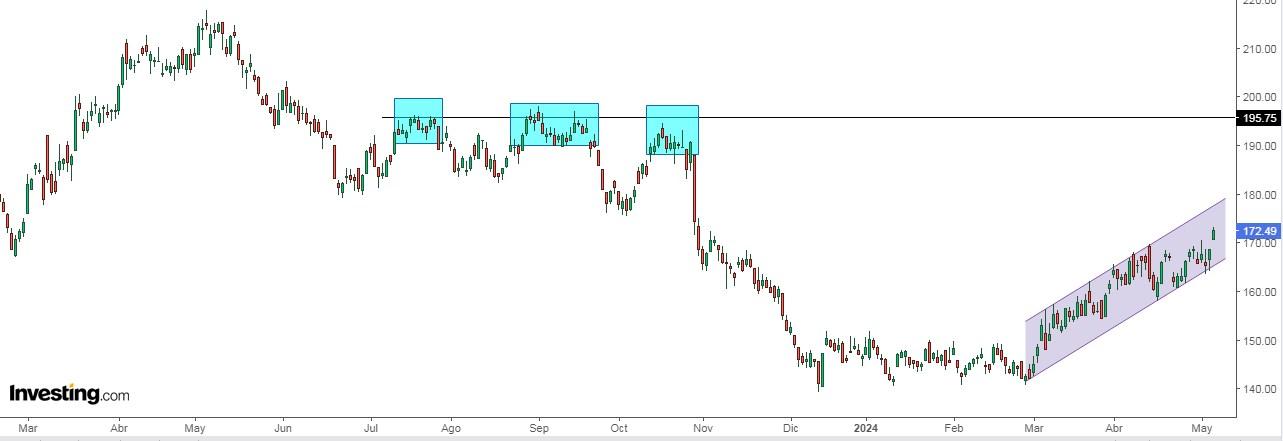
On August 7 it will present its results. Recorded a solid first quarter meeting production expectations and benefiting from high gold prices. EBITDA margin reached 84.2%, and its net profit margin was 56.9%.
It has no debt and has $2.3 billion in capital. The company is poised for further growth and expects a stronger second half as new mines come on stream and acquisitions continue.
The potential target could be $140.88.
4. Sandstorm Gold
Sandstorm Gold (NYSE:SAND) operates as a gold royalty company. It was formerly known as Sandstorm Resources and changed its name to Sandstorm Gold in February 2011.
It was incorporated in 2007 and is based in Vancouver, Canada. Its dividend yields 1.03%. Its EPS is expected to increase by 63.8% by 2024. The company expects to generate about $165 million in cash flow at current gold prices. 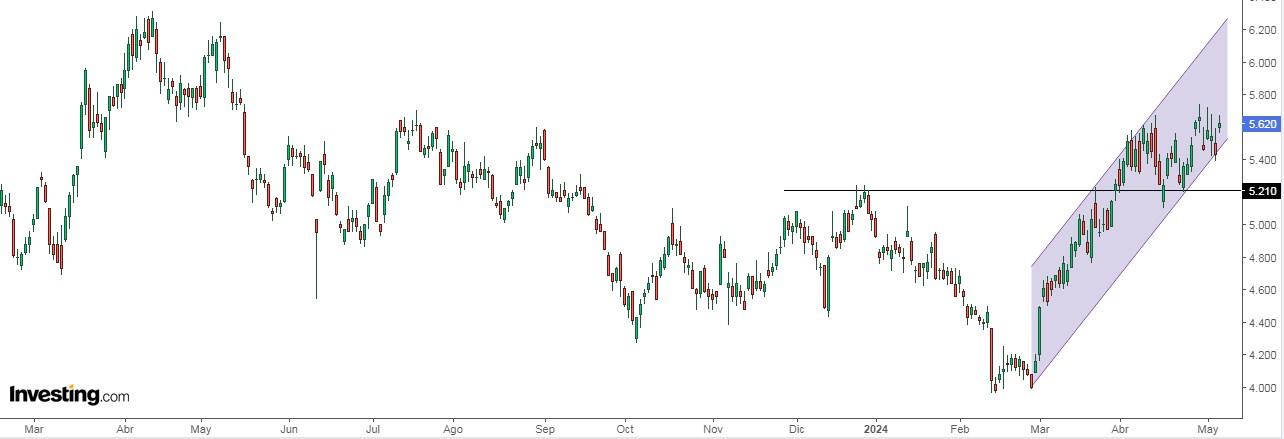
Its cash operating margins are up 8% and it expects its debt to soon be below $400 million after closing a deal to sell non-strategic assets.
It has also initiated share buybacks, as it believes its shares are undervalued. The potential target could be $7.75.
5. Wheaton Precious Metals
Wheaton Precious Metals (NYSE:WPM) was established in 2004 and is based in Canada, being a precious metals company engaged in the sale of gold and silver.
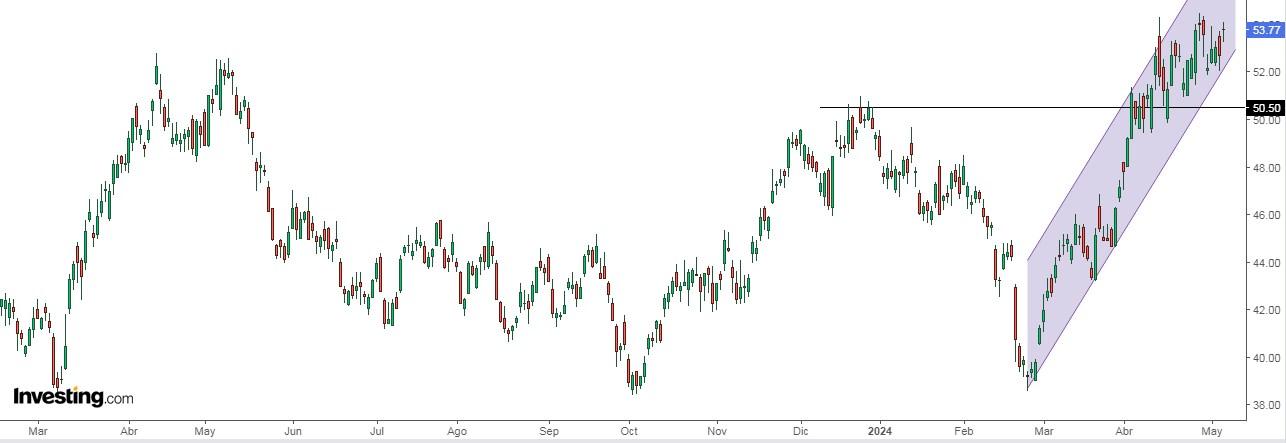
Its dividend yield is 1.15%. By 2024, EPS is expected to increase by 6.6% and revenue by 19.4%.
The company is focused on buying production from quality, low-cost, long-lived assets, such as Newmont's Peñasquito mine in Mexico. The deal protects Wheaton from inflation and rising production costs.
It has a gross profit margin of 77.54% and a net profit margin of 52%. The company's strong gross profit margin underscores its efficiency in generating profits from sales, which is a positive sign for investors.
In addition, the company's ability to maintain dividend payments for 14 consecutive years reinforces its attractiveness to those seeking steady income streams.
It has 17 ratings, of which 14 are buy, three are hold and none are sell.
The potential target could be $59.10.
***
How do you continue to take advantage of market opportunities? Take the opportunity HERE AND NOW to get InvestingPro's annual plan for less than €9 per month. Use the code INVESTINGPRO1 and get 40% off your 1-year subscription.
With it, you'll get:
- ProPicks: AI-managed portfolios of stocks with proven performance.
- ProTips: digestible information to simplify a lot of complex financial data into a few words.
- Advanced Stock Finder: Search for the best stocks based on your expectations, taking into account hundreds of financial metrics.
- Historical financial data for thousands of stocks: So that fundamental analysis professionals can delve into all the details themselves.
- And many other services, not to mention those we plan to add in the near future.
Act fast and join the investment revolution - get your OFFER HERE!
Disclaimer: This article is written for informational purposes only; it does not constitute a solicitation, offer, advice, or recommendation to invest as such it is not intended to incentivize the purchase of assets in any way. I would like to remind you that any type of asset, is evaluated from multiple points of view and is highly risky and therefore, any investment decision and the associated risk remains with the investor.

