InvestingPro’s Fair Value model captures 63% gain in Steelcase ahead of acquisition
- Don't fear the bubble talk: Data suggests the AI rally is different from the dot-com boom.
- Mega-cap tech leads the market, but history shows this doesn't signal a crash.
- While some worry about narrow leadership, the current market performance actually aligns with history.
- Unlock AI-powered Stock Picks for Under $7/Month: Summer Sale Starts Now!
Concerns about a market bubble often overshadow important data. Comparing Nvidia's (NASDAQ:NVDA) position with Cisco's (NASDAQ:CSCO) during the dotcom era provides clarity on why today’s tech valuations are not as alarming.
Cisco's peak forward P/E ratio soared to 131 in March 2000, while Nvidia's current forward P/E stands at a much lower 45. Although Nvidia isn't cheap, its valuation is far from the extreme levels Cisco reached in 2000, and it's also well below Microsoft's (NASDAQ:MSFT) P/E in 1999.
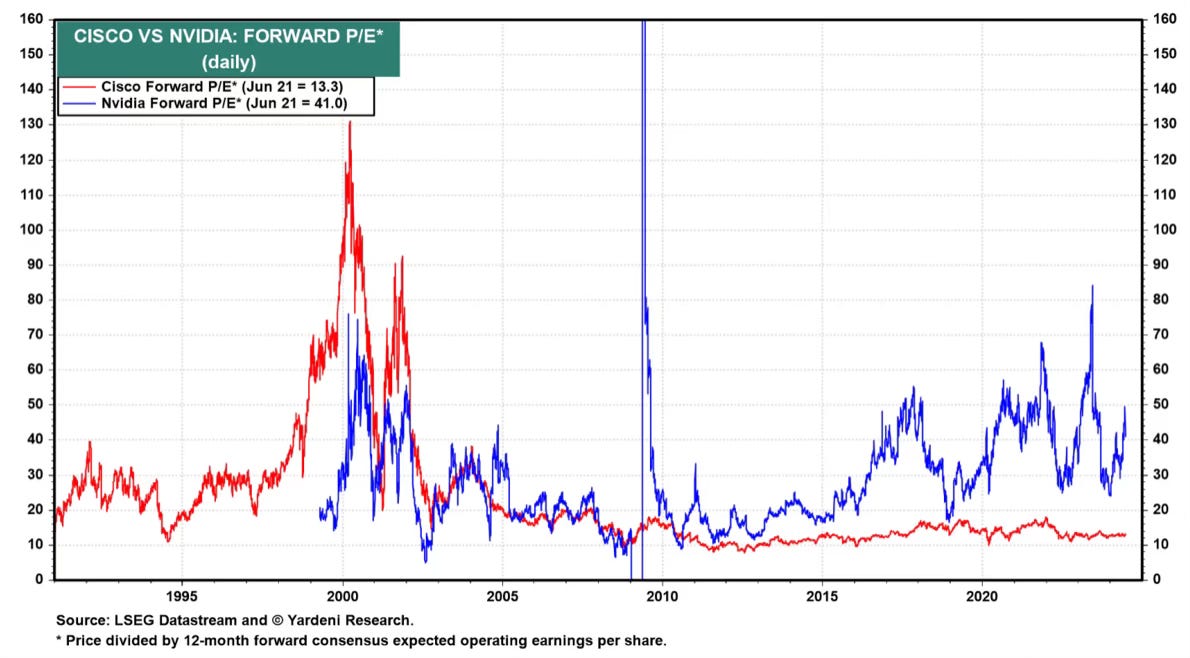
Nvidia's historical performance does not imply an inevitable collapse. It's crucial to understand that Nvidia does not have to follow the same trajectory as Cisco did over two decades ago.
The comparison of their P/E ratios highlights significant differences: Nvidia and Cisco are fundamentally different companies with distinct market contexts.

Mega-Cap Tech Leads, But History Suggests No Crash
The focus often falls on large-cap and mega-cap tech stocks driving the current bull market. This automatically puts them on the overvalued list, right? Not necessarily.
Historically, these giants have frequently led rallies, and it doesn't signal an inevitable crash.
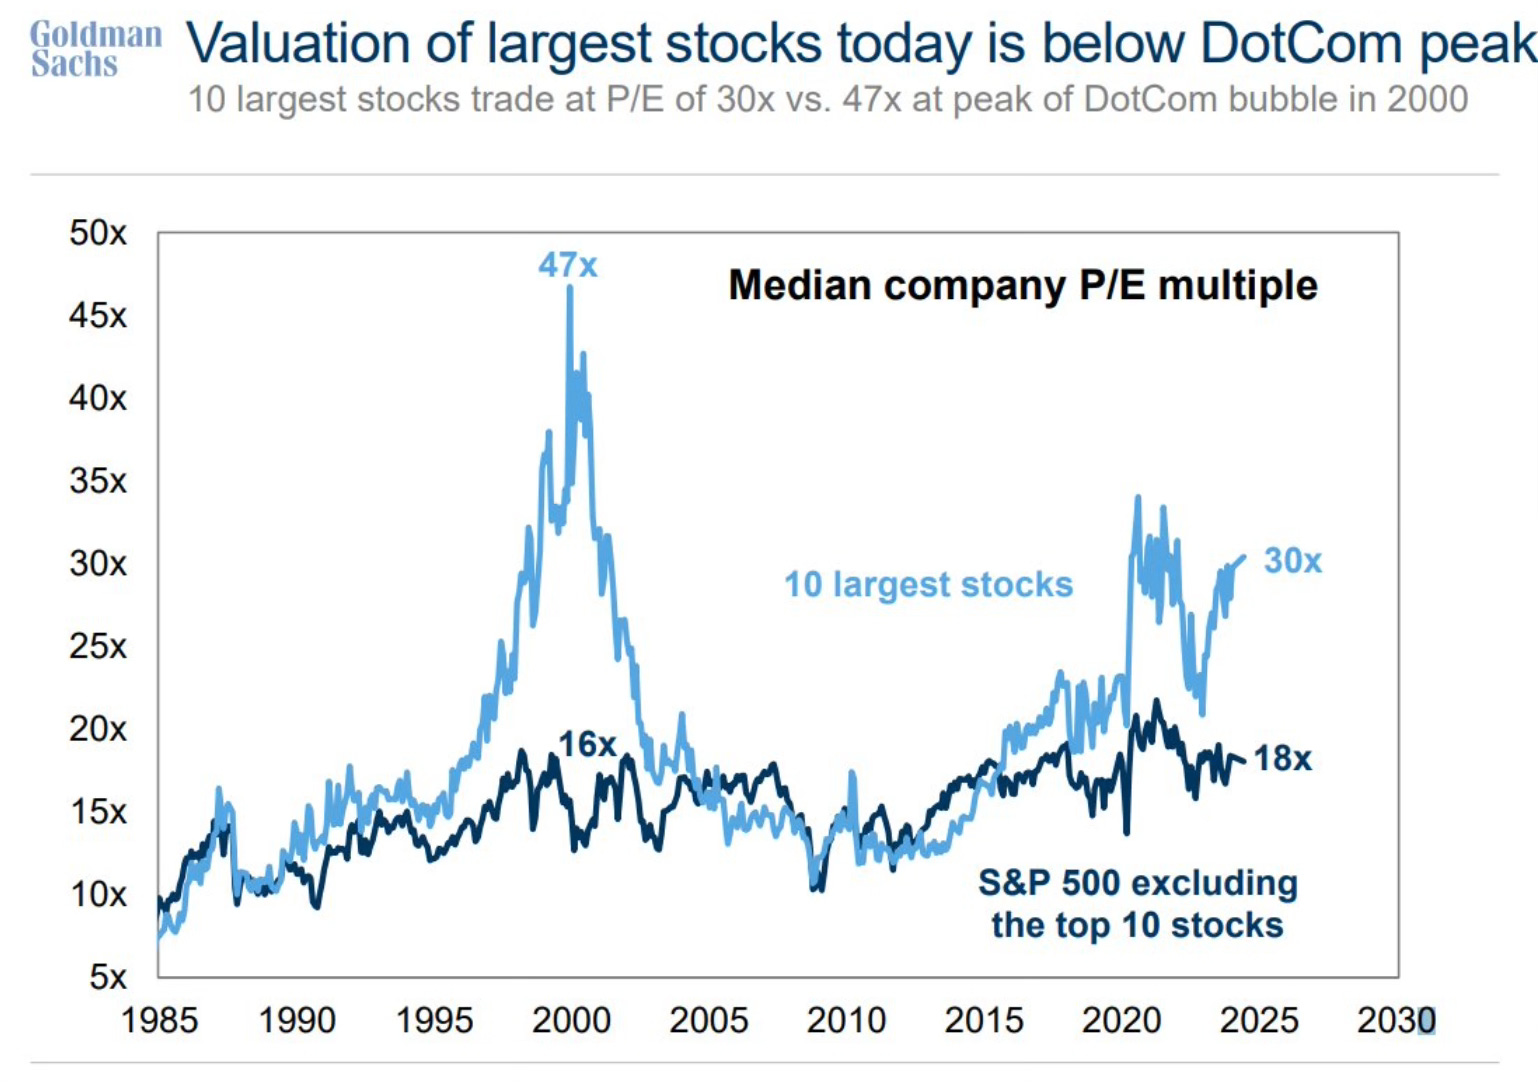
The data confirms this. The top 10 S&P 500 stocks currently trade at a P/E of 30x, compared to 47x for the top 10 in the 2000s. When you exclude the top 10, the remaining 490 stocks in the S&P 500 today trade at a P/E of 18x, versus 16x in 2000.
Few Stocks Posting the Bulk of Gains: Is That Really a Concern?
There's also chatter about narrow leadership in the market. Let's delve deeper. While 8% of the S&P 500 have returned over 30% year-to-date (YTD), it's not just the usual suspects.
This impressive performance comes from a broader group of 40 stocks, not just the frequently mentioned 7.
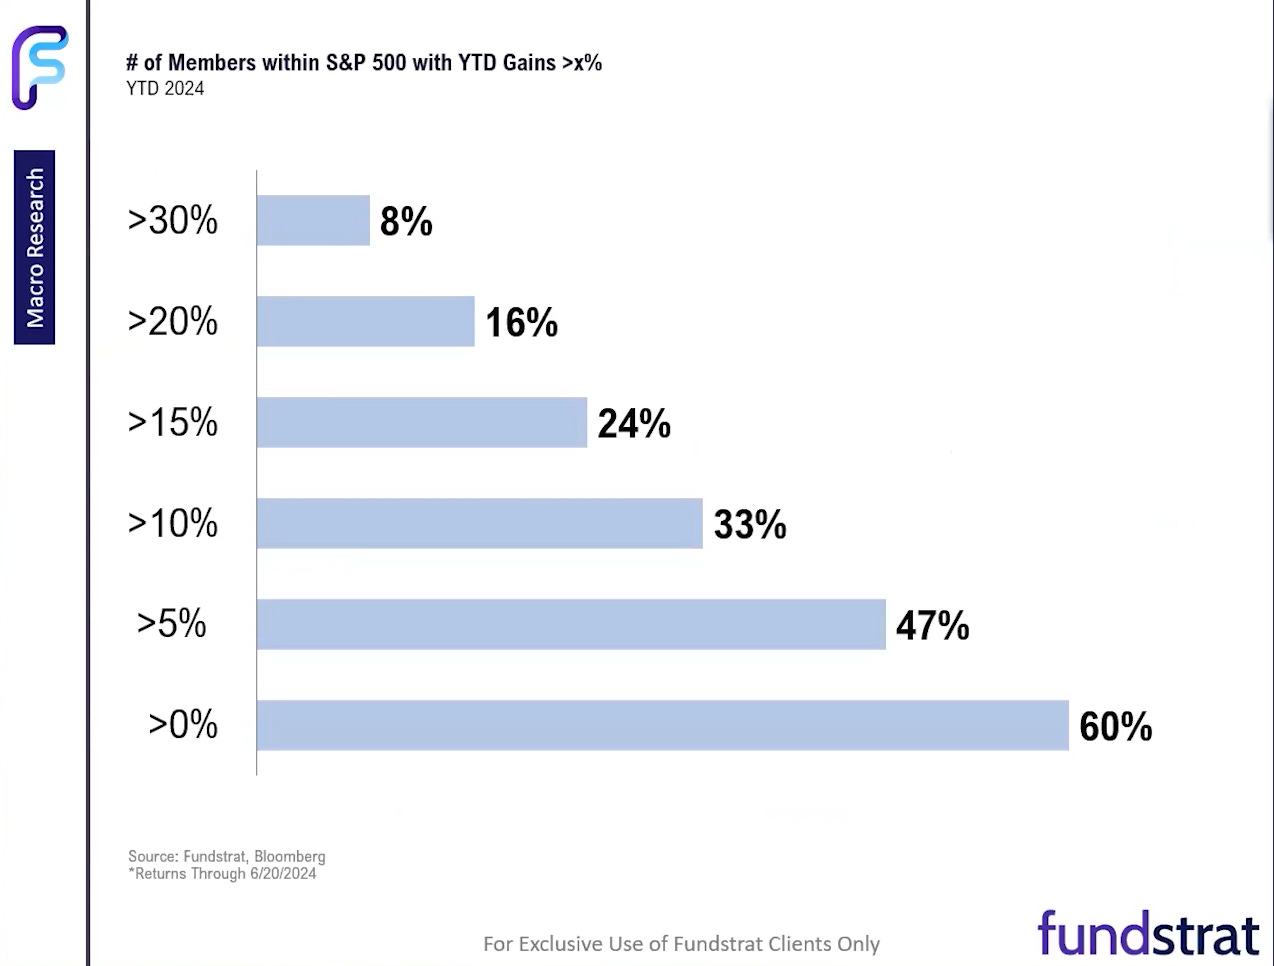
The current 8% of S&P 500 stocks performing above 30% is actually in line with historical averages – slightly lower than the 10% average since 1990. This suggests that 2024 might be a typical year historically, and not an outlier.
A Very Strong H2 2024 Lies Ahead for Stocks
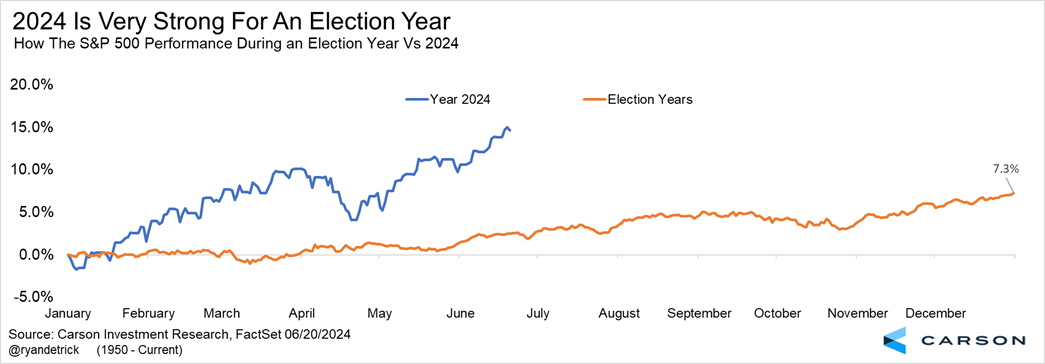
Last year, the S&P 500 returned almost 25%, and this year it's around +15% so far, which is notable given that election years typically see stronger performance later in the year.
The chart below shows the current trend remains above average, but it's important to consider that election years tend to be positive, with the stock market performing well from mid-May to September. Could this be a hint of a summer rally?
June might be ending with the S&P 500 close to a 4% gain. Notably, the worst day this month saw a mere 0.31% drop early in the week. Additionally, there haven't been any daily declines of 2% in quite some time.
The last time the market saw a daily drop exceeding 2% was February 2023. This translates to 338 consecutive trading days without such a decline, significantly higher than the typical 29 days.

While this might suggest some expected volatility, it's important to keep things in perspective – the current streak is only a third of the longest ever recorded (949 days).
Looking ahead, July has historically been a strong month for the S&P 500, with gains in 9 consecutive years and 11 of the last 12.
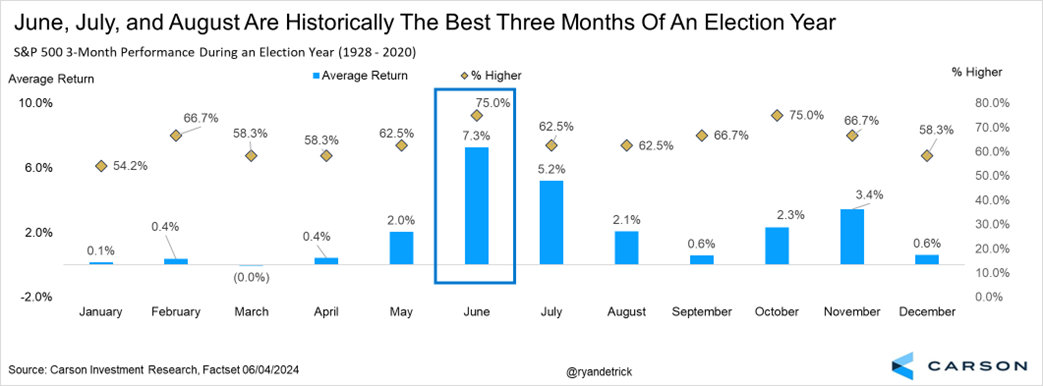
Over the past 20 years, July’s average return exceeds 2.5%. Given the positive trend during election years, the market could continue its uptrend through the summer months.
***
This summer, get exclusive discounts on our subscriptions, including annual plans for less than $7 a month!
Tired of watching the big players rake in profits while you're left on the sidelines?
InvestingPro's revolutionary AI tool, ProPicks, puts the power of Wall Street's secret weapon - AI-powered stock selection - at YOUR fingertips!
Don't miss this limited-time offer.
Subscribe to InvestingPro today and take your investing game to the next level!
Disclaimer: This article is written for informational purposes only; it does not constitute a solicitation, offer, advice, counsel or recommendation to invest as such it is not intended to incentivize the purchase of assets in any way. I would like to remind you that any type of asset, is evaluated from multiple perspectives and is highly risky and therefore, any investment decision and the associated risk remains with the investor.

