European stocks steady ahead of Nvidia’s results; U.K. CPI falls
- Bitcoin recently faced significant resistance after the Federal Reserve's interest rate decision but saw short-term gains due to increased risk appetite.
- The cryptocurrency is currently within a horizontal trading range, with key support levels at $34,000 to $34,300.
- A possible pullback scenario could be triggered by higher-than-expected employment data, potentially leading to a correction in Bitcoin.
Bitcoin recently tested a significant resistance level in its long-term outlook, spurred by this week's ascent following the Federal Reserve's decision to once again keep interest rates unchanged and deliver a reassuring message about its monetary policy.
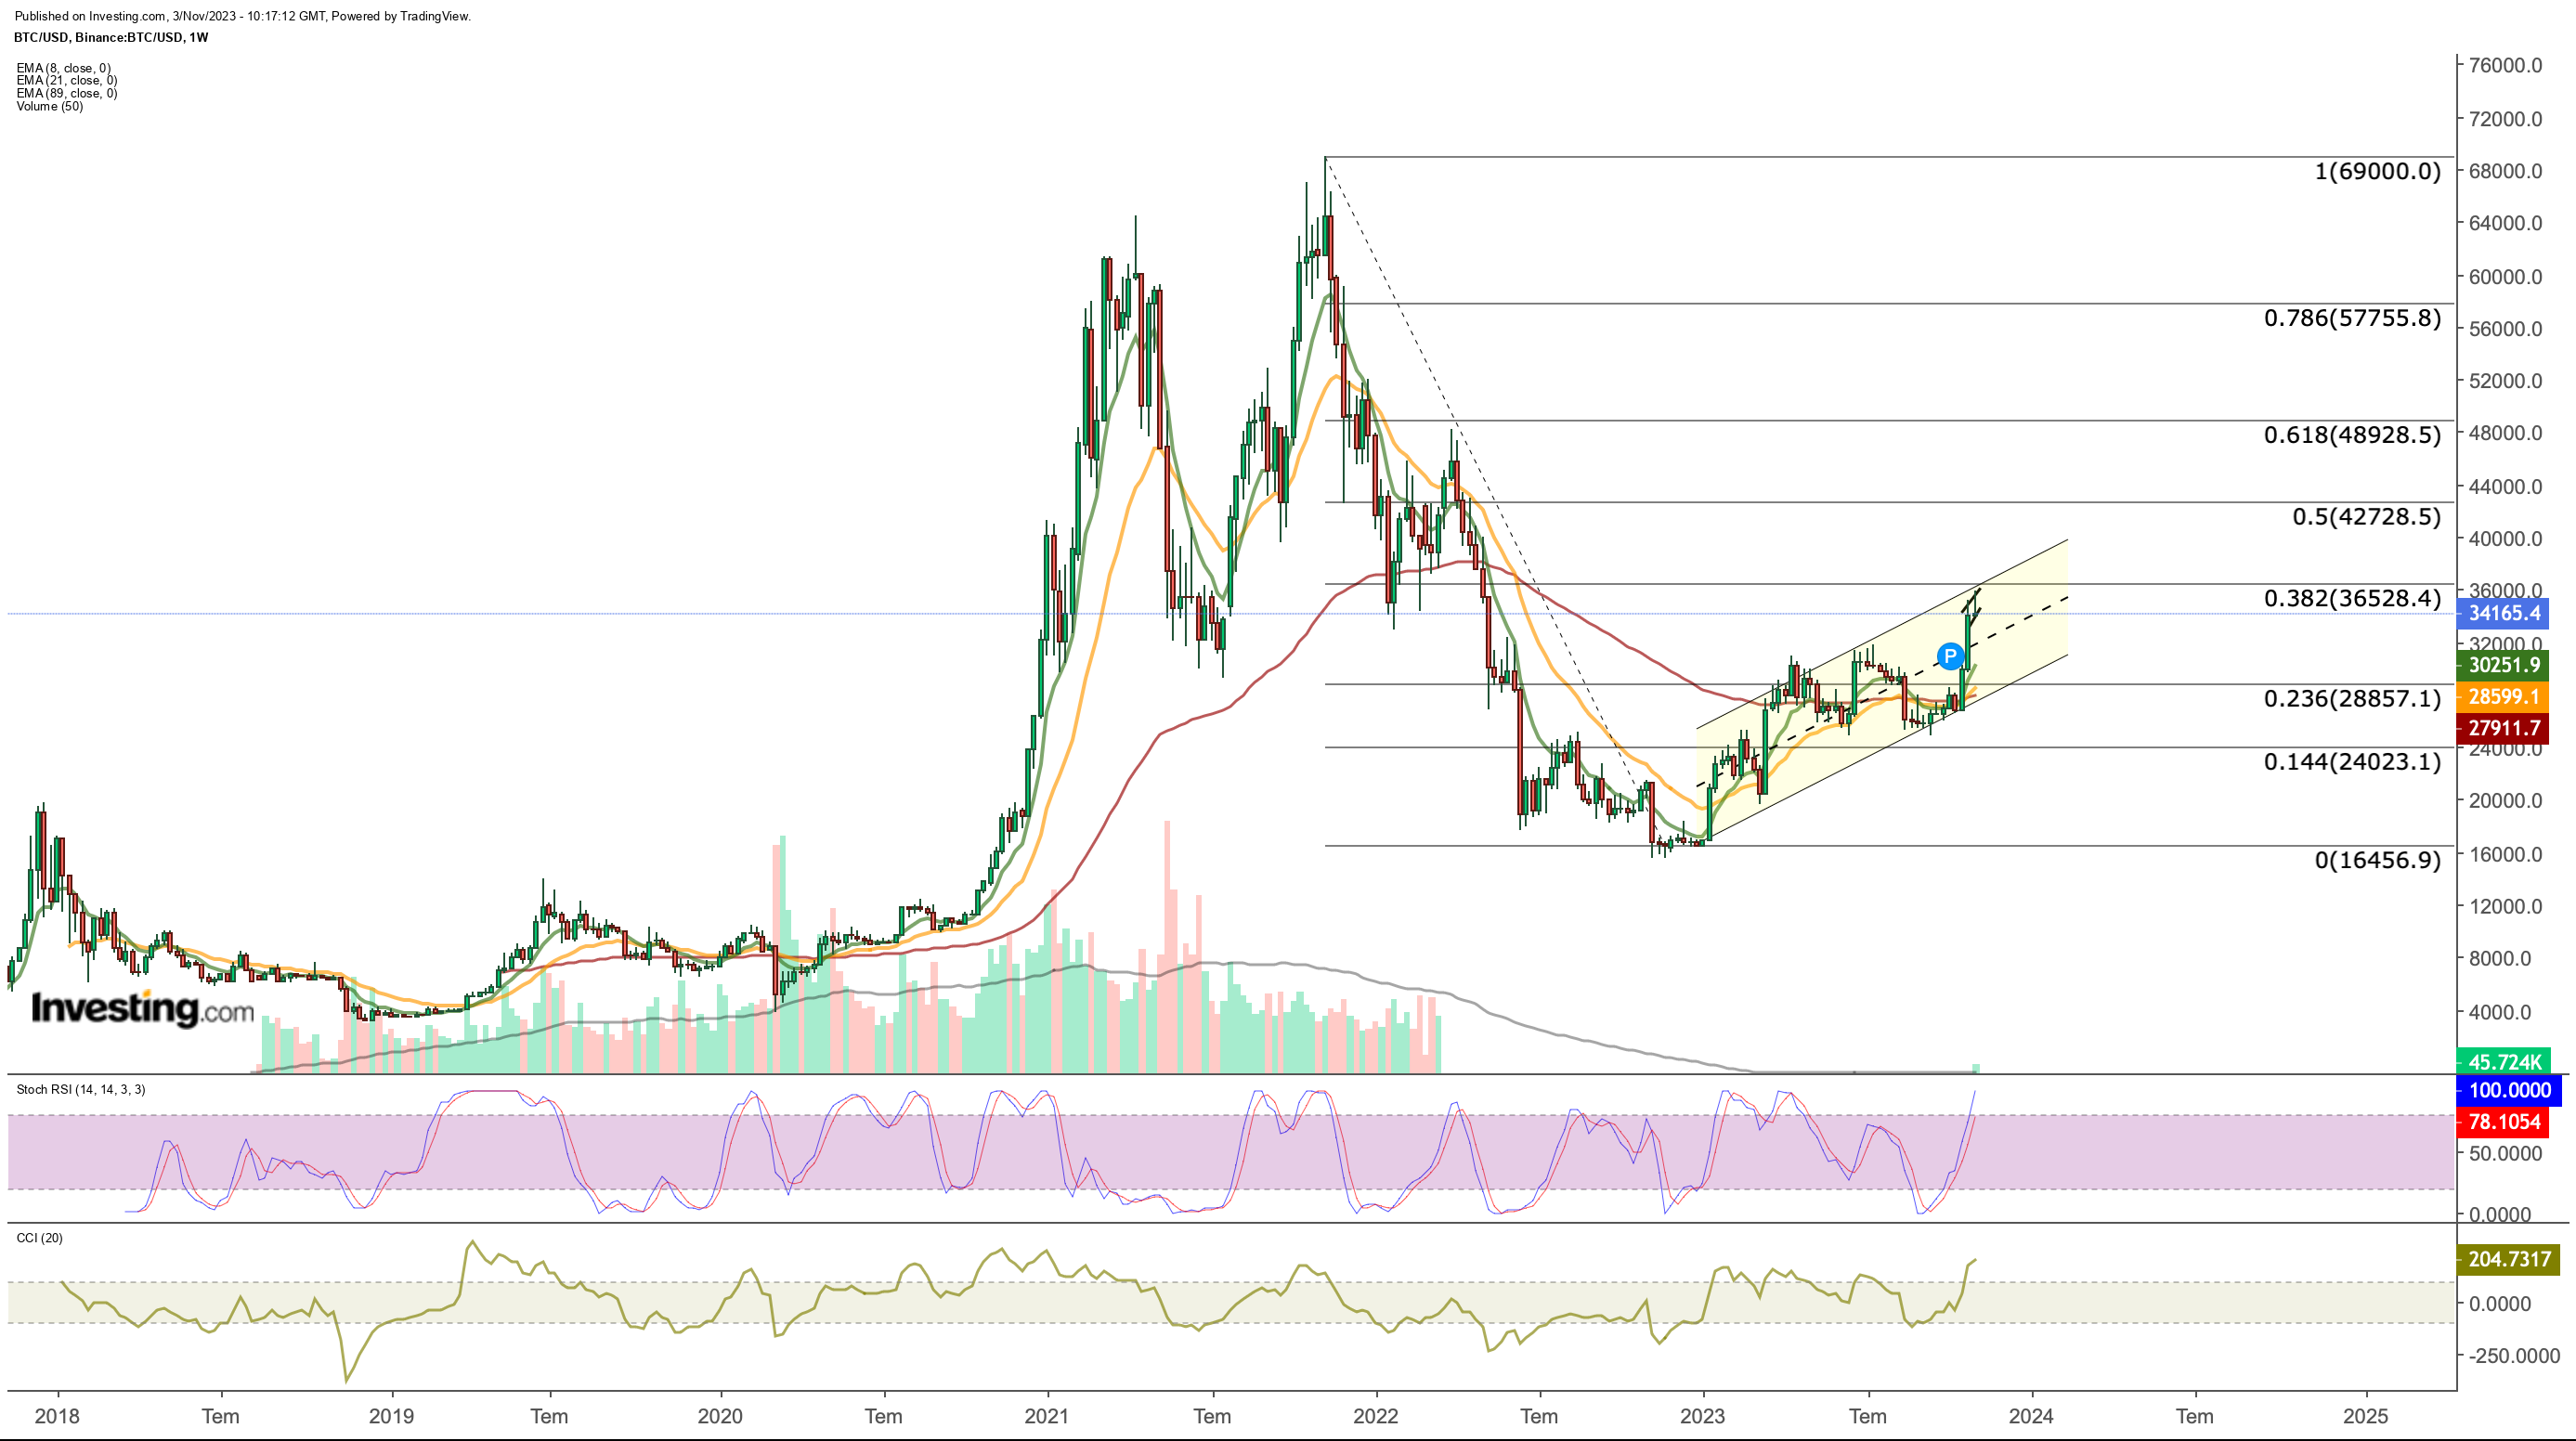
With increased risk appetite following the Fed's decision, Bitcoin experienced a surge during Asia trading hours, briefly reaching $35,900. On the weekly chart, this price aligns with the 0.382 Fibonacci level calculated from the peak and bottom, representing a crucial hurdle to clear for a sustained uptrend. However, Bitcoin retraced its gains from the Fed-related rally and dipped from $35,900.
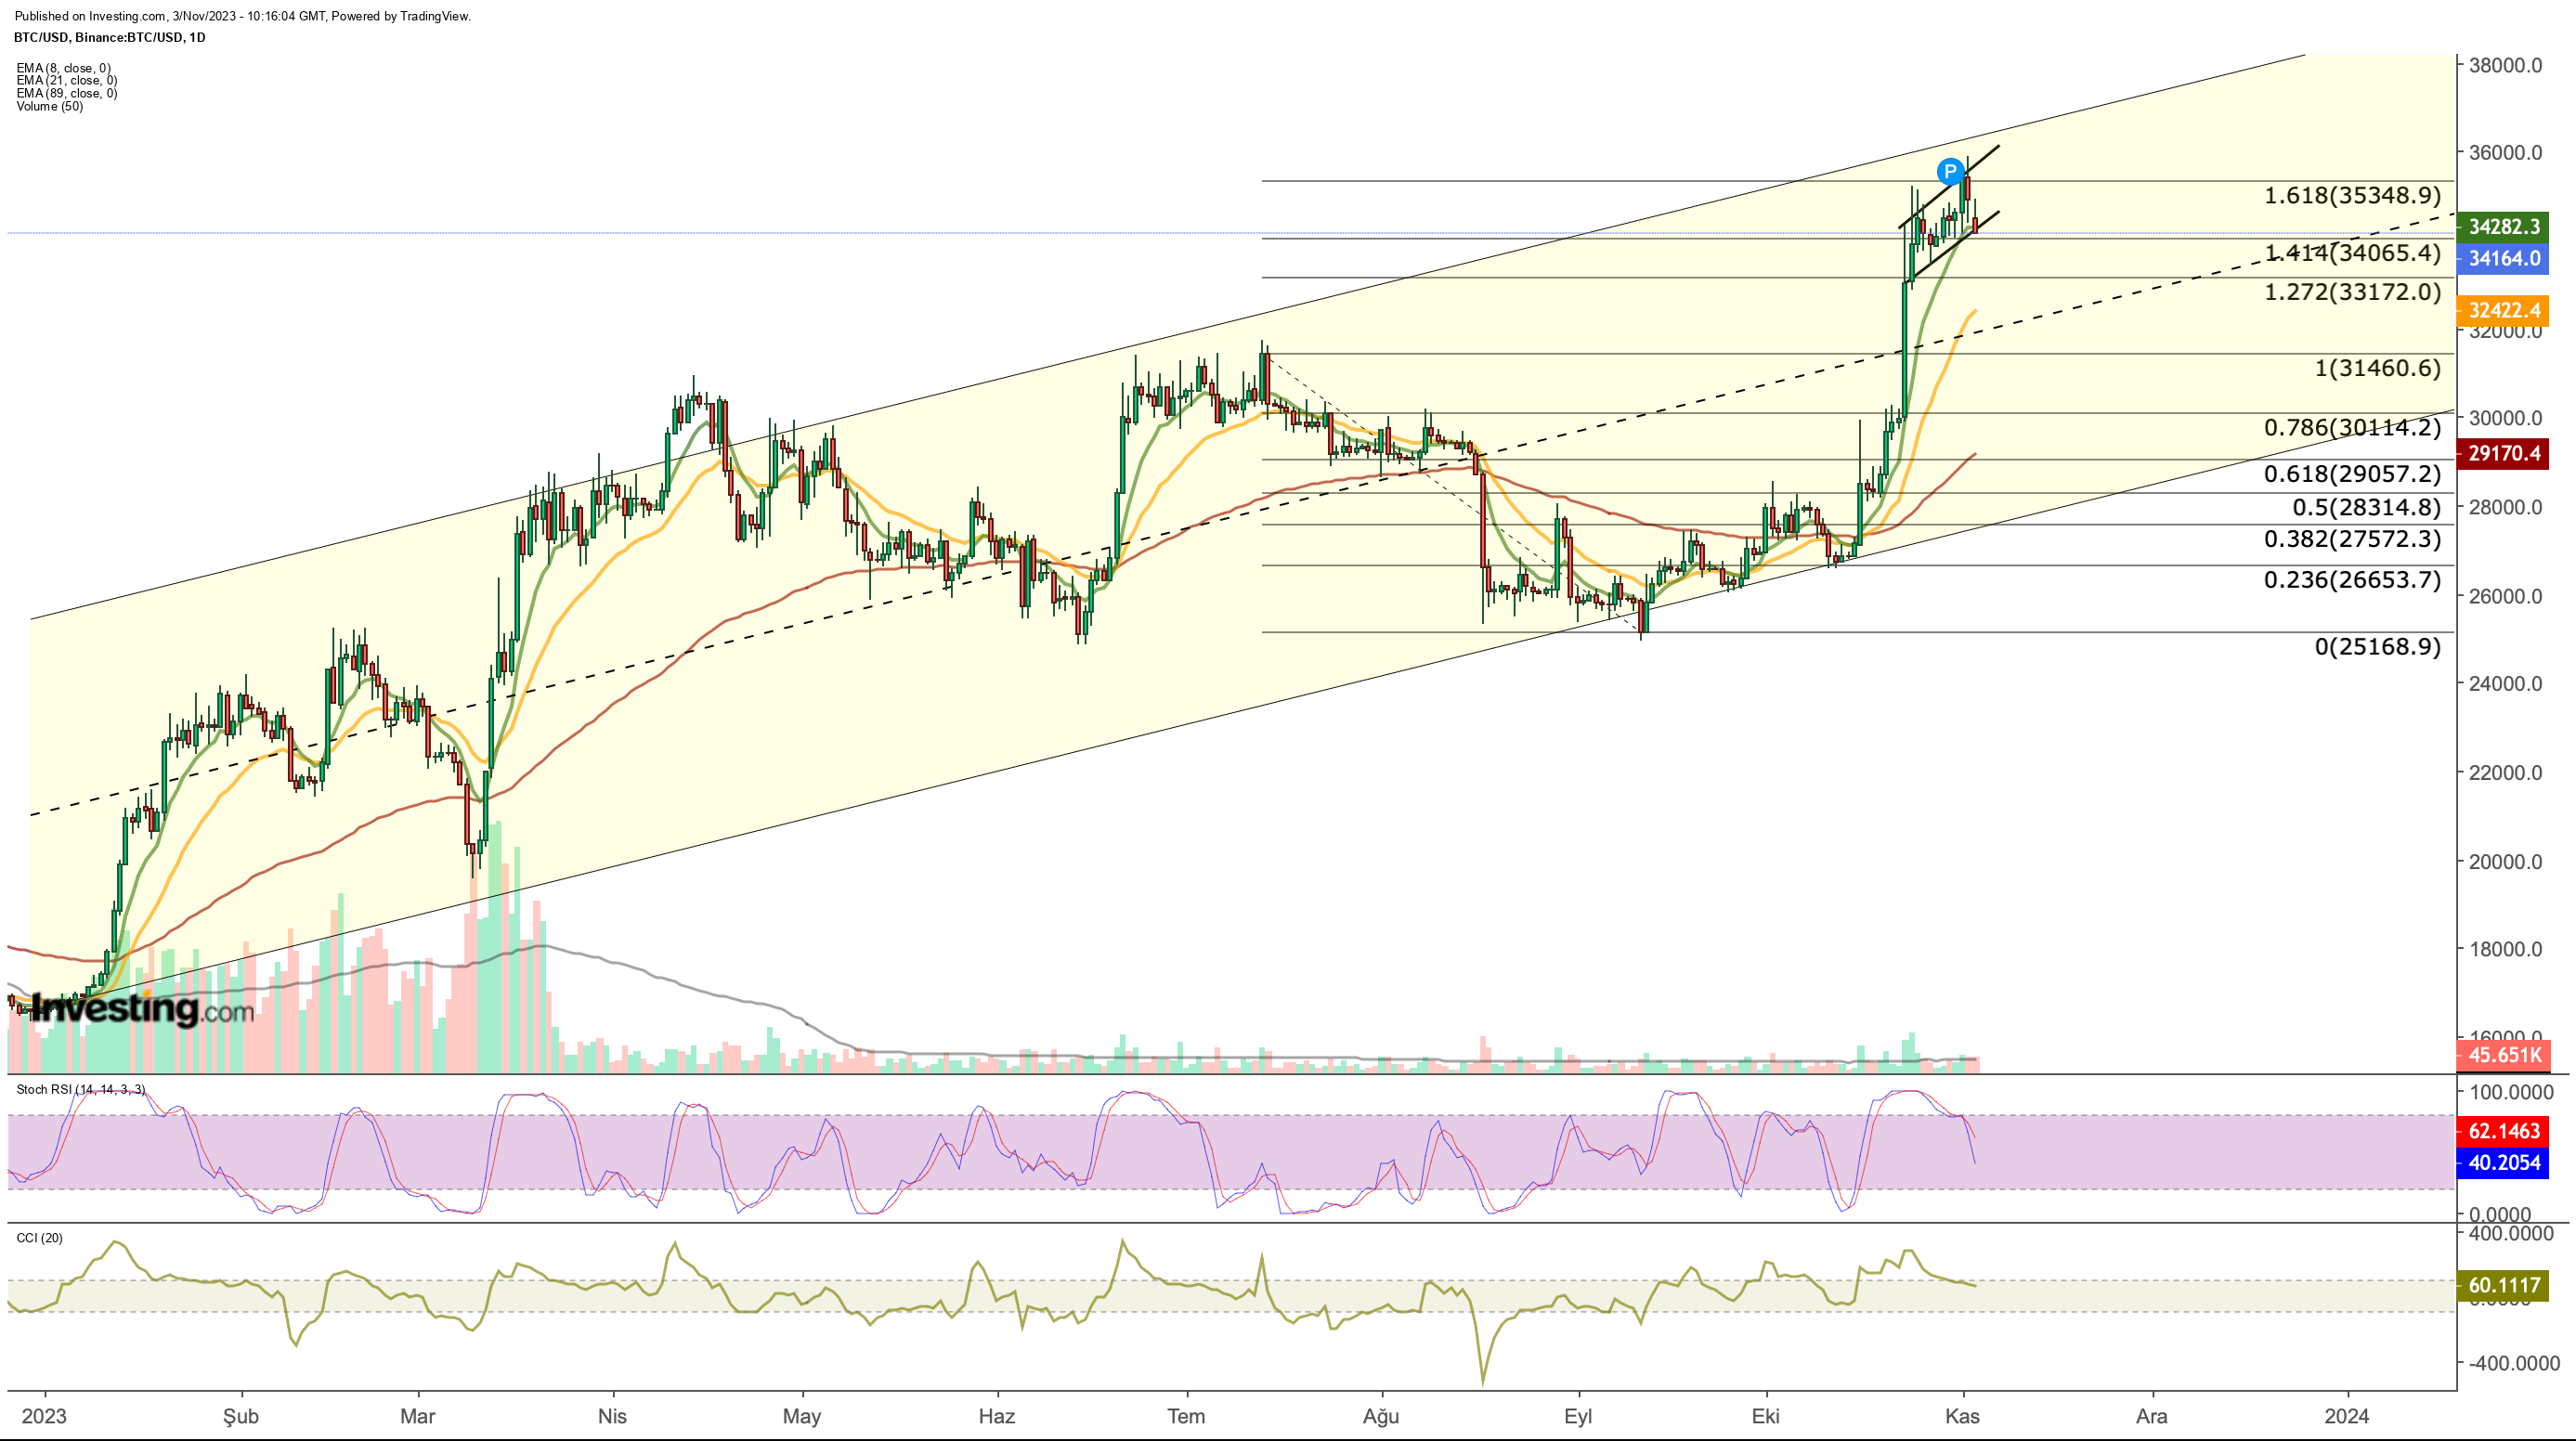
As the week neared its end and attention shifted to the nonfarm payrolls data, Bitcoin relinquished some of its short-term gains and appeared to be approaching the lower boundary of the horizontal trading range that it has maintained since the last week of October.
Bitcoin Tests Key Levels Ahead of Jobs Data
This horizontal range's boundaries also align with Fibonacci expansion levels corresponding to the retracement from July to September, as evident in the daily chart. The cryptocurrency remains within this zone, oscillating between Fib 1.414 and Fib 1.618, with the $34,000 to $34,300 range acting as a pivotal support level.
Should daily closes fall below $34,000, it could intensify selling pressure and potentially lead Bitcoin to retreat to the midline of the 2023 rising channel, with an interim support of around $33,100. In such a scenario, the cryptocurrency could test the $32,000 level.

The trigger for a possible pullback could be higher-than-expected employment data. In this case, it would accelerate speculation that the Fed may decide to raise interest rates in December to increase the cost of financing, depending on the economic strength. This could accelerate investors' flight from risky assets to low-risk assets such as bonds and trigger a correction in Bitcoin.
While markets shifted their focus from geopolitical risk to economic data this week, other important data released in the US included ADP Nonfarm Employment Change, a leading indicator for Non-Farm Payrolls. The fact that this data was below expectations along with PMI data also supported positive pricing in risky assets.
Potential Scenarios Post Key Data
In the current market conditions, Bitcoin (BTC) appears to be witnessing a predominance of seller-weighted transactions as it retraced before the release of employment data. If the employment data aligns with the ADP Nonfarm Employment Change, it could potentially catalyze a rapid rebound in the Bitcoin price, which is currently testing a crucial support zone. 
In such a scenario, a surge towards $35,300 could be anticipated. Breaking through the $35,000 mark, a significant short-term resistance, would bring the long-term resistance at $36,500 into focus. A weekly close above this level might pave the way for Bitcoin to explore the price range between $42,000 and $48,000.
Analyzing historical data, it's evident that during the protracted decline in the past, a noteworthy reaction occurred within the range of $36,500 to $48,000 in 2022. Depending on short-term resistance levels, we could anticipate price fluctuations within this range over the next three months.
In summary, Bitcoin may undergo a correction toward the midsection of the rising channel, falling between $32,500 and $33,000 in the near future, due to the deceleration in its upward trajectory. Should the bulls manage to push the price higher within this range, the trend may continue to strengthen, potentially leading to a new annual peak at $36,500.
Nevertheless, if the week concludes above the short-term resistance level of $35,300, it increases the likelihood of Bitcoin continuing its upward journey without a significant correction.
***
Disclaimer: This article is written for informational purposes only; it does not constitute a solicitation, offer, advice, or recommendation to invest as such it is not intended to incentivize the purchase of assets in any way. I would like to remind you that any type of asset, is evaluated from multiple points of view and is highly risky and therefore, any investment decision and the associated risk remains with the investor.

