FTSE 100 today: Index up, pound slips; Mitchells & Butlers jumps, Whitbread falls
- Traders await potential interest rate signals from Powell’s Jackson Hole speech.
- ETF demand, futures activity, and investor sentiment are impacting Bitcoin’s price movements.
- Key technical levels: Bitcoin’s support at $111,500 and resistance approaching $125,000.
- Looking for actionable trade ideas? Subscribe now to unlock access to InvestingPro’s AI-selected stock winners for up 50% off amid the summer sale!
Everyone today, including crypto market traders, is focused on the US Federal Reserve Chairman’s speech in Jackson Hole.
Last week, the price of Bitcoin dropped by about 10% to $112,000. This quick decline happened because of weak economic data and reduced chances of an interest rate cut due to rising inflation. Currently, people think there is a 75% chance of a rate cut in September, but there’s still a lot of uncertainty.
The Federal Reserve Chairman, Powell, is expected to keep a neutral and data-driven approach in his speech. However, if he doesn’t hint at an interest rate cut, risky assets like Bitcoin and Ethereum might experience a significant sell-off.
Overview of the Recent Market Correction
Bitcoin experienced significant selling pressure due to profit-taking at around $124,000 and over $1 billion in leveraged positions being liquidated. Additionally, a slowdown in demand for spot ETFs and uncertainties from the Federal Reserve’s July meeting minutes added to this pressure. Recently, ETF outflows reached $1.17 billion over five trading days, the longest period of declines since April.
Despite this, there are signs that the decline might be limited. The number of open positions in crypto futures markets is still increasing, indicating that investors are holding onto their positions. Moreover, while individual investors have been selling, large investors have been buying Bitcoin over the past week, which is a positive sign similar to past recoveries.
The cryptocurrency fear and risk appetite index remains neutral, suggesting a balanced market sentiment. Furthermore, the continued preference for call options in the options market indicates that investors still have long-term positive expectations.
Considering these positive and negative expectations, the key factor that could cause Bitcoin’s price to fluctuate will be developments impacting the interest rate decision on September 17. The first major event is the Jackson Hole statements, which everyone in the market is watching closely.
It’s likely that Chairman Powell won’t make any surprises at this meeting and will maintain a neutral stance on the interest rate decision. Therefore, the macroeconomic data released leading up to the September decision will continue to influence market pricing.
In this situation, identifying short-term technical support and resistance levels on the Bitcoin chart has become crucial.
Technical Outlook for Bitcoin

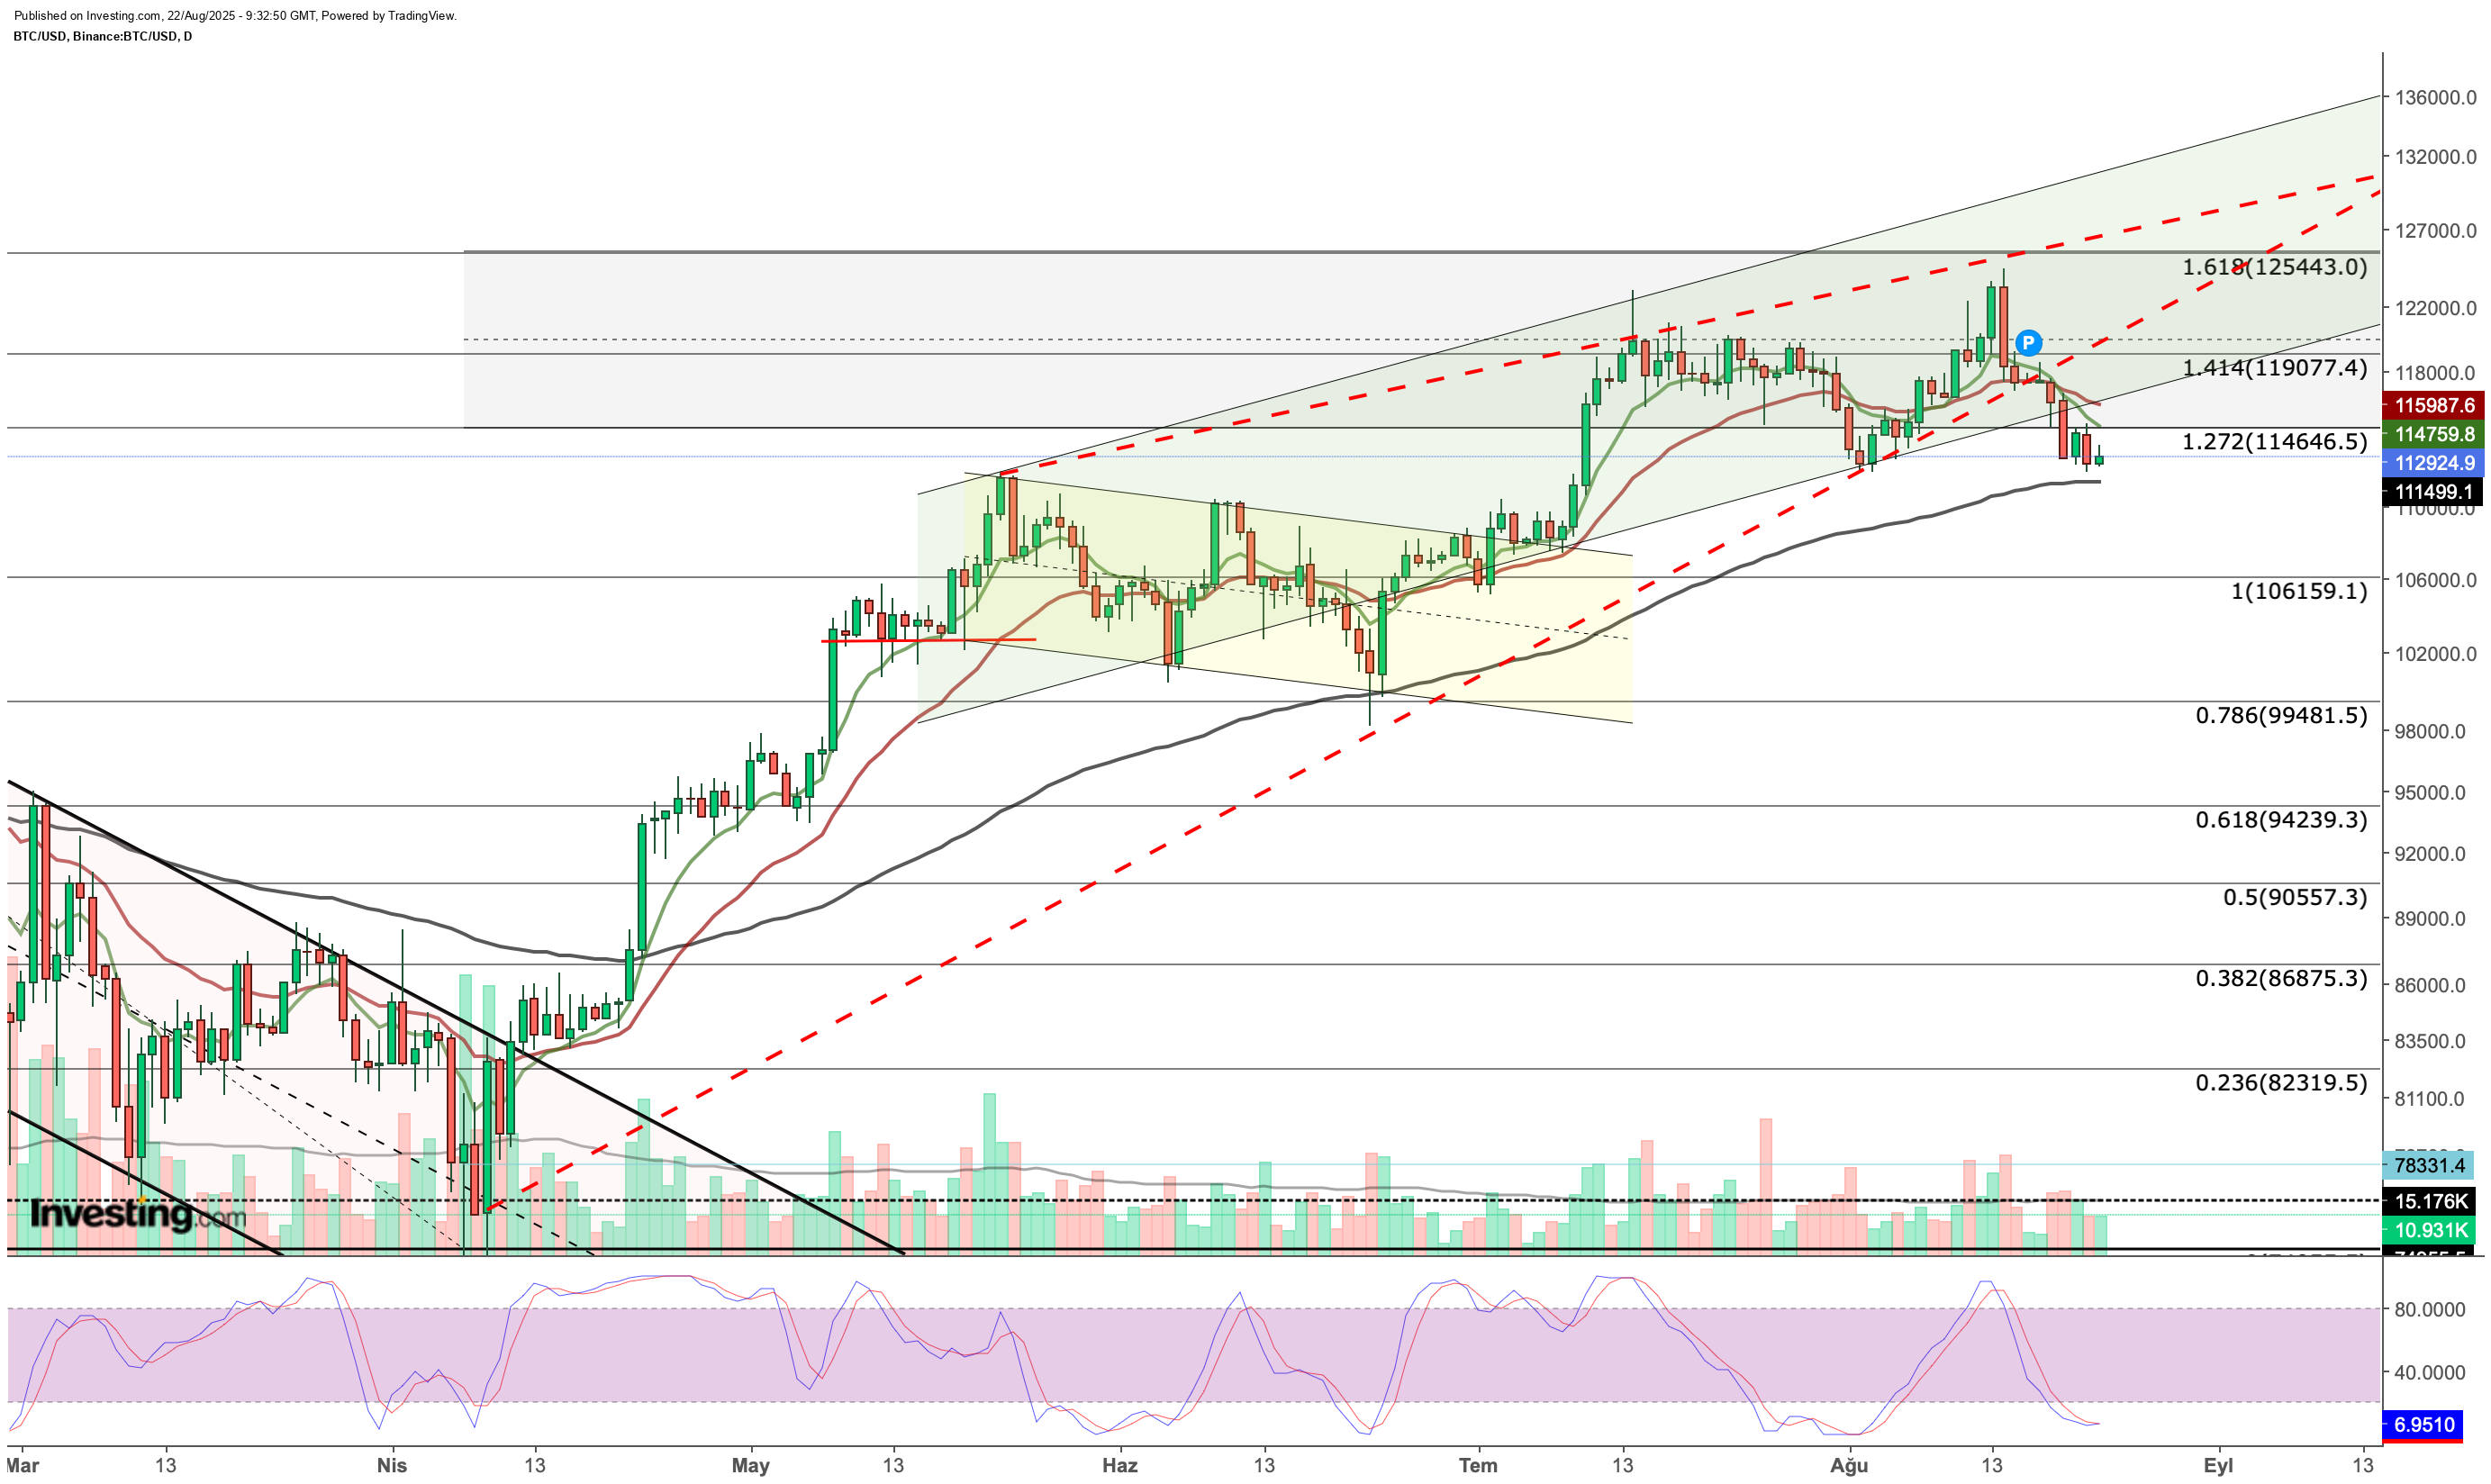
At the start of the week, Bitcoin experienced heavy selling, dropping below $117,300, which we considered intermediate support, and this intensified its downward trend. After breaking this support level, the lower boundary of the ascending channel became critical, and Bitcoin’s price fell beneath this support around $115,600.
Reviewing the downward trend over the past week, we see that around mid-week, the price stabilized around $112,500. Technical indicators suggested that Bitcoin entered the oversold zone in the short term. This slowdown indicates that the market is in a holding pattern ahead of Powell’s announcement.
Currently, the price is near the 3-month Exponential Moving Average (EMA), acting as significant dynamic support. In June, a similar pattern was seen when Bitcoin rebounded from this 3-month EMA and returned to its upward channel.
If Powell provides signals that encourage risk-taking or even maintains a neutral tone instead of a more aggressive one, it might trigger buying activity. This could enable Bitcoin to initially return to the $114,600 region and then possibly move towards the $120,000-$125,000 range, supporting an upward trend.
On the other hand, if the market experiences significant selling pressure and the price falls below today’s EMA at $111,500, we might see Bitcoin pull back towards the $106,000 level.
Based on the daily Bitcoin chart, here are the current support and resistance levels:
-
Support levels: 112.500 - 111.500 - 106.000
- Resistance levels: 114.650 - 117.300 - 119.000 - 125.000
****
InvestingPro provides a comprehensive suite of tools designed to help investors make informed decisions in any market environment. These include:
- AI-managed stock market strategies re-evaluated monthly
- 10 years of historical financial data for thousands of global stocks
- A database of investor, billionaire, and hedge fund positions
- And many other tools that help tens of thousands of investors outperform the market every day!
Disclaimer: This article is written for informational purposes only. It is not intended to encourage the purchase of assets in any way, nor does it constitute a solicitation, offer, recommendation or suggestion to invest. I would like to remind you that all assets are evaluated from multiple perspectives and are highly risky, so any investment decision and the associated risk belongs to the investor. We also do not provide any investment advisory services.

