S&P 500 selloff continues on fresh economic jitters, ongoing government shutdown
- Stocks have made a comeback, but Bitcoin has failed to follow suit.
- Could it be just a matter of time before it catches up to stocks?
- We'll take a look at the fundamental and technical factors to try and assess that.
- For less than $8 a month, InvestingPro's Fair Value tool helps you find which stocks to hold and which to dump at the click of a button.
Bitcoin has been consolidating lately, even as stocks make a strong comeback and erase their previous losses. Although the cryptocurrency has lagged behind the broader market, several factors now seem to be aligning, signaling that Bitcoin might be ready to catch up.
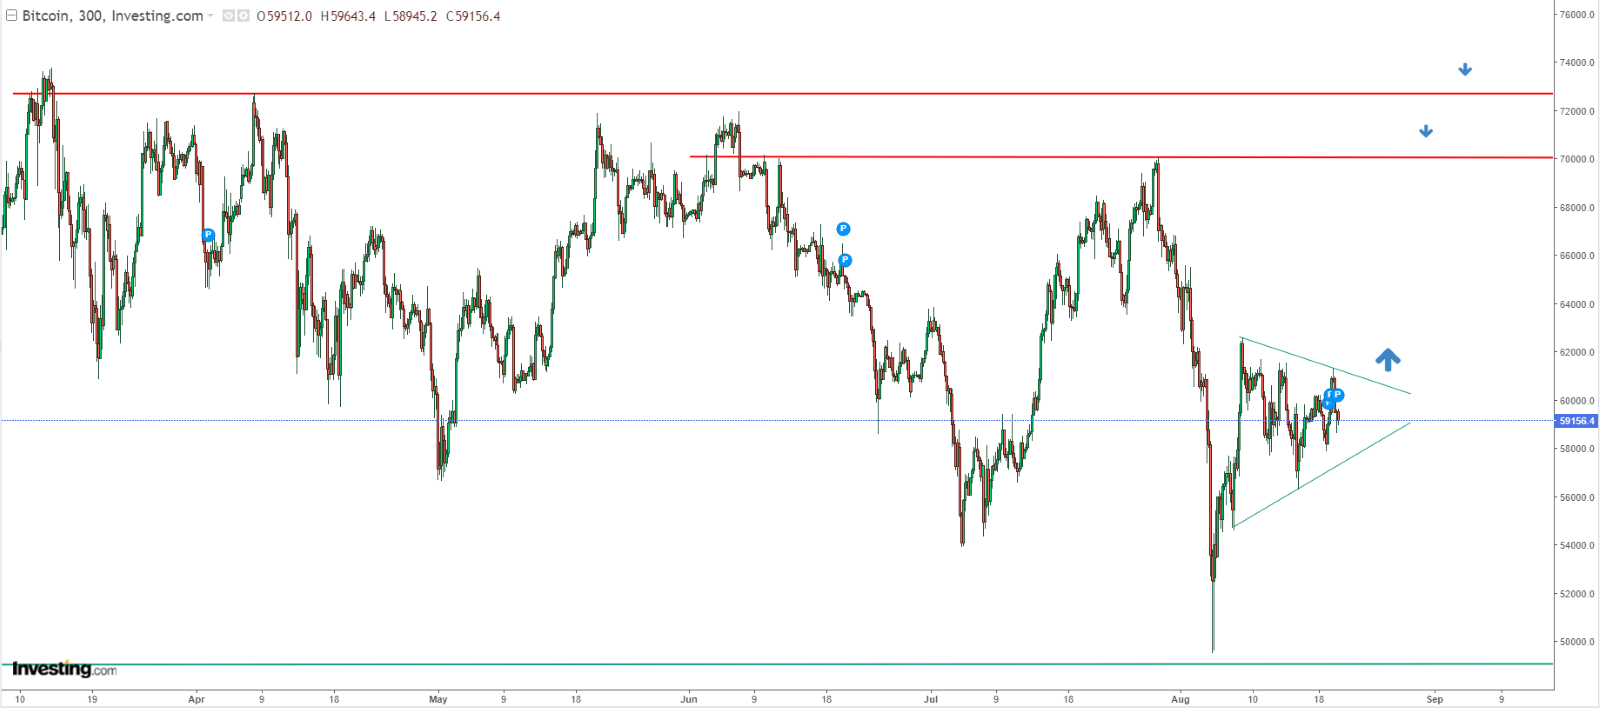
Technically, the cryptocurrency is forming a bullish triangle pattern, indicating potential bullish momentum. Furthermore, the market is increasingly optimistic about the rate cuts in September, which could provide a tailwind for risk assets like Bitcoin.
While a high percentage of market participants are still holding bullish positions, concerns about potential profit-taking persist. Nevertheless, the overall sentiment remains positive, suggesting that investors are optimistic about a return to the bull market.
The coming weeks will be crucial for Bitcoin's price trajectory, as a breakout from the triangle pattern could signal a resumption of the uptrend.
When Will We Finally See the Halving's Effects on Price?
One of the biggest events in Bitcoin this year, besides the launch of spot ETFs, was the halving in April. Despite expectations of a rapid rise towards $100,000, Bitcoin has remained in a broad consolidation with a downward trend.
However, analyst Rekt Capital highlights a pattern from previous cycles: significant price increases typically gain momentum around 160 days after halving. If this pattern holds, we might see a stronger upward movement in September or October.
Additionally, miners are playing a role in the bullish narrative. According to CryptoQuants data, miners have recently achieved new peaks in the Hash Ribbons indicator, which tracks computing power through the Hash Rate.
This suggests that miners likely won’t need to sell their Bitcoin holdings to sustain mining operations and maintain computing power.
Is Bitcoin’s Triangle Breakout a Good Time for a Long Entry?
Bitcoin’s current consolidation has formed a triangle pattern, which typically suggests a bullish outlook. A breakout above the upper boundary of this triangle could signal an upward move, aligning with the long-term upward trend.

When considering potential targets, focus on the psychological level around $70,000 per coin. A breakout above this level could pave the way for Bitcoin to challenge and possibly surpass its historical peak of $74,000.
Meanwhile, What's Next for Ethereum?
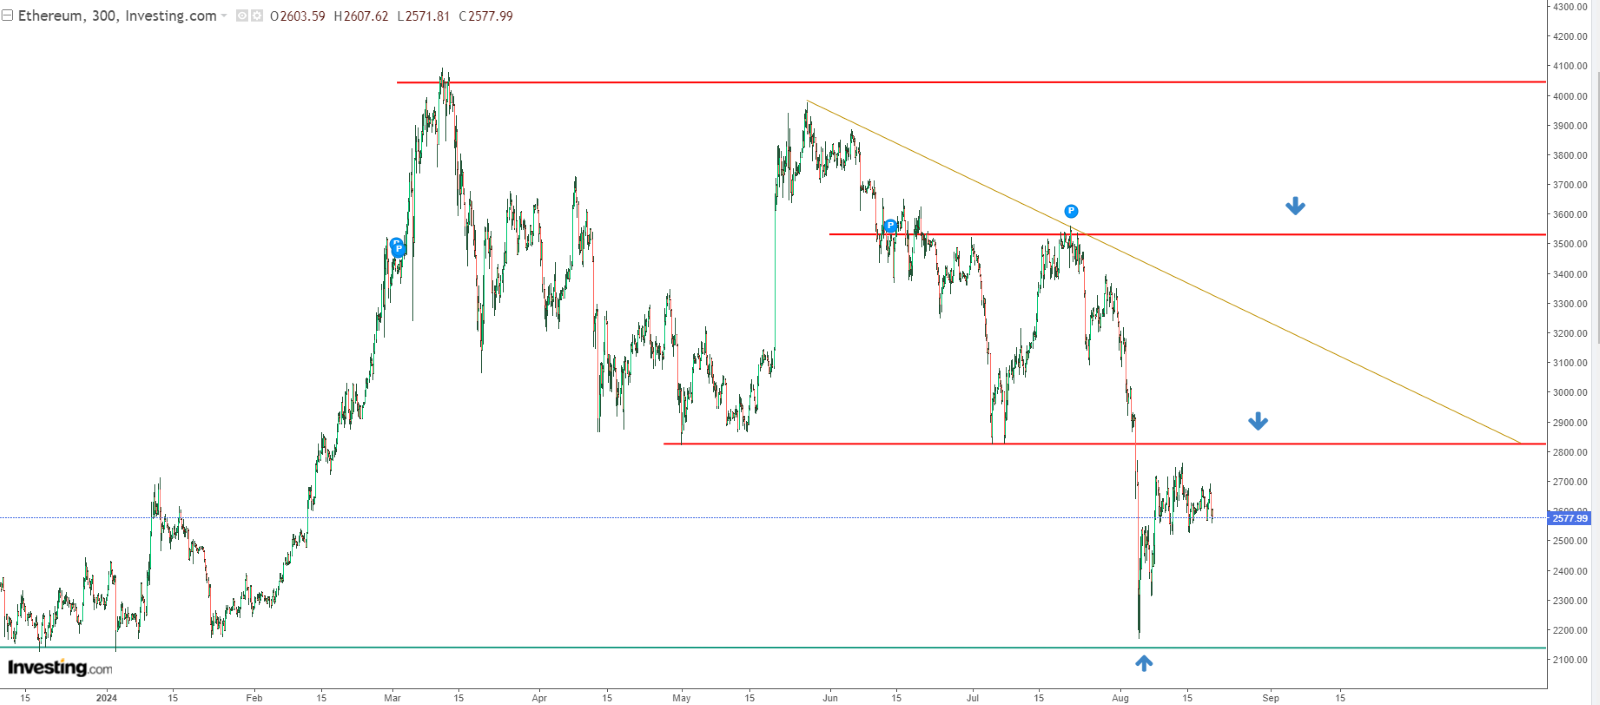
Ethereum currently sits just below the key resistance level of around $2,800. A breakout above this resistance will signal a potential continuation of its upward movement, with the first target being near the local downtrend line.

If Ethereum gains momentum, the next significant resistance level to watch is $3,500. This level could be the last hurdle before a potential push towards new all-time highs. Meanwhile, the primary support remains at the recently defended $2,200.
***
Disclaimer: This article is written for informational purposes only. It is not intended to encourage the purchase of assets in any way, nor does it constitute a solicitation, offer, recommendation or suggestion to invest. I would like to remind you that all assets are evaluated from multiple perspectives and are highly risky, so any investment decision and the associated risk is at the investor's own risk. We also do not provide any investment advisory services. We will never contact you to offer investment or advisory services.
