AngloGold Ashanti’s shares rise nearly 3% as profit soars on higher gold prices
- Bitcoin is facing resistance at the $31,000 level after rallying, thanks to continued institutional interest
- Ethereum is also on the rise, but momentum is not as strong as Bitcoin's
- Overall, the crypto market is still volatile, and correction risks lurk
- InvestingPro Summer Sale is on: Check out our massive discounts on subscription plans!
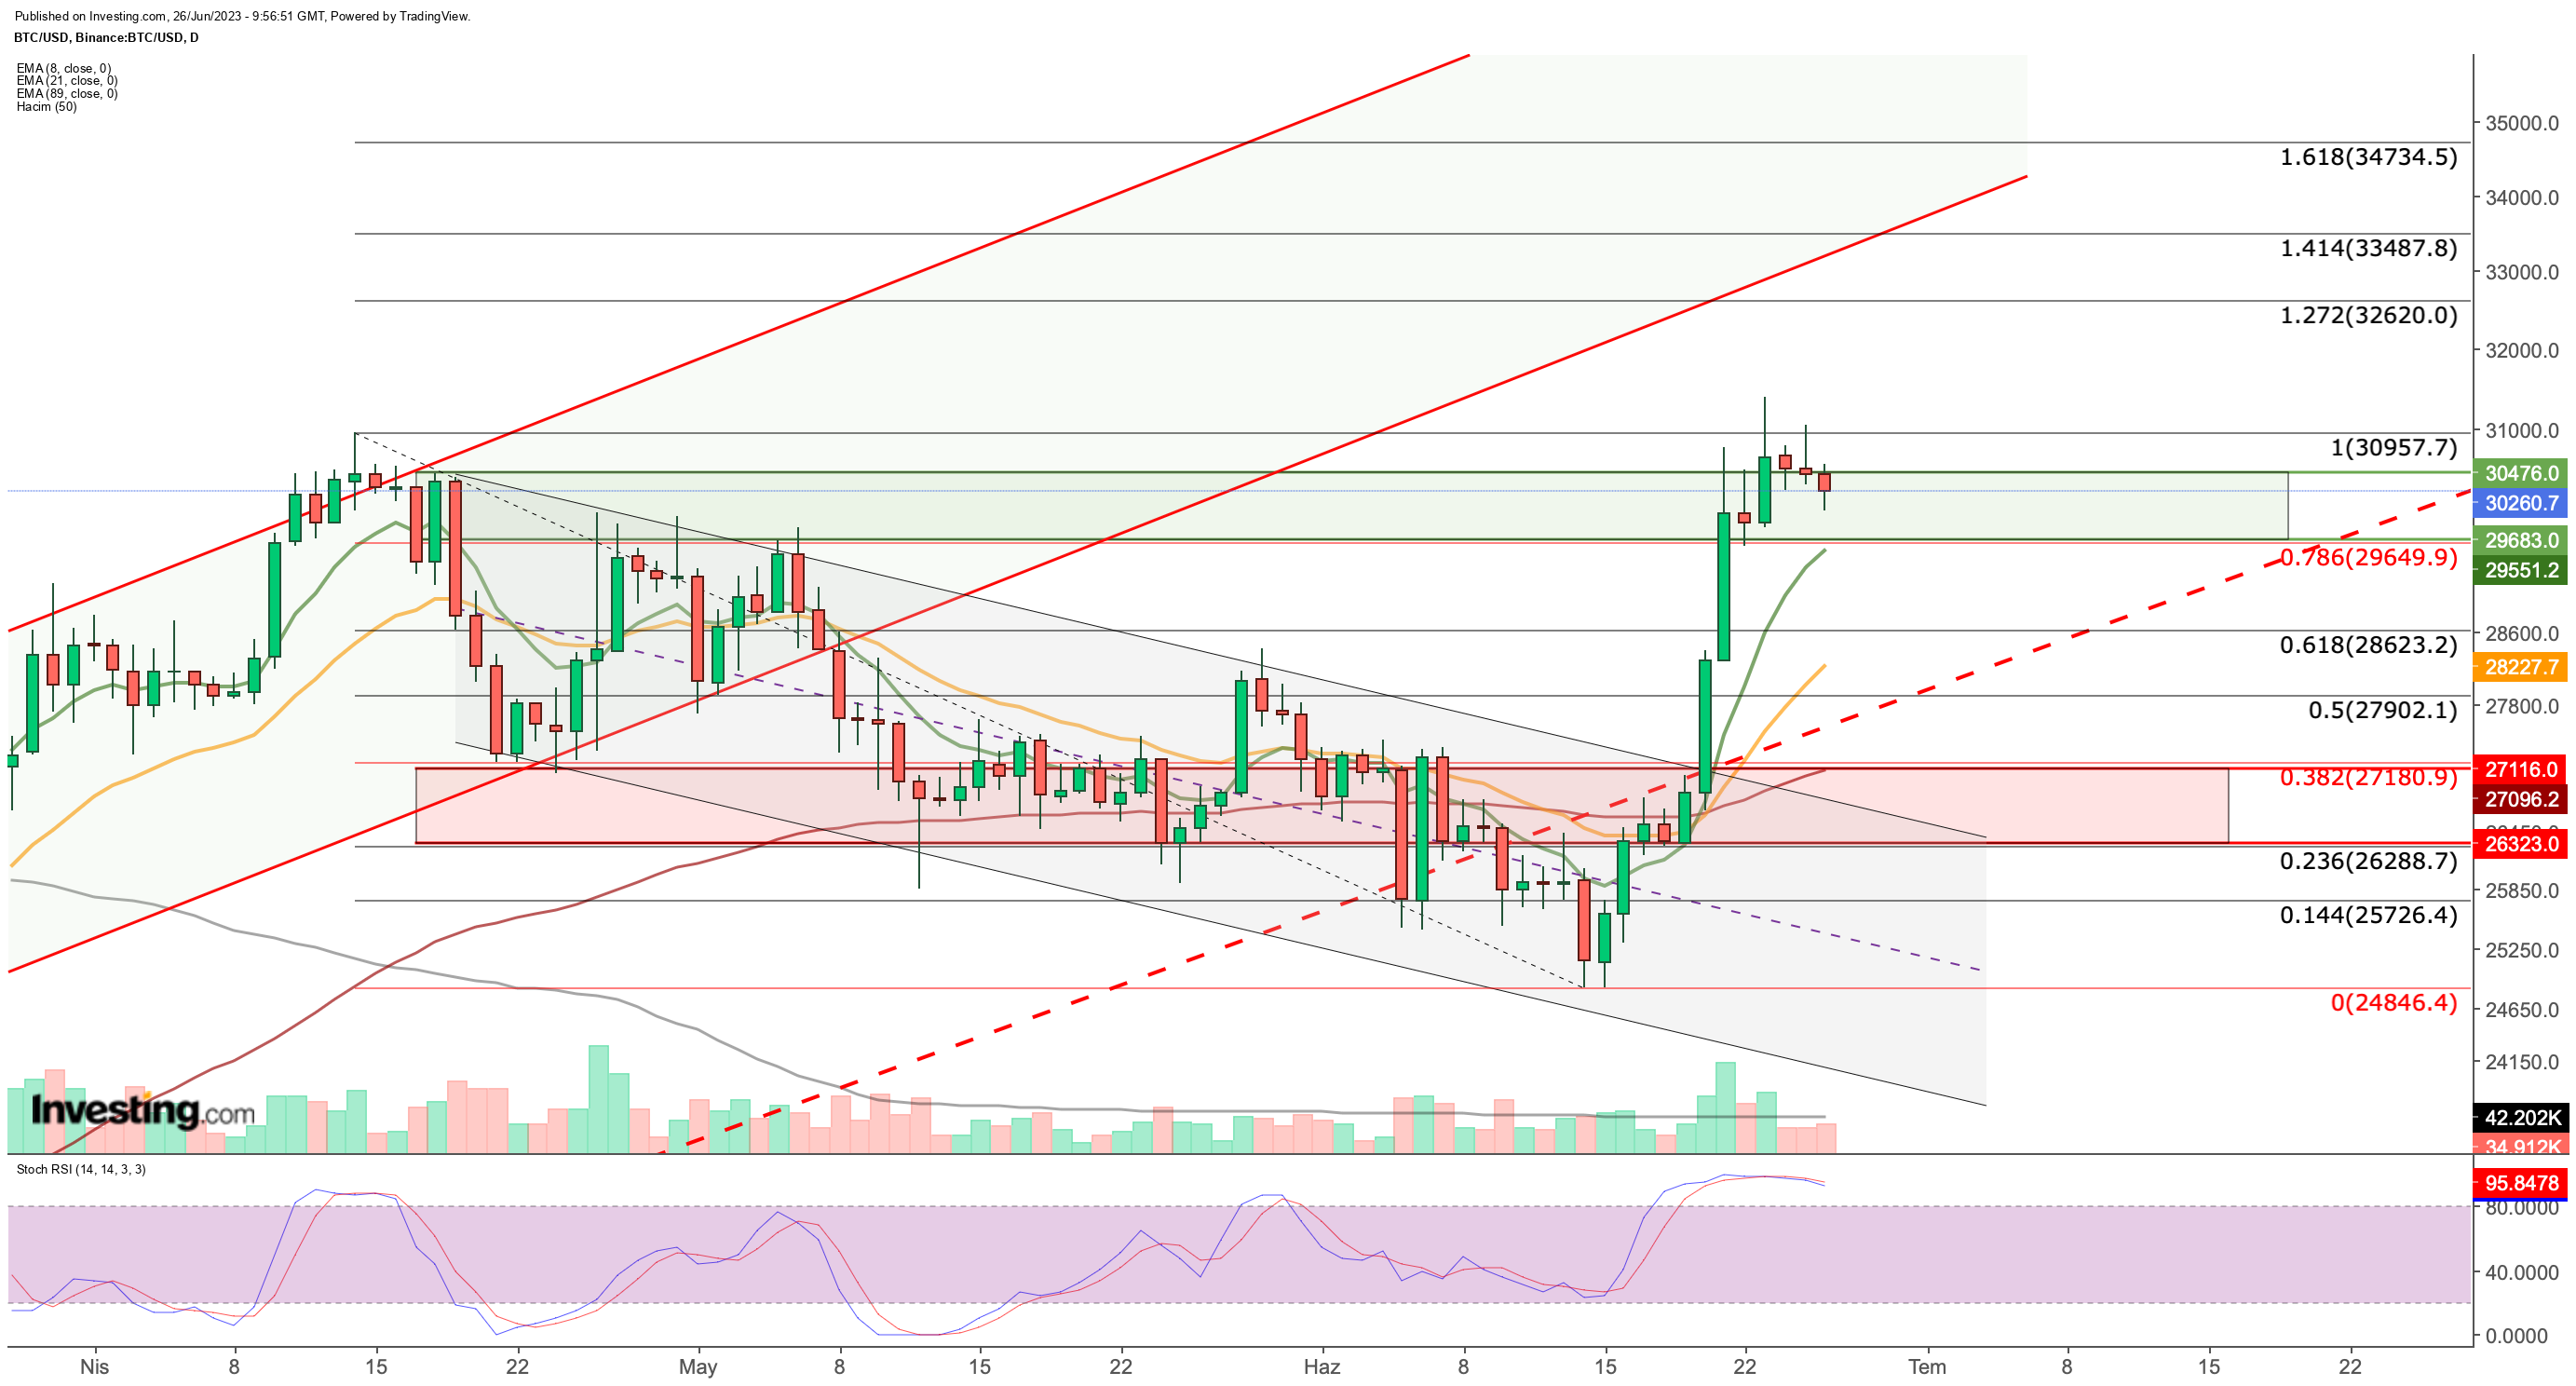
Last week, Bitcoin swiftly surpassed the $27,000 - $28,000 resistance zone. However, in the latter half of the week, its momentum slowed down upon reaching the resistance area at $29,600 - $31,000.
As the weekend approached, Bitcoin tested the $31,000 region, revealing signs of buyer exhaustion. Presently, bulls are struggling to cross the range of $30,500 - $31,000.
It has become crucial to establish a clear daily candlestick at the $31,000 level to sustain its upward movement. Should this pattern emerge, the subsequent target range to monitor will be $32,600 - $34,700, based on the declining momentum observed from April to June.
Although the bullish outlook for Bitcoin is currently intact, the initial support level to monitor during potential pullbacks is at $29,650. If the day concludes below this value, it could signify the beginning of a correction from the recent surge. In such a scenario, Bitcoin might decline further to $28,000 - $28,500 in the initial stage.
Moreover, the Stochastic RSI indicator will confirm whether a correction has started. If the indicator starts moving below 80, it could trigger BTC's descent toward short-term support levels.
Conversely, if the $28,600 support level holds, Bitcoin may trade sideways within the $29,600 - $31,000 range for some time.

Such a chart formation would sufficiently alleviate the Stochastic RSI, allowing Bitcoin buyers to gather strength for the subsequent upward move.
Additionally, the continuity of institutional interest, which instigated Bitcoin's recent surge, is crucial for sustaining positive movement.
In this regard, the Securities and Exchange Commission's (SEC) approval of a new Bitcoin ETF over the weekend can be interpreted as a further softening of its stance towards crypto markets, particularly Bitcoin.
Furthermore, comments from Fed Chairman Powell supported last week's rally, and with his ongoing remarks on the crypto sector expected this week, the market may retain its buoyancy.
Consequently, as long as Bitcoin remains above $29,600 this week, its bullish potential is likely to endure.
Critical Levels to Watch in Ethereum
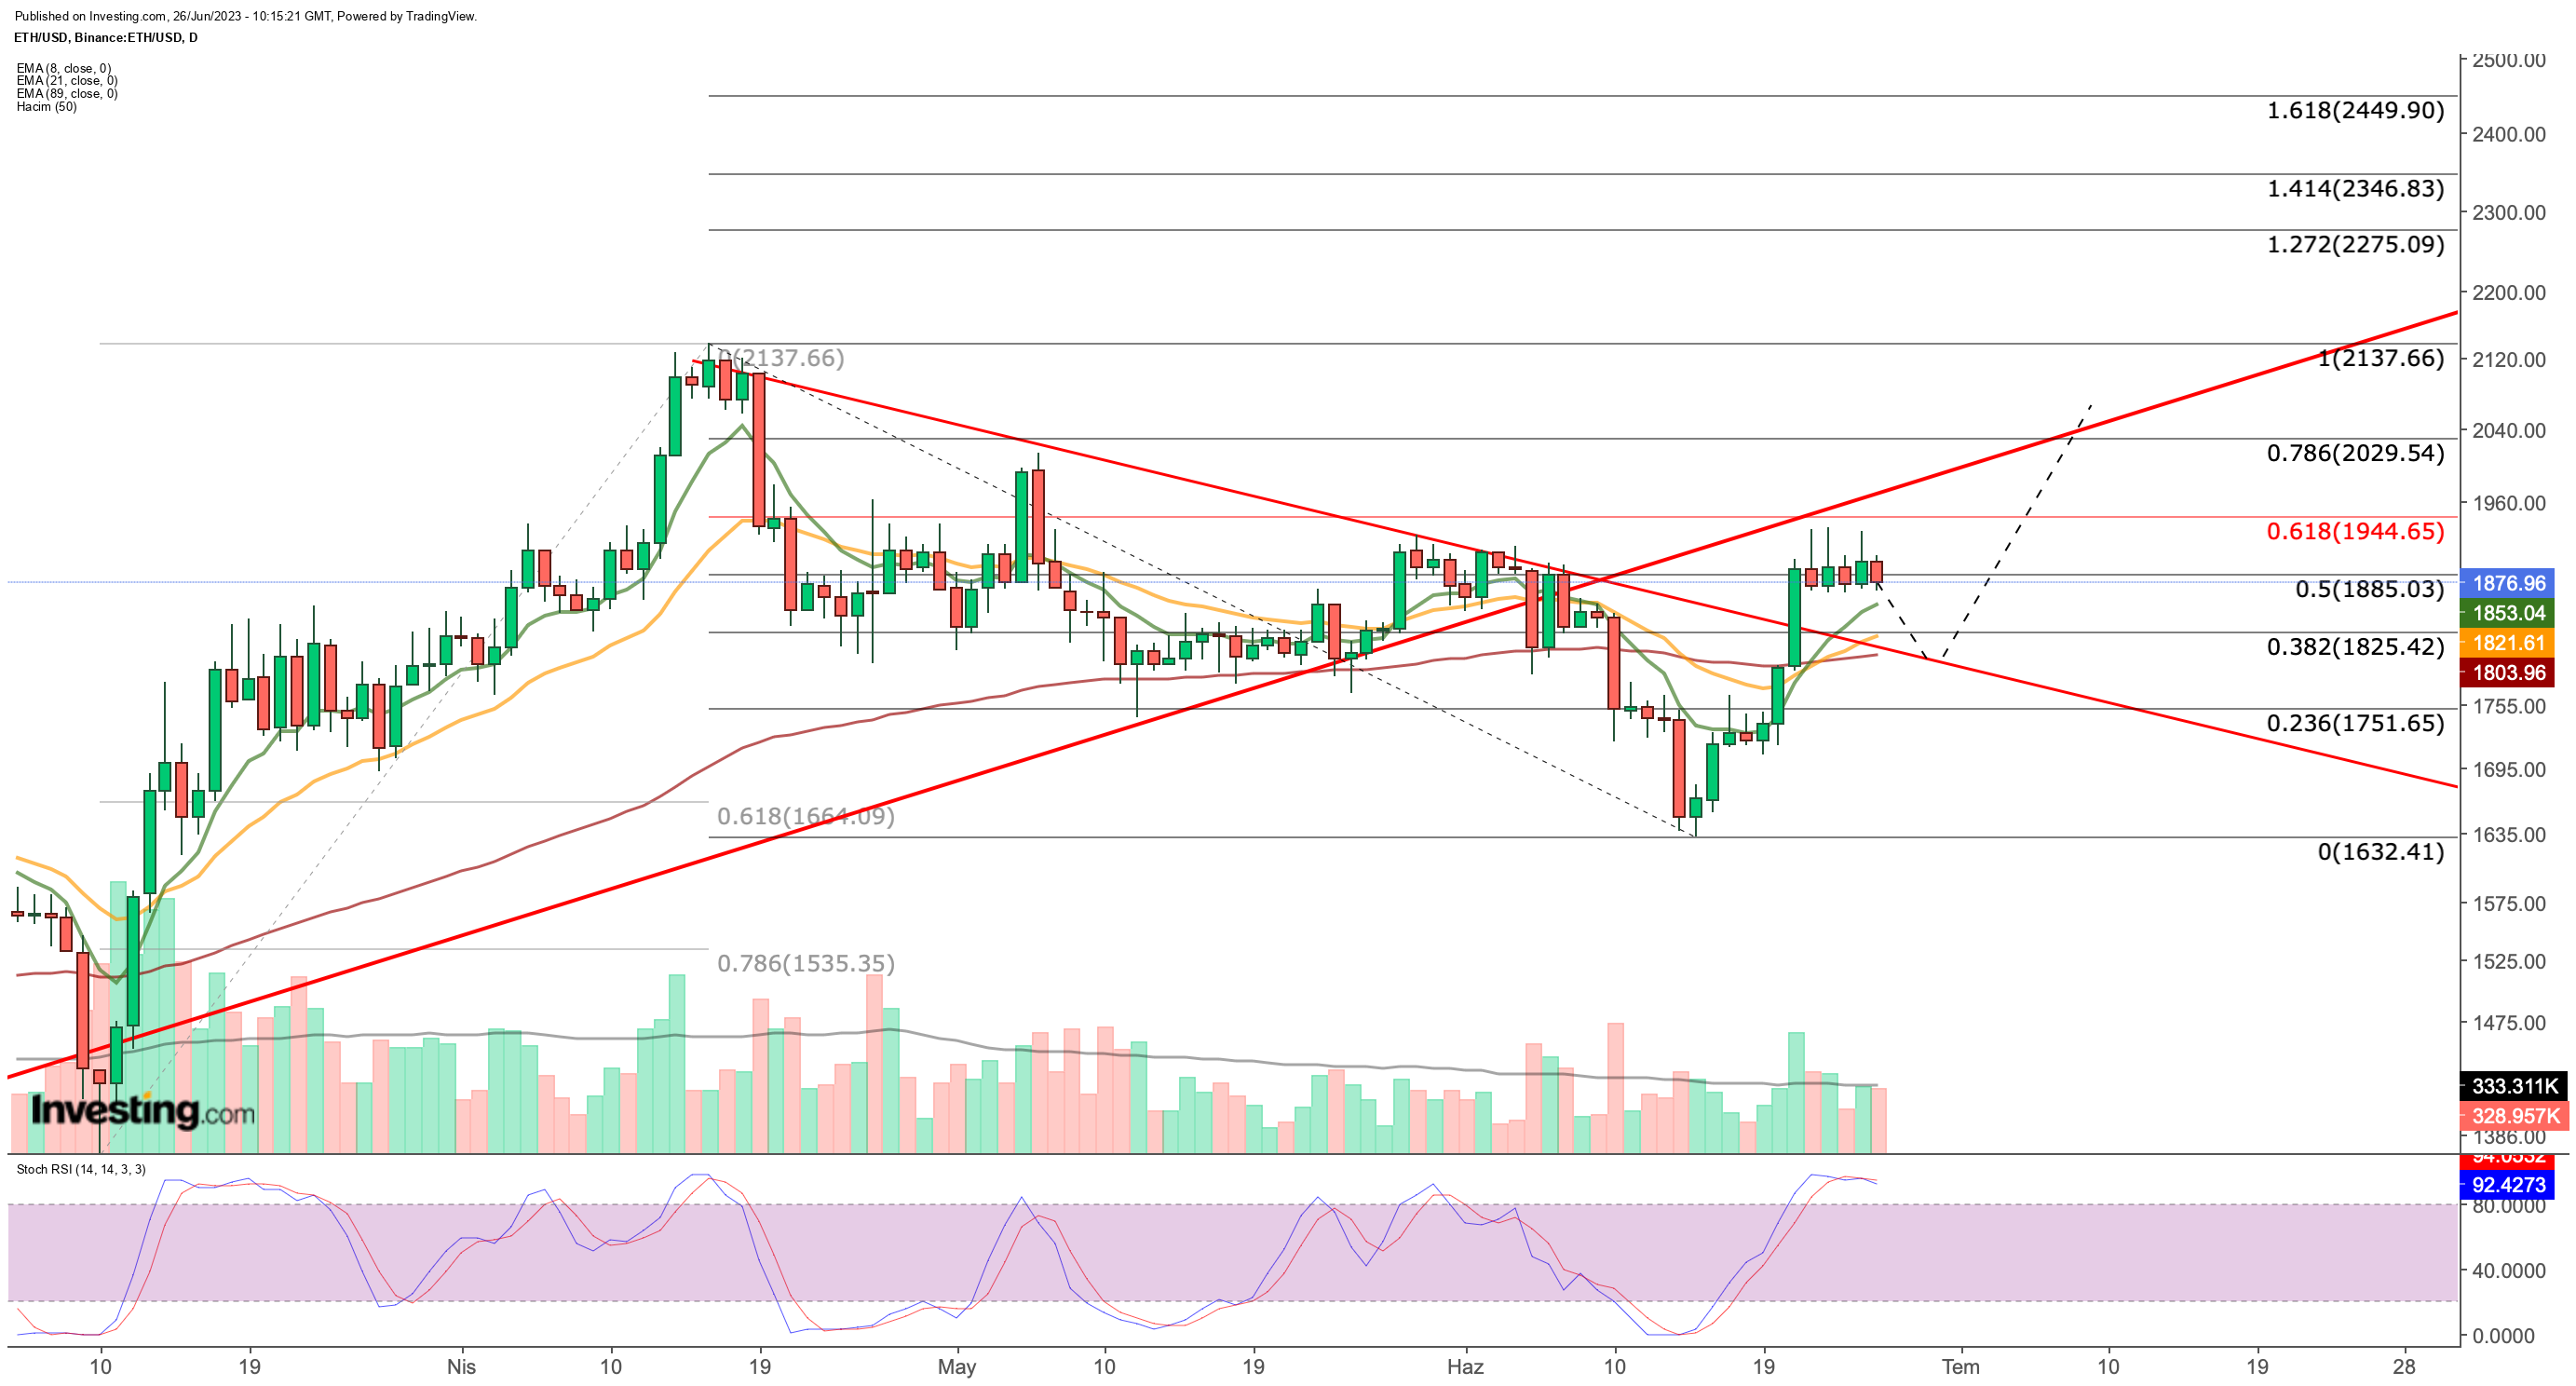
In early June, Ethereum declined following SEC's crackdown. However, it found support at Fib 0.618 (1,660), which served as an ideal correction level compared to the previous bullish wave.
During the latter half of June, Ethereum participated in a market-wide recovery process, breaking the short-term downward momentum by surpassing the $1,825 resistance. However, its momentum didn't match that of Bitcoin.
Currently, ETH is encountering resistance within the $1,870 - $1,900 range. While the nearest resistance zone is around $1,945 on average, surpassing this level with a daily close could bring the $2,030 resistance into focus.
Reclaiming the $2,000 level for ETH would signify a resurgence of the 2023 uptrend, potentially leading to a movement toward the $2,250 - $2,450 range.
Nevertheless, it is crucial to maintain support at $1,885. Below this level, the average price of $1,820 becomes a second and more critical support. This region aligns with short-term exponential moving averages and coincides with the short-term downtrend line.
If Ethereum bulls successfully keep the cryptocurrency above $1,800 during a possible pullback, we may witness ETH breaking the resistance line and reaching the $1,950 level, thereby advancing toward the short-term target zone around the $2,000 mark.
Get ready to boost your investment strategy with our exclusive summer discounts.
As of 06/20/2023, InvestingPro is on sale!
Enjoy incredible discounts on our subscription plans:
- Monthly: Save 20% and get the flexibility of a month-to-month subscription.
- Annual: Save an amazing 50% and secure your financial future with a full year of InvestingPro at an unbeatable price.
- Bi-Annual: Save an amazing 52% and maximize your profits with our exclusive web offer.
Don't miss this limited-time opportunity to access cutting-edge tools, real-time market analysis, and the best expert opinions.
Join InvestingPro today and unleash your investment potential. Hurry, Summer Sale won't last forever!
Disclaimer: This article was written for informational purposes only; it does not constitute a solicitation, offer, advice, counsel, or recommendation to invest, nor is it intended to encourage the purchase of assets in any way.

