Gold prices recover as fiscal concerns, US rate uncertainty drive haven demand
Cisco Systems (NASDAQ:CSCO) is scheduled to release corporate results after market close today. The forecast calls for EPS of $0.81 and revenue of $13.07 billion — slightly lower than the previous quarter’s $0.83 EPS and $13.43 billion revenue, but up from the same quarter last year ($0.75) and flat on the revenue.
In the last 25 quarters, the company missed once on earnings — in August 2013 — and three times on revenue. So, will the company maintain its record of strong earnings today? We bet against it. The supply-demand balance suggests price weakness. Informed money may be trying to tell us something through the distribution of the company's shares.

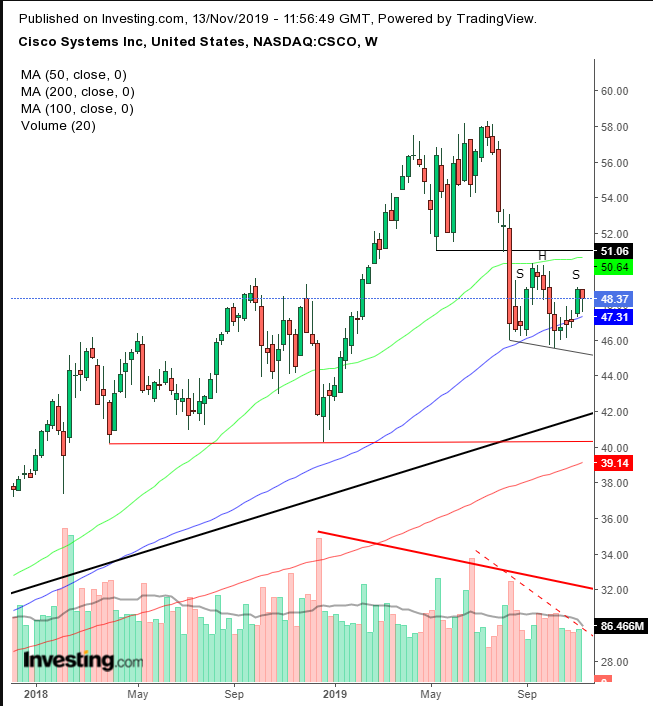
The stock plunged more than 8% on Aug. 15 after the company revealed that its Chinese business had plummeted 25%, creating a huge falling breakaway gap that topped out the stock. Since then, the price has pulled back, found resistance by the gap, and fallen more than 9%, while registering another low in the downward trend since the July high.
The stock rebounded from the Oct. 10 low by 7.4%, more than 4% below the resistance above the gap and more than 2% from the September high, driven by demand attempting to challenge that supply line.
As things stand, the pattern that emerges since the breakaway gap in mid-August is a continuation H&S pattern since August. A downside breakout below the neckline’s $45 level would imply a break below the long-term uptrend line since 2016 and a retesting of the $40 support since March 2018. And if that level breaks, it will complete a massive H&S top, implying a revisit to the 2016 lows, in the $20 area.
Volume has been drying up, as have both the short-term H&S continuation pattern and the long-term H&S top in the making. The 50 DMA crossed below the 200 DMA, triggering the much-feared death cross, and the 100 DMA crossed below the 200 DMA amid the current rebound — none of which are encouraging signs.
To recap; the price is currently developing a continuation pattern since August, which, if it completes, would suggest it may fall below the long-term uptrend line and target the $40 support. If this support is broken, it would imply a loss of close to 50%.
Trading Strategies
Conservative traders would wait for the completion of the massive H&S top since March 2018.
Moderate traders would risk a short once the current, smaller H&S completes.
Aggressive traders may short now, providing they understand and can withstand the risk.
Trade Sample
- Entry: $49
- Stop-Loss: $51
- Risk: $2
- Target: $43
- Reward: $6
- Risk:Reward Ratio: 1:3
