Is this U.S.-China selloff a buy? A top Wall Street voice weighs in
Markets were rattled after Iran last night made good on its threats to retaliate against the U.S. for the killing of General Qassem Suleimani last week. In immediate response, oil surged along with the usual safe havens, while global stocks and U.S. futures plummeted.
However, the reaction was short-lived and havens later pared gains, with some even registering declines. Asian stocks locked in decreases and European shares were well off their lows. U.S. futures, however, came back and wiped out nearly all losses.
That show of resilience demonstrates the confidence investors, at home and abroad, have in the U.S. markets. While some of that faith may be attributed to a positive outlook on growth, we expect it also has a lot to do with expectations of a cheap supply of money, making it easier for investors to swallow bitter pills like tension in the Middle East and a seesaw in U.S.-China trade relations, which have long since lost any credibility.
Does this signify that U.S. equities will continue higher? It’s not that simple.
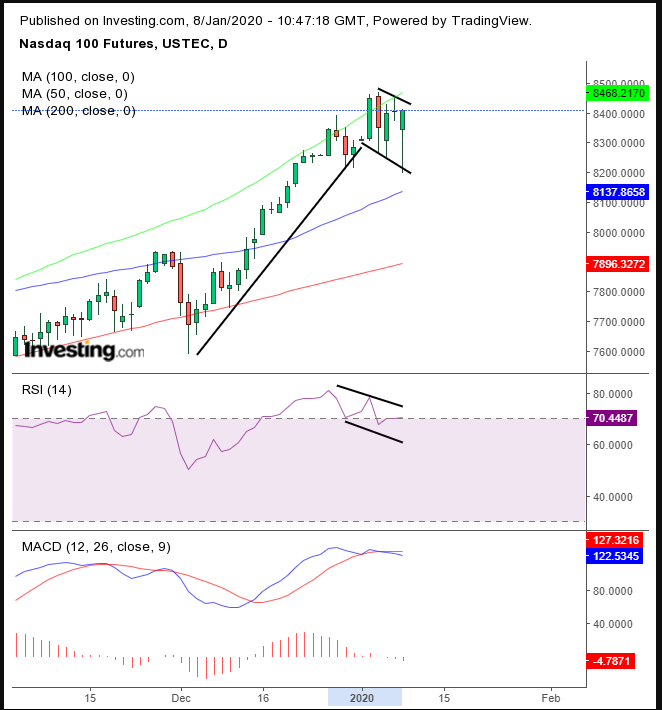
The Nasdaq Futures chart may be able to offer some insight, as recent rallies were led by the tech industry.

The RSI and MACD both provided sell signals. The RSI reached the most overbought condition since March, right before the Nasdaq experienced a 12% selloff.
On the other hand, the price may have been developing a falling flag, bullish after the near-double digit rise since December.
Therefore, investors should wait for either a failure of the pattern, as the indicators seem to suggest, or for an upside breakout — watching to see how the market mechanics of a return move that confirms demand outpacing supply evolve, to be followed by indicators evening out, if not providing outright buying signals.
Trading Strategies
Conservative traders would wait for an upside breakout only, as they would go with the trend.
Moderate traders may risk shorting against the general trend, if the pattern fails and bounces, only to find resistance below the failed flag.
Aggressive traders may move with a breakout in either direction.
Trade sample
