Redwire and Red Cat partner on drone integration for U.S. Army missions
Yesterday, we noted that the energy sector stands to gain the most from a variety of recent fundamental tailwinds. Those include optimism that three newly announced coronavirus vaccines will help spur a return to economic growth, along with a shift by investors out of overvalued tech stocks into underperforming value shares—including energy equities—which have lagged markets on pandemic-fueled pessimism and a contracting economic environment.
In Tuesday's post we zeroed-in on oil and gas supermajor Exxon Mobil as a proxy for the entire sector.
Today we'll take a closer look at financials, which, after energy, have suffered the most during the pandemic, as lower-for-longer rates and a flattening yield curve narrowed profit margins.
The rising optimism triggered by the potential for vaccines to soon become widely available, has boosted investor and consumer appetites. And that's caused the gap between long and short bonds to widen, increasing the difference between the rates banks pay savers and the yield these lenders enjoy on loans they approve and administer.
Which places banks in the unique position of being able to enjoy newfound demand from two directions: reanimated interest in their stocks and an improved business outlook. With a -0.7% YTD performance for the sector, bank valuations are among the lowest, second only to energy; as well, the steepening curve will increase financial institutions' profit margins.
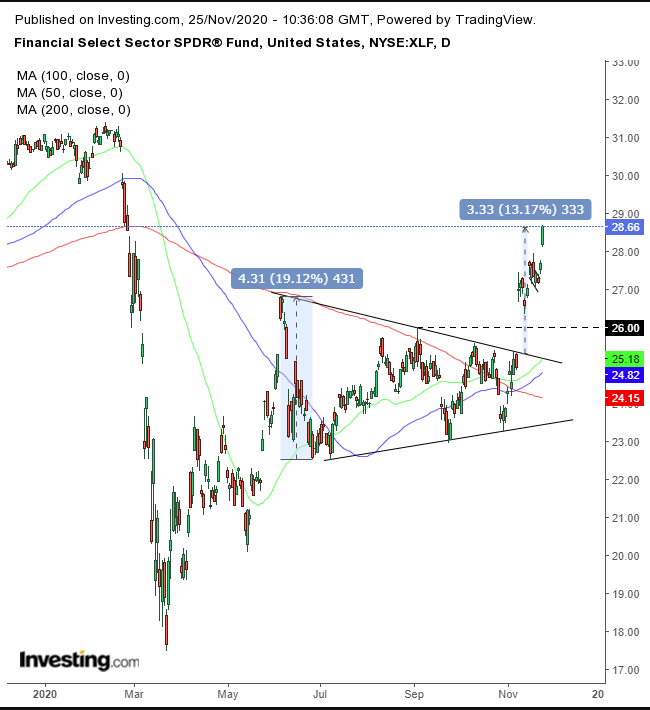
Which means there are abundant buying opportunities ahead for savvy investors looking to profit from the financial sector. This optimistic outlook is perfectly reflected in the Financial Select Sector SPDR® Fund (NYSE:XLF), the proxy ETF for the segment.

XLF opened +1.75% yesterday and proceeded to double its gains over the course of the day, closing higher by 3.5%. The jump followed a bullish flag, a short-term pause that tends to develop in the middle of a move. Falling flags such as this one tend to evolve after sharp and fast gains, as out-of-breath traders take a break and try to find their bearings.
The move started with a 9% surge, on a breakaway gap that completed a symmetrical triangle—which included a golden cross—a continuation pattern.
While the flag’s implied target has been actualized, there remains another $1 advance in order for the triangle’s implied target to be realized. However, the $30 levels are likely where traders will find resistance; it's a psychological, round number, as well as the February record-peak, attained pre-COVID.
In order to trade this opportunity effectively, timing is crucial and a pullback would provide opportunities.
Trading Strategies
Conservative traders who wait only for ideal positions that rarely present themselves, would have to hold back for a return-move to the triangle. The $26 level (dotted line), where the Nov. 12 low found support above the Sept. 3 high, might be an ideal entry.
Moderate traders would wait at least for the price to retest the flag.
Aggressive traders would be happy to get a pullback to the $28 level, for a better entry, not proof of support.
The way one handles one's self in this trade will have as much, if not more, impact on the trade results than a close understanding of the analysis. Here’s an example:
Trade Sample
- Entry: $28
- Stop-Loss: $27
- Risk: $1
- Target: $31
- Reward: $3
- Risk:Reward Ratio: 1:3
