Is this U.S.-China selloff a buy? A top Wall Street voice weighs in
U.S. stocks are slated to open lower today, following global stocks’ reaction to news that tariffs on China goods will remain in place till at least after the U.S. presidential elections and that the U.S. administration is moving to block more supply to Huawei, a sore point for China.
The NASDAQ Composite (-0.24%) underperformed yesterday, falling away from its highest on record, after Bloomberg reported the trade dispute isn’t over just yet.
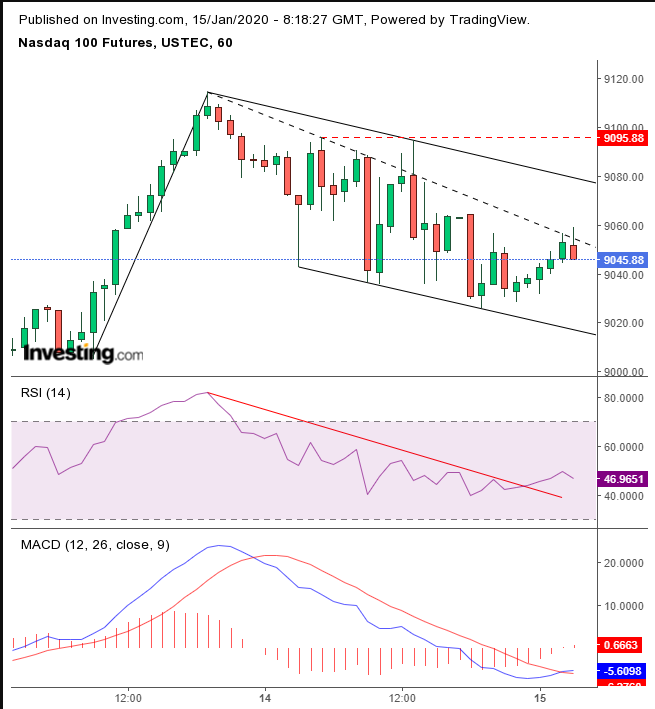
However — and this is a surprise — Nasdaq Futures have been climbing ahead of the open, paring almost all the extended drop since yesterday’s closing. Of course, yesterday’s decline still remains. However, the chart suggest the Nasdaq may offset Tuesday’s losses as well.

The Nasdaq is rising toward the top of a possible falling flag, bullish following a straight 12-hour advance since Monday 9:00 AM till 7:00 PM. While there were 13 hours within the advance, one of the hours closed at the same price as the previous one.
We have provided the purist interpretation for the flag top, including all intraday pricing. However, more aggressive traders may have drawn a tighter line, reflecting more accurately the resistance on the overwhelming majority of the price action.
According to that reading, the price peaked above that trend line at 3:00 EST and responded by falling back. This reaction, the first hourly drop, on an intra-hour basis, demonstrates the significance of this trend line.
The MACD and the RSI both provided buy signals. The MACD’s short MA crossed over the long MA from an oversold condition. The RSI broke above its down trend for the period during the flag’s congestion, during the third hour rise.
An upside breakout would demonstrate that all available supply is absorbed and bulls are prepared to up their bids to find more willing sellers, taking prices even higher.
Trading Strategies
Conservative traders would wait for a new record high, followed by a pullback that proves resistance over the flag and then enter a long position.
Moderate traders would wait for a close above 9,100, a round number and the highest price since the decline (dotted red line), then wait for the return move for a better price, if not for proof of trend.
Aggressive traders may risk a short back toward the bottom of the flag at 9,020 and ride it back up, or go long after a close above the dotted black trend line, above 9,060.
Trade Sample - Short Setup
