Verizon to cut 15,000 jobs amid growing competition pressures - WSJ
We have been overall bearish on U.S. equities for some time, based on the fundamentals, macroeconomics and geopolitics. Since the December drop, which established a medium-term downtrend, the technicals have been sending discouraging signals as well. But this may be in the process of changing, though it's unlikely to be all clear sailing.
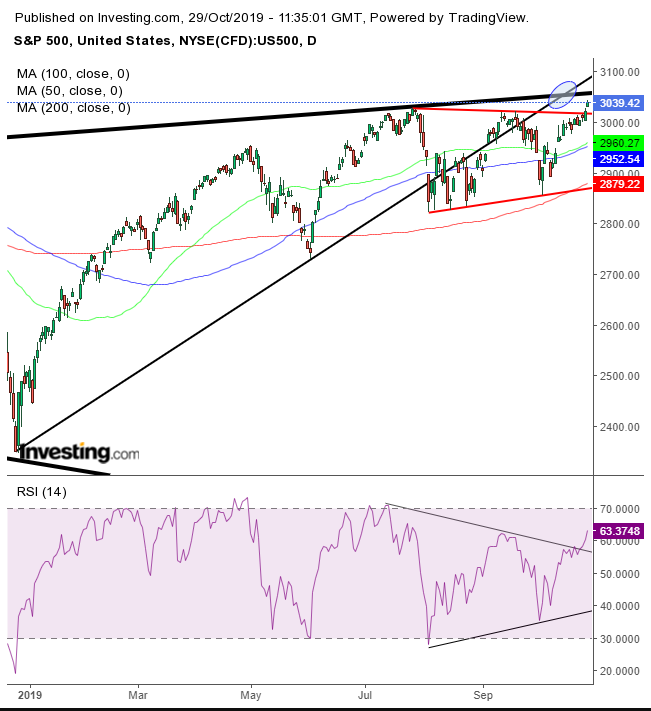
The technical picture has been complex. Since the December plunge, the S&P 500 registered two rising peaks and troughs with the July peak establishing an uptrend in the medium-term that would join the long-term uptrend since the 2009 bottom. 
It has since fallen twice below the uptrend line since the December bottom, though it remains below the medium-term uptrend line. However, yesterday it completed a symmetrical triangle with an upside breakout.
A symmetrical triangle demonstrates an equilibrium, as equal determination from buyers and sellers establishes the price between the two sides. Therefore, when the supply-demand balance breaks the top of the pattern, it reveals that all supply has been absorbed and sellers are raising their bids, beyond the range, to seek out new, willing sellers — along with a short squeeze and triggered longs — presumably propelling prices higher.
Not only did the price complete a continuation pattern to the topside, but the price created a breakaway gap, to boot. When a price breaks away from a range by "jumping on air,” it not only symbolizes the market’s mood but demonstrates that all investors are on the same side, buying.
The RSI signals that momentum is behind the move, as it cut the topside of its own symmetrical triangle. The 50 DMA reached the peak of the 100 DMA and preceded higher; the 200 DMA scaled above the bottom of the triangle — all suggesting a broad range of prices are rising at a crucial level to the balance of supply and demand.
Still, the price remains below the broken medium-term uptrend line since the pre-Christmas selloff, as well as the top of a broadening pattern (thick black line) since January 2018.
How do analysts navigate through so many, often conflicting, technical variables? They attempt to measure the weight of the balance. Additionally, it’s crucial to find the pressure point, the line in the sand between buyers and sellers, the level beyond which we must assume the scales have been tipped.
We consider that crossroad to be at the X where the massive broadening pattern — typically forming at market tops, denoting a lack of direction, providing fertile ground for a bear market — meets with the broken medium-term downtrend line since the worst Christmas-eve selloff ever.
If the price crosses above the 3,100 level, we would assume that whatever supply was there has been absorbed or converted to bulls and another leg higher would ensue. On the other hand, if the price finds significant resistance at this level, it would have the makings of another leg down, toward the bottom of the broadening pattern, after its previous low at 2,351.
How does this view jibe with an upside breakout of a symmetrical triangle, which is a continuation pattern, with a rising, breaking gap, no less? Well, there are pattern failures, which, like an overstretched spring, act as a catapult, in the reverse direction. Note, that the triangle penetration was only 0.7% and produced a small candle. If anything, the breakaway gap and record high ripen the field for an Island Reversal or at least an Evening Star, as the taller they are, the harder they fall.
Trading Strategies
Conservative traders should employ a 3% filter to avoid a bull trap. This penetration should clear the broadening pattern. Then they should wait for a return move to demonstrate the uptrend’s integrity.
Moderate traders may go long after a 2% filter, then wait for a pullback for a better entry, but not necessarily for evidence of demand.
Aggressive traders may risk a long position after a 1% penetration.
Trade Sample
