Intel surges as Nvidia takes $5B stake
Goldman Sachs (NYSE:GS) is scheduled to report 3Q earnings today before market open. The lender is forecast to report EPS of $4.86 on $8.34 billion revenue, dramatically lower than the $6.28 EPS and $8.65 billion revenue results of the corresponding quarter last year.
The reversed outlook for rates — a bank's bread-and-butter — since last year explains why analysts cut expectations. Plus, the lender is likely to get hit by disappointing IPOs such as WeWork and an overall slowdown in M&A activity.
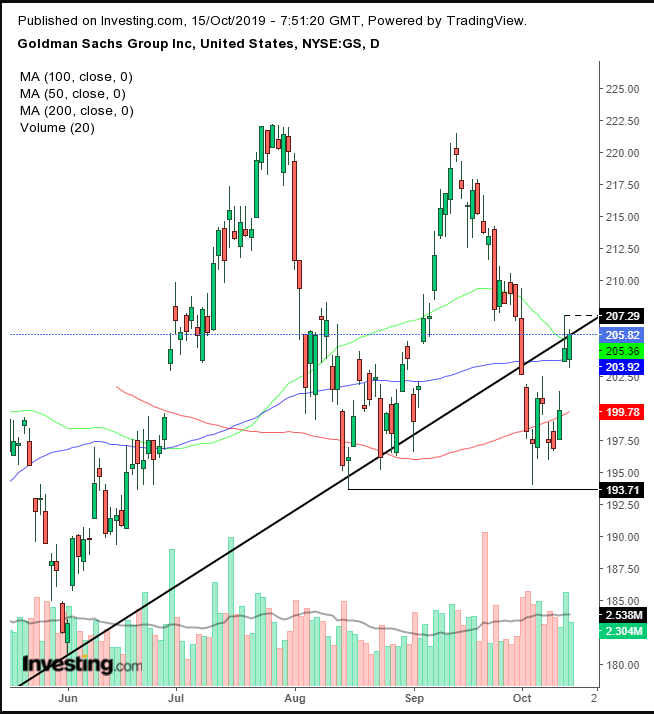
Still, whatever the earnings results for Goldman are, technicals are indicating that investors appear not to have written off the stock. Instead, they're waiting on the fence at a crucial price level which could determine whether the medium-term trend will resume higher or the short-term downtrend will extend into the medium-term.

The price fell below its uptrend line since the December bottom on Oct. 1 and closed right on top of it for the first time Monday. This marks the initial point of defense for the uptrend line. The second is the Aug. 15 low, which was respected by the Oct. 3 low that bounced right off it on an intraday level. That $193 level is crucial, especially after the Sept. 13 high failed to ascend above the July, $222 highs.
Back to the uptrend line since the December selloff – the fact that prices rebounded from the Oct. 3 lows to close right on top of it is an obvious representation of its “line in the sand” status, as traders wait for earnings results.
However, the weight of the evidence does not provide a clear signal.
On the one hand, there was Friday’s extremely bearish shooting star — the intrinsic pessimism of which increases with its confirmation of the resistance beneath the broken medium-term downtrend line. Note, also, Monday’s decreased volume, reinforcing Friday’s volatility as something traders dread.
On the other hand, multiple price, momentum or volume-based indicators such as MACD, RSI, ROC and OBV are showing a rebound, suggesting a continued rally.
Ultimately, we'll have to see whether the shooting star’s high is broken out or the August-October lows are breached. And traders now seem to be waiting for earnings to provide the clues for direction.
Trading Strategies
Conservative traders would wait for a new high to extend the medium-term uptrend above the July peak to go long or for two independently (not counting the medium term’s uptrend line peak of July) descending peaks and troughs to short.
Moderate traders may go long with a close above the shooting star or enter a short with a new low below $193.
Aggressive traders may range-trade between Friday’s highs and the October lows, before or after earnings are reported, depending on risk aversion.
Trade Sample – Short Position Setup
