TSX jumps amid Fed rate cut hopes, ongoing U.S. government shutdown

Market Context – A Controlled Pullback After Overextension
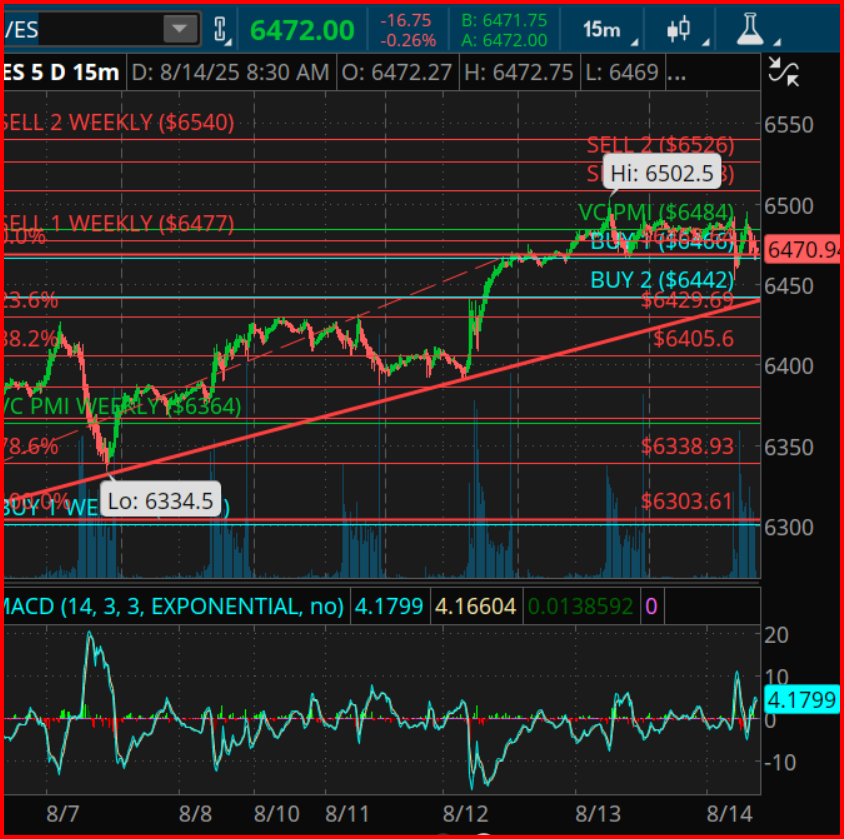
The E-mini S&P 500 has completed a textbook mean reversion swing from the August 7 low of 6,334.50 into the August 13 high of 6,502.50, a +168-point rally. This surge breached the upper boundary of the rising channel that has been intact since early August, signaling strong buying pressure. However, the immediate rejection near Weekly Sell 2 (6,526) confirms that sellers are still firmly defending higher resistance zones.
The current 6,472 price level positions us right between the Weekly VC PMI mean (6,484) and the Buy 2 zone (6,442) — the market’s “decision pocket.” Holding above 6,442 sustains bullish bias, but the inability to recapture 6,484 could lead to deeper testing of underlying support.
VC PMI Structure – Probabilistic Navigation
The Variable Changing Price Momentum Indicator (VC PMI) outlines the high-probability pivot framework for the week:
- Sell 2 Weekly: 6,526 – Extreme overbought; 95% probability of mean reversion lower.
- Sell 1 Weekly: 6,477 – First major resistance where short-term sellers emerge.
- Mean (VC PMI Weekly): 6,484 – Balance point between buyers and sellers.
- Buy 1 Weekly: 6,436 – First major demand zone.
- Buy 2 Weekly: 6,442 – Extreme oversold; 95% probability of mean reversion higher.
We just saw price reject from Sell 2 Weekly and revert toward Buy 2. This sequence fits perfectly into the VC PMI’s contrarian playbook — fade extremes, target the mean.
Gann Time Cycle Alignment – The Clock is Ticking
Overlaying Gann’s 45° and 90° divisions from the August 7 pivot low:
- 45° cycle rotation: August 12–13 — aligned perfectly with the push into 6,502.50 high.
- 90° cycle rotation: August 15–16 — next major time window for a possible directional change.
Historically, when a market hits a Gann 90° window while trading near extreme VC PMI levels, the odds of a reversal surge — especially if volume momentum begins to fade.
Square of 9 Price Harmonics – The Hidden Geometry
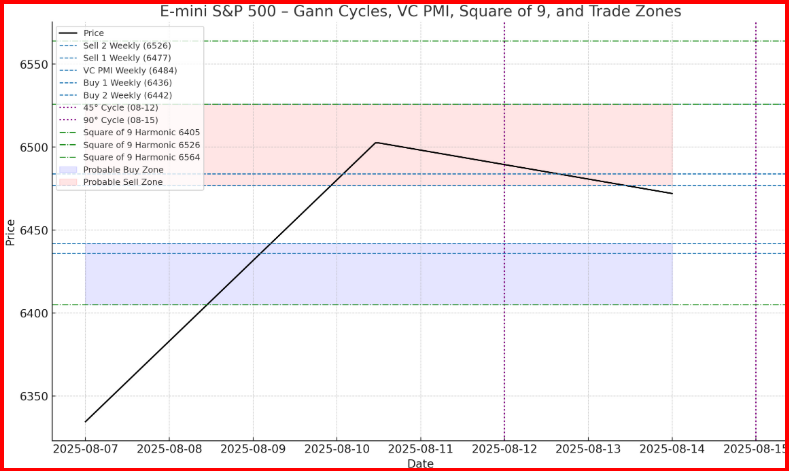
Using the 6,334.50 low as the anchor and projecting forward:
- First major harmonic: 6,405 – Aligns with Fibonacci 61.8% retracement and rising channel support.
- Second harmonic: 6,526 – Matches Sell 2 Weekly, the exact rejection zone from the 8/13 high.
- Next upside harmonic: 6,564 – If 6,526 is broken after the cycle date, this becomes the target magnet.
This harmonic precision reinforces that our recent high wasn’t random — it was a perfect Square of 9 resonance.
360-Day & Intermediate Cycles – Macro Pulse
On a broader scale, the 360-day cycle from the major swing low in late 2023 projects August 15–20 as a potential inversion point. This means the rally into this date range could flip into a corrective phase, or conversely, a correction into this window could mark a re-accumulation point for another leg higher.
Given that price is already in the upper quartile of its weekly distribution, the risk/reward now favors scaling out of longs and preparing for tactical shorts into the cycle window.
Tactical Roadmap
- Bullish Scenario: Hold above 6,442 into August 15 cycle turn → reclaim 6,484 → retest 6,477–6,526 with extension toward 6,564.
- Bearish Scenario: Fail to hold 6,442 → accelerate toward 6,405 (harmonic + Fib + trendline) → deeper mean reversion to 6,338.
- Cycle Trigger: August 15–16 — watch for sharp pivot/reversal signatures.
Bottom Line
We’re entering a time–price compression zone where VC PMI extremes, Gann time windows, and Square of 9 harmonics are in near-perfect alignment. This is historically when big moves emerge — but they often begin against the prevailing trend before resuming. The key battle line is 6,442; hold it, and the bulls get one more push; lose it, and we could be in for a 70–100 point flush.
***
TRADING DERIVATIVES, FINANCIAL INSTRUMENTS AND PRECIOUS METALS INVOLVES SIGNIFICANT RISK OF LOSS AND IS NOT SUITABLE FOR EVERYONE. PAST PERFORMANCE IS NOT NECESSARILY INDICATIVE OF FUTURE RESULTS.