Asahi shares mark weekly slide after cyberattack halts production

The E-mini S&P 500 futures have entered a critical stretch where price, time, and cycle analysis converge into a tight decision window.
From a price perspective, the bullish continuation path is clear.
However, the bearish reversal path is equally well-defined.
The 360-day master cycle adds weight to this timing.
The E-mini S&P 500 futures have entered a critical stretch where price, time, and cycle analysis converge into a tight decision window. Trading at 6412.75, the market has been riding a bullish wave from the August 1 low at 6239.5, breaking through the VC PMI Weekly pivot at 6328 and pressing into the Sell 1 Weekly resistance at 6409. The early high at 6426.75 is more than just another tick—it sits on top of the 78.6% Fibonacci retracement and a Square of 9 harmonic, making it a line in the sand for the next directional push.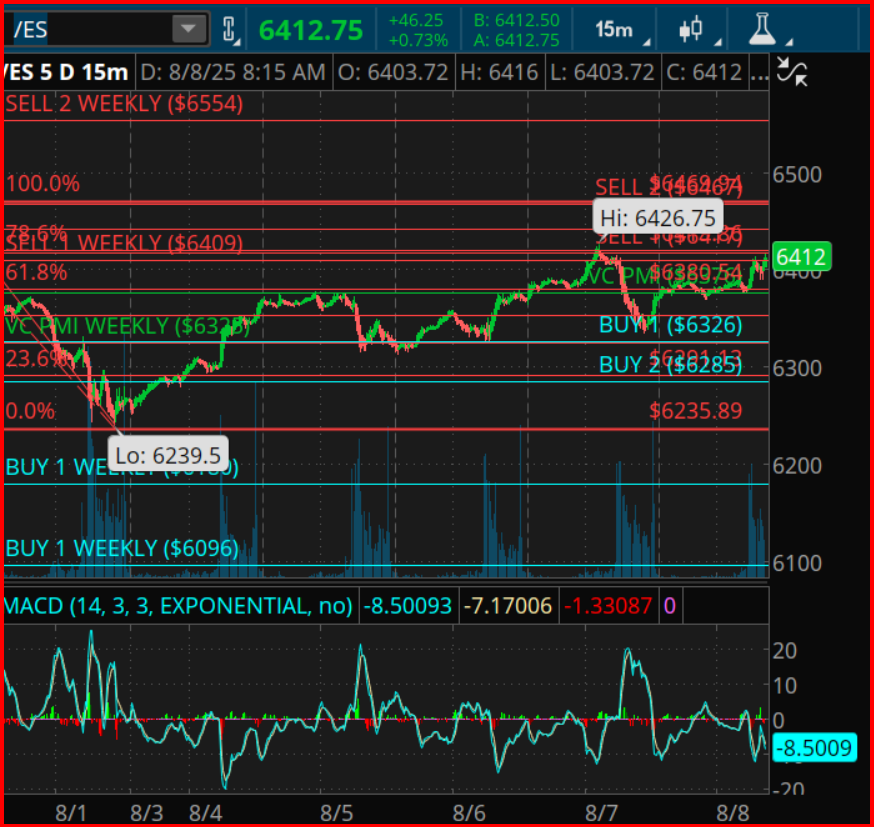 From a price perspective, the bullish continuation path is clear. If the market can close above 6426.75, it opens the door to 6469—the 100% Fibonacci retracement—and potentially to 6554, the Sell 2 Weekly level that also aligns with a full Square of 9 rotation from the August 1 low. In this scenario, August 9 becomes the first time target, a short-term Gann crest where traders should be alert for signs of exhaustion. Should momentum hold, the rally could stretch into August 14, the secondary and potentially more decisive pivot point, where cycle pressure from both Gann counts and the 360-day master rhythm peaks.
However, the bearish reversal path is equally well-defined. If the market fails to hold above 6328, the bullish structure begins to unravel. This would set the stage for a pullback into 6285 (Buy 2 Weekly) and possibly a full test of the August 1 swing low at 6235.89. A break of that level would confirm that the August 9–14 window is acting as a cycle top rather than a consolidation point. The 360-day master cycle adds weight to this timing. We are in the cresting phase of the annual rhythm that began in August 2024, a phase that historically produces important highs in early to mid-August before turning lower into late September or early October. This means that the August 9–14 window is not just another short-term timing zone—it could be the last gasp before a seasonal and cyclical correction unfolds. That correction, if in line with past patterns, could carry prices down toward the 6180–6200 area by late September, creating the next major buying opportunity.
In short, the E-mini S&P 500 is in a compressed battlefield between bullish breakout potential and cyclical topping risk. Above 6426.75, the path is open to 6469 and 6554, but every tick higher into August 9 and August 14 must be viewed through the lens of an aging cycle. Below 6328, the market shifts to defense, aiming for 6285 and 6235, with late September looming as a probable low window.
This is not a time for passive observation—it’s a moment to match technical precision with disciplined timing. The market’s rhythm is about to hit a beat that could define the rest of the quarter.
***
TRADING DERIVATIVES, FINANCIAL INSTRUMENTS AND PRECIOUS METALS INVOLVES SIGNIFICANT RISK OF LOSS AND IS NOT SUITABLE FOR EVERYONE. PAST PERFORMANCE IS NOT NECESSARILY INDICATIVE OF FUTURE RESULTS.