TSX jumps amid Fed rate cut hopes, ongoing U.S. government shutdown

The E-mini S&P 500 futures are trading at 6458.75, registering a modest gain of +0.52% as of the latest session. The intraday structure revealed a high at 6523 and a low at 6371.75, marking a clear test of the Buy 1 daily support (6367) before rebounding back above equilibrium levels. This bounce highlights the strength of the mean reversion principle embedded within the VC PMI framework.
From a weekly perspective, the VC PMI levels frame the battlefield:
- Sell 2 Weekly: 6696
- Sell 1 Weekly: 6584
- Mean Weekly (equilibrium): 6412
- Buy 1 Weekly: 6300
- Buy 2 Weekly: 6128
On the daily scale, equilibrium sits at 6429, with Sell 1 resistance at 6488 and Sell 2 at 6550. The intraday rebound has already carried price above the mean, signaling that the market is attempting to shift from a defensive stance toward a neutral-to-bullish bias. The test and rejection of the 6371 low, in proximity to the daily Buy 1, has validated demand and reinforced that downside support remains intact.
Momentum analysis through the MACD (14,3,3) remains in negative territory, with the line at -5.26 against the signal at -4.59. However, the narrowing spread and flattening histogram indicate a waning of bearish momentum. Should the MACD cross upward in coming sessions, it would likely confirm the continuation of the mean-reversion rally toward Sell 1 and Sell 2 resistance zones.
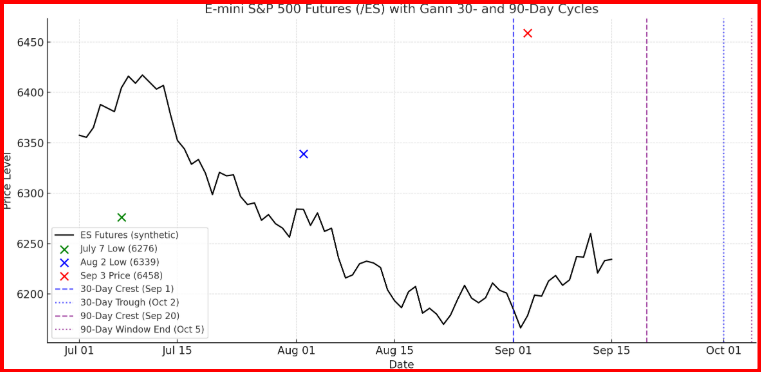
From a Gann cycle perspective, the market is operating within two key windows. The 30-day cycle, anchored from the August 2, 2025 pivot low at 6339, projected a crest into early September, precisely aligning with this week’s bounce attempt. This suggests the market may be transitioning into a short-term topping process, with the next 30-day trough projected around October 3–5, 2025. Meanwhile, the 90-day quarterly cycle, measured from the July 7 pivot low at 6276, points to a more significant crest in the September 20–25 window, reinforcing the idea of a corrective high forming later this month.
Taken together, the convergence of the VC PMI equilibrium levels with these Gann cycle dates signals a time/price alignment—a powerful confirmation that the market is approaching a period of heightened volatility and potential inflection.
Key Levels and Outlook
- Upside path: Above 6429, targets 6488 → 6550, with weekly extensions toward 6584–6696.
- Downside risk: Below 6367 exposes 6300, and further weakness could test 6128.
- Cycle window: Expect a corrective trough into early October, with September 20–25 as a potential pivot crest.
The market is in a mean-reversion rally phase, with near-term upside potential but medium-term caution as Gann cycles signal an impending correction.
***
TRADING DERIVATIVES, FINANCIAL INSTRUMENTS AND PRECIOUS METALS INVOLVES SIGNIFICANT RISK OF LOSS AND IS NOT SUITABLE FOR EVERYONE. PAST PERFORMANCE IS NOT NECESSARILY INDICATIVE OF FUTURE RESULTS.