Street Calls of the Week
This post was written exclusively for Investing.com
Energy stocks, as measured by the Select Sector SPDR ETF (NYSE:XLE), have performed horribly in 2019. The ETF has risen by just 6% this year, compared to an S&P 500 that has jumped by more than 26%. However, that poor performance may be about to change, with the ETF set to climb by as much as 13.5% in the months and weeks ahead.
The group could see a benefit from a weaker U.S. dollar and rising oil prices in the future. Additionally, the sector's two largest companies Exxon Mobil Corp (NYSE:XOM) and Chevron Corp (NYSE:CVX), may also be overdue for a rebound.
Energy ETF
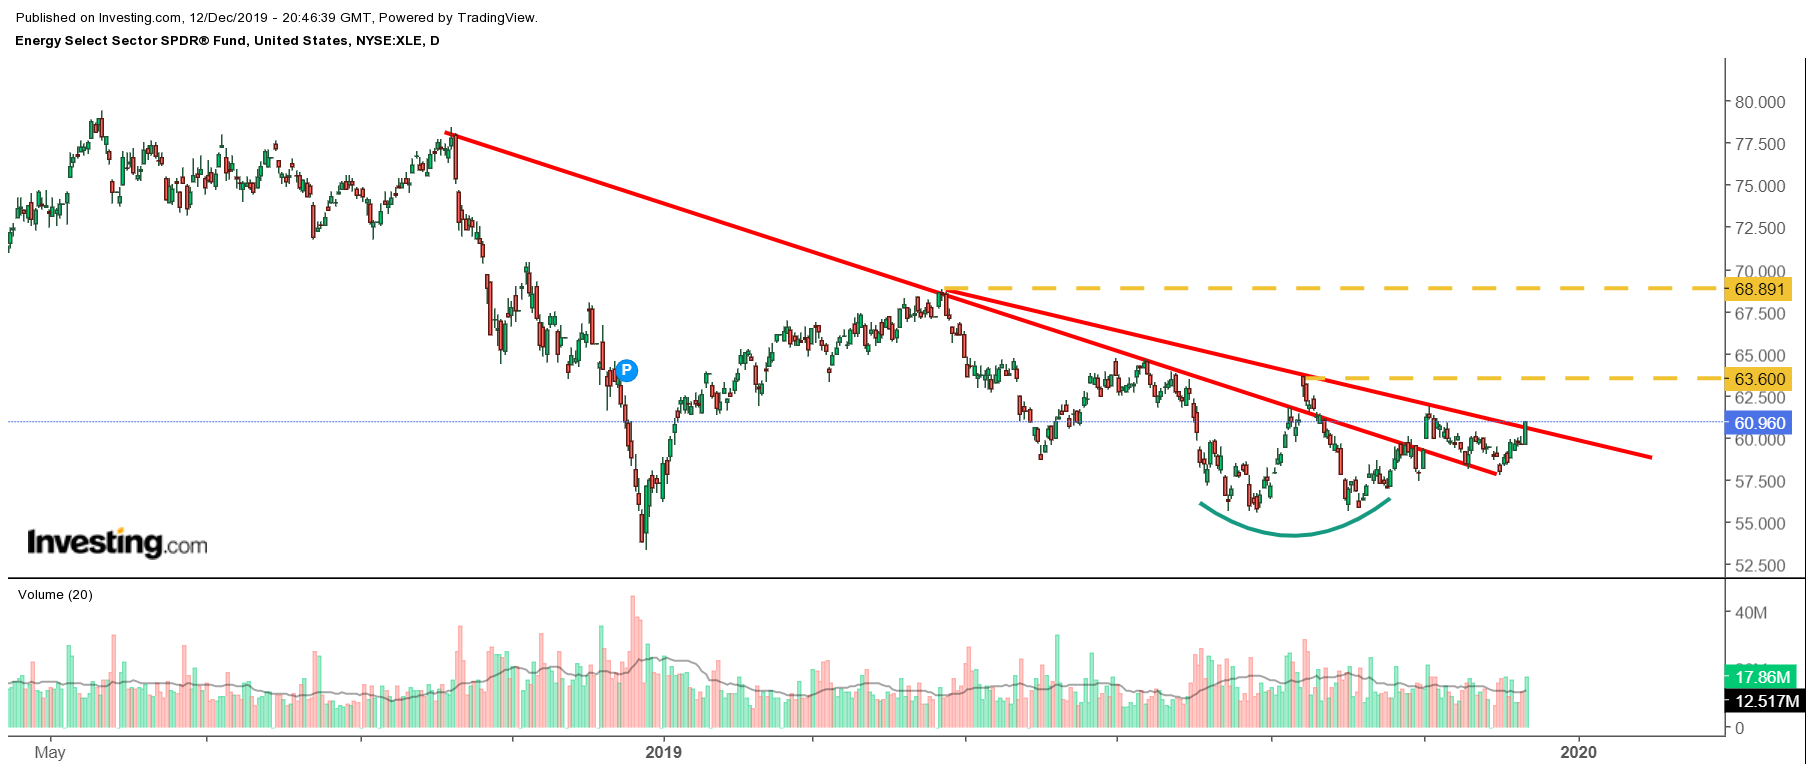
The Energy ETF has recently risen above two technical downtrends that have been in place. The first downtrend started in November 2018, while the second downtrend began in April 2019. Now, the ETF is starting to trend higher, and should it rise above a level of technical resistance at $63.60, it could surge to as high as $68.90. It would amount to a gain of about 13.4%.
That’s not all, because it appears the ETF may have also formed a bullish reversal pattern, known as a double bottom. The stock formed this pattern during a period between August and October 2019. It too would suggest that the XLE moves higher.
Additionally, the trend for the relative strength index has changed in direction as well. The RSI has been consistently trending higher since December 2018, making a series of higher lows, despite the ETF testing and retesting previous lows. This positive trend higher is known as a bullish divergence, and it would suggest that the ETF rises over the longer-term.

The Dollar
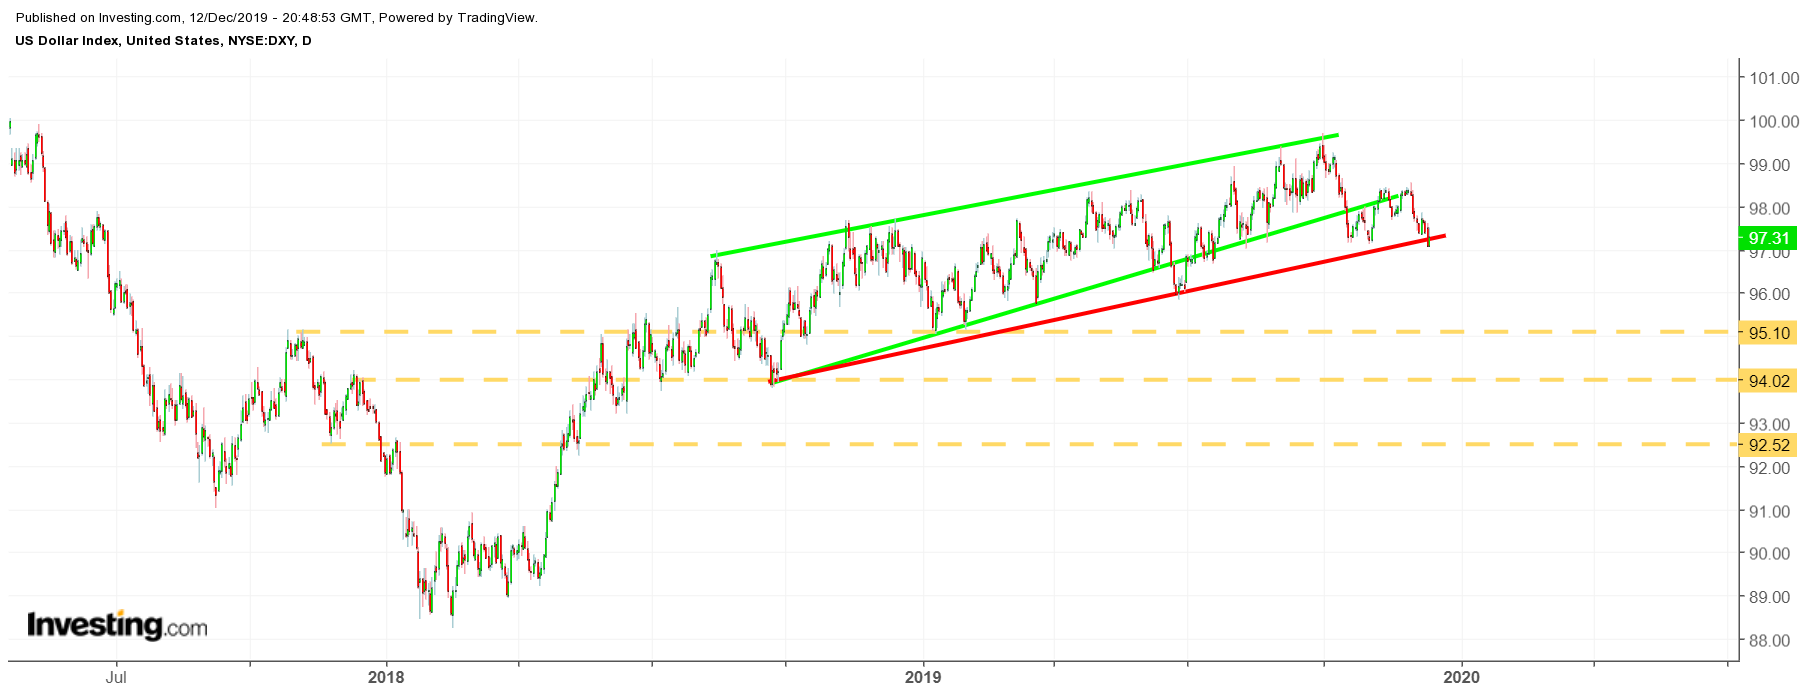
One reason why the ETF may be moving higher is that the U.S. dollar has recently shown signs of weakening. The dollar index, which measures a basket of currencies against the dollar, has fallen below a critical uptrend which started in September 2018 and peaked around 99.70 in early October 2019. Now the dollar index is falling below an uptrend around a level of 97.50 and is at risk of falling to 95.10, as previously noted. Should the dollar weaken, it could help to boost the price of oil, which is signaling its bullish trends of its own recently.

Exxon Mobil
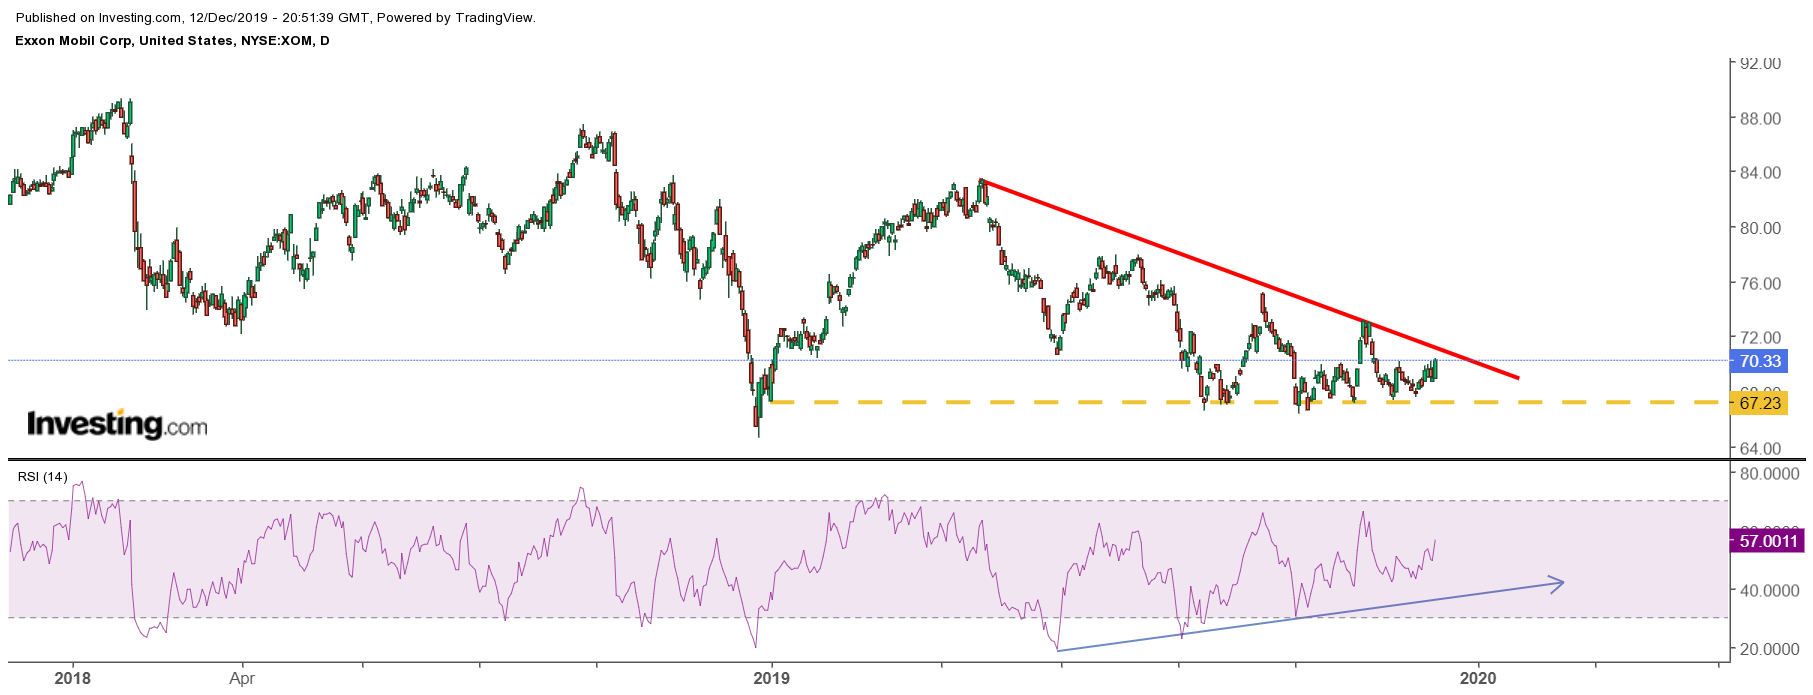
Also, exhibiting positive trends is Exxon, which has a weighting in the Energy ETF of approximately 22%. The stock has also had a horrible 2019, with the shares rising by roughly 3%. But the equity appears to have put in a firm bottom around a price of $67, as it has tested that level of support on several occasions since August. Additionally, the RSI for Exxon is also starting to trend higher and showing signs of bullish momentum entering the shares.

Chevron
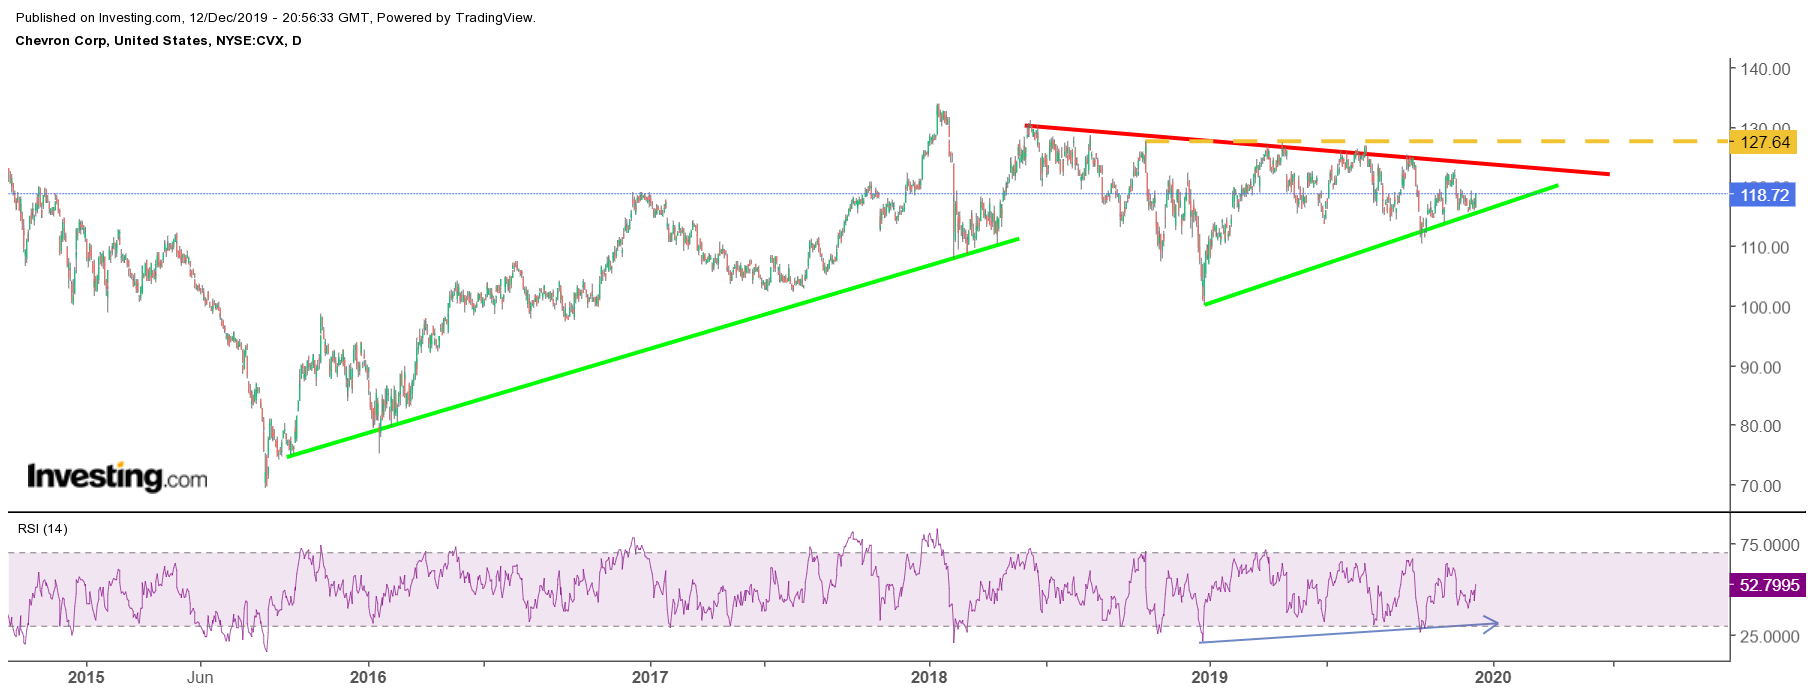
Chevron also has a significant weighting in the ETF, at around 21%. Like Exxon, Chevron has struggled in 2019, with its shares rising by about 9%. Chevron’s stock has been in a period of consolidation going back to early 2018. The chart appears to be forming a bullish continuation pattern known as a symmetrical triangle, suggesting shares rise in the future. However, for this to happen the stock would need to rise above the downtrend that formed starting in May 2018.

While the energy sector likely still has plenty of work to do in the coming weeks and months to go from a market laggard to a market leader. There are signs to suggest that perhaps the misery of 2019 may turn more favorable in 2020.
