Eos Energy stock falls after Fuzzy Panda issues short report
Gold markets are on edge after the Trump-Xi meeting in Busan. This report argues that President Trump’s unexpectedly dovish comments on China—saying "full-scale tariffs on China can’t last forever"—could undermine gold’s appeal as a safe haven and trigger selling. The diplomatic shift has set off a round of profit-taking and repositioning, and this analysis explores the resulting pressure on gold as well as potential investor moves.
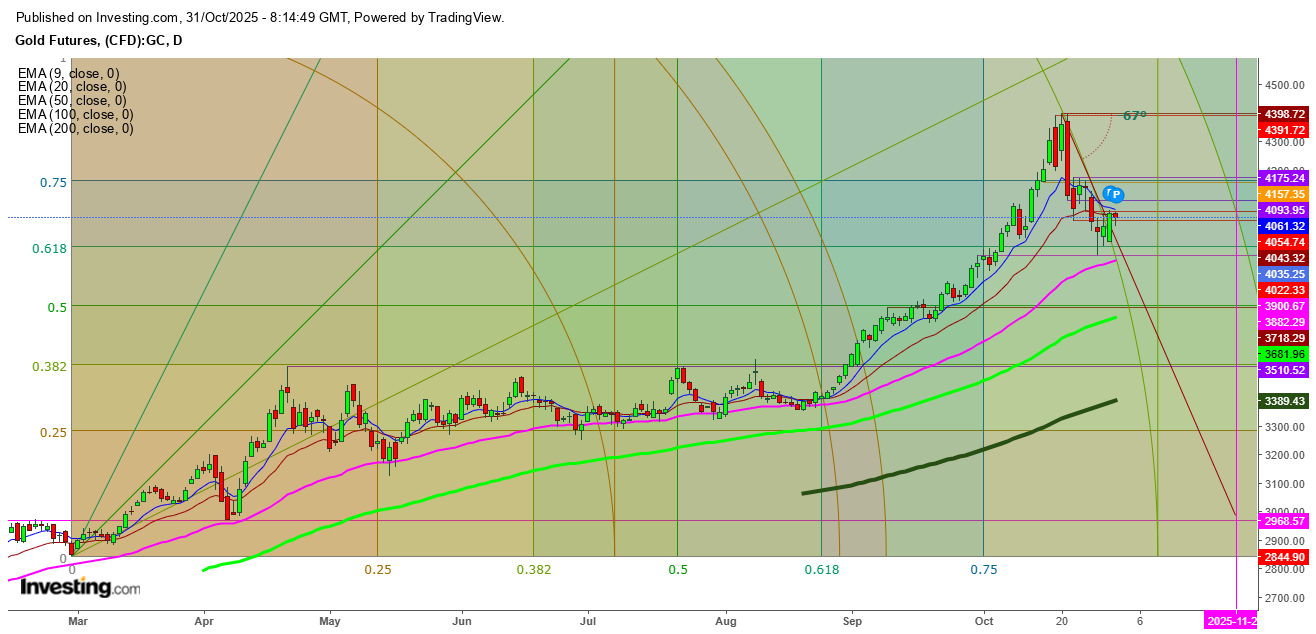
The summit provided few concrete solutions, but the key issue now is the changing stance of President Trump and its impact on gold prices. The prevailing selling pressure on gold futures suggests that investors are reacting to his new approach. With capital flowing toward other growth assets, gold has lost some of its safe-haven appeal since its sharp pull-back after reaching a record peak on Oct. 20, 2025, at $4398.72.
After sliding over 8% to $4023, one of its steepest corrections in years, while the US and China began to ease trade tensions, cooling demand for traditional safe-haven assets. I anticipate that the shifting money flow from gold will likely continue, as whenever gold peaks and profit-taking begins, investors often seek alternative hedges that combine scarcity with potential upside.
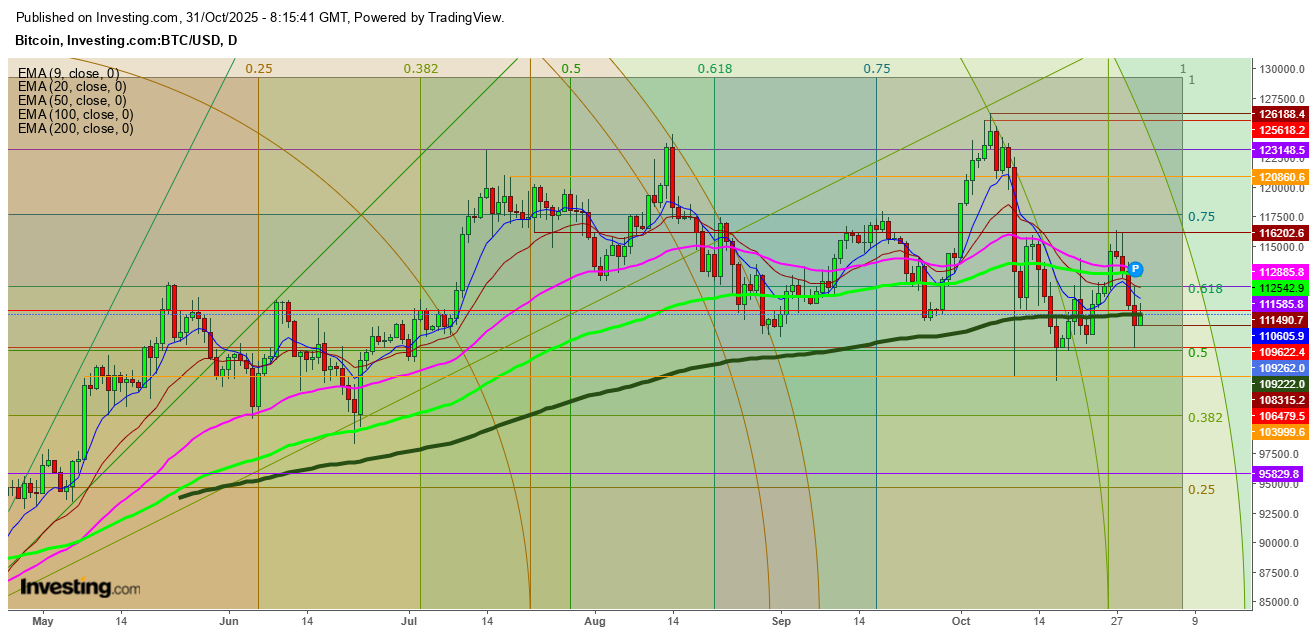
This time, Bitcoin stands front and center as investors begin seeking the next reliable store of value. Increasingly, that search leads to Bitcoin, often described as “digital gold.”

After reviewing the movements of the gold futures in different time chart patterns, I find that the exhaustion is likely to speed up if the gold futures find a breakdown below the significant support at the 50 DMA ($3882) before today’s closing or soon after next week’s opening.
Undoubtedly, investors await here for some more changing stances from US President Donald Trump, who intends to ease trade tariff policies, as the IMF initially cut the global growth outlook after Trump’s April barrage of trade tariffs, but has edged it back up as shocks and financial conditions have proved more benign than expected.
Technical Levels to Watch

In a daily chart, gold futures are constantly finding stiff resistance at the 20 DMA ($4042), despite a reversal seen on Thursday from the lows at $3949. I find that the gold futures could melt down if not able to sustain $3993 levels, where a breakdown could accelerate this slide to test the next support at $3931, and the next support at the 50 DMA ($3881).

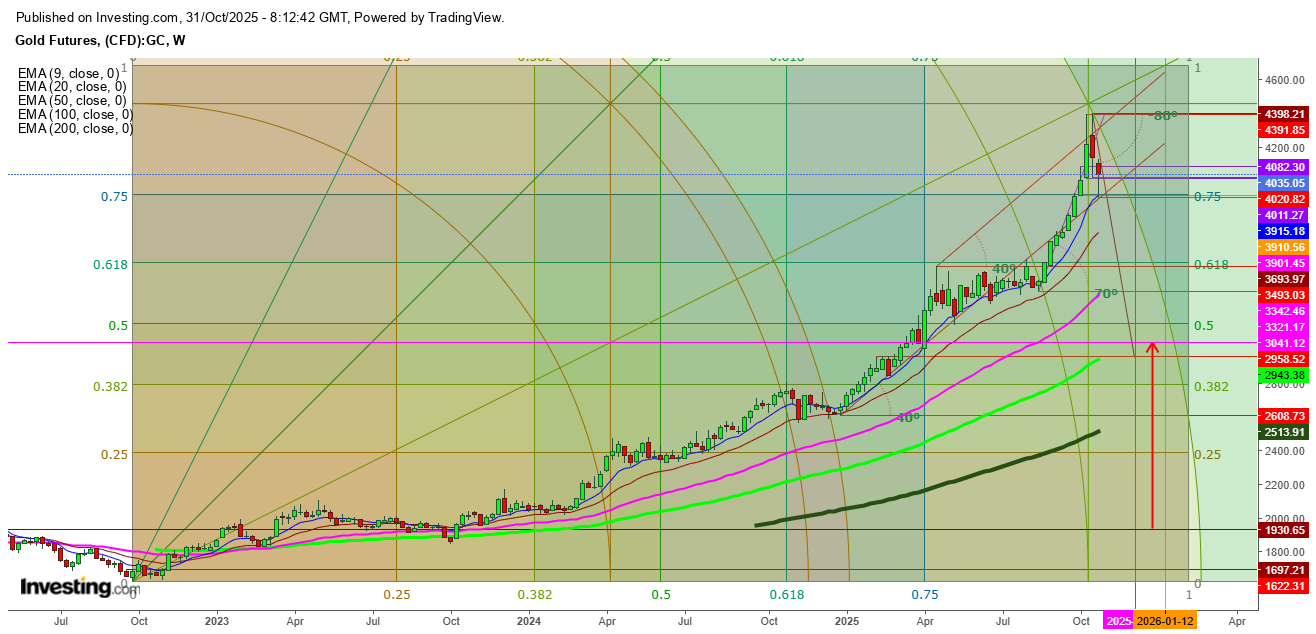
In a weekly chart, gold futures are just trying to hold above the immediate support at $4019 after testing this week’s high at $4123 and a low at $3901.66, indicating extreme bearish pressure at the current levels, where a breakdown could push the futures to test the significant support at the 9 DMA ($3914).
Disclaimer: Readers are advised to take any position in gold at their own risk, as this analysis is based only on observations.
