Nvidia and TSMC to unveil first domestic wafer for Blackwell chips, Axios reports
In a week marked by record-breaking highs, sudden reversals, and dramatic political shifts, gold has become the ultimate barometer of global uncertainty. As tensions between the U.S. and China flicker between escalation and relaxation, all eyes are on Tuesday—a day that could tip the scales for both markets and investors.
Will gold continue its wild ride, or is a decisive turning point finally at hand?
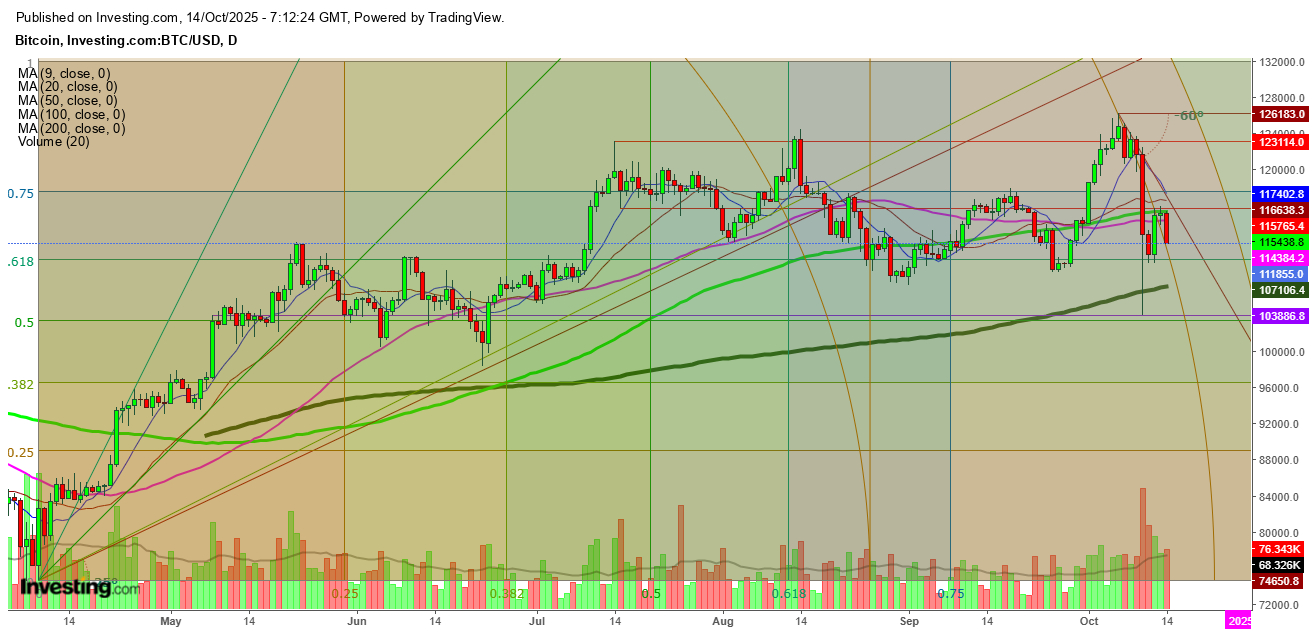
After reviewing the movements of the gold futures on different time charts, I anticipate that the gold futures have been constantly following Bitcoin’s moves over the last few weeks, amid growing volatility due to the changing stance of the U.S. President on China.
Tuesday, gold futures climbed to a new record high at $4190.67 before the advent of a selling spree that pushed the futures even below today’s opening level amid a changing stance by U.S. President Donald Trump.
The latest flare-up came after former U.S. President Donald Trump threatened to impose 10% tariffs on Chinese imports in response to Beijing’s curbs on exports of critical minerals used in electronics and defense.
Trump later tempered his stance, posting on social media that “Don’t worry about China” and that the U.S. was not seeking any harm to China, while Treasury Secretary Scott Bessent told Fox Business Network that a meeting between Trump and Chinese President Xi Jinping was still planned later this month in South Korea, signaling some hope for dialogue.
China’s Ministry of Commerce on Tuesday confirmed that working-level discussions with the U.S. are ongoing this week, while vowing to “fight till the end” against U.S. measures.
Undoubtedly, these mixed signals underscored the uncertainty fueled the gold rally, but the situation looks evident enough to head for resolving the trade relations between the U.S. and China this week.

On the other hand, I find that these developments have been equally affecting the movements of Bitcoin, and the gold’s move seems to be following the same path.
Technical Levels to Watch

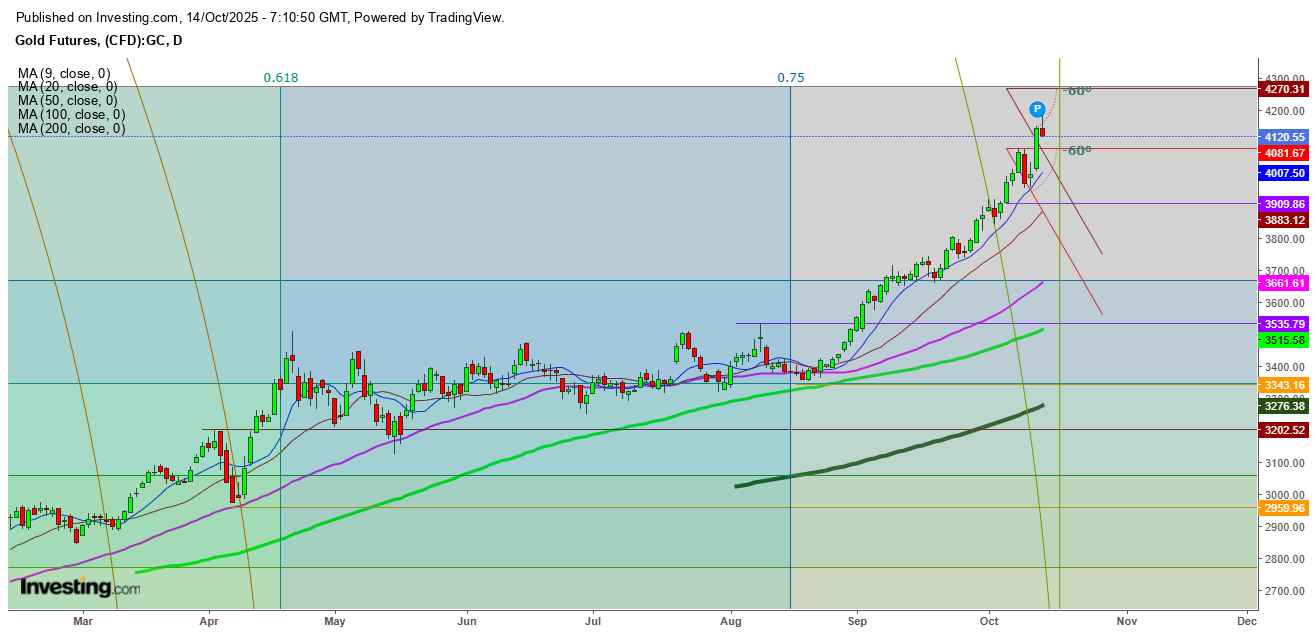
In a daily chart, gold futures have formed a bearish candle after opening at $4145.90, testing a high at $4190.67, and are currently trading at $4127. This move indicates a surge in the quantum of selling pressure above $4141.
I anticipate that if the gold futures find a breakdown below the immediate support at $4081.67, a sustainable move below this support could push the futures to test the next support at the 9 DMA at $4008 this week.
Inversely, if the gold futures try to move upward, and try to cross the immediate resistance at today’s high at $4190, big bears could load fresh shorts with a stop loss at $4270 for a target at $3883 this week, as the fall could be steeper than this steep upward move on Monday and Tuesday.

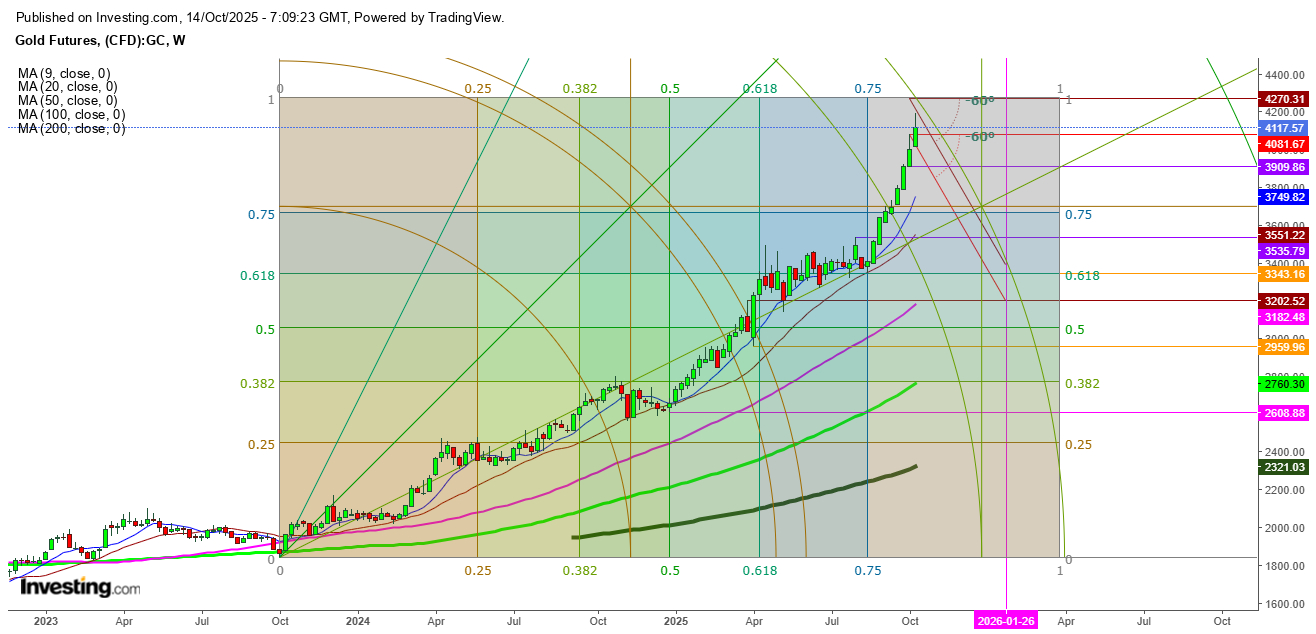
In a weekly chart, exhaustion can be clearly seen as the gold futures look ready to find a breakdown below the immediate support at $4081.67, where last week’s candle found stiff resistance.
I anticipate that the gold futures have tested the resistance exactly as I pointed out in a weekly chart, and a sustainable move below the significant support at $4081.67 could keep the down trend intact in a 60-degree fall from the current level, where a breakdown below the next significant support at $3909 could be tested during the upcoming week.
Disclaimer: Readers are advised to take any position in gold at their own risk, as this analysis is based only on observations.
