Here’s why Citi says crypto prices have been weak recently
This post was written exclusively for Investing.com
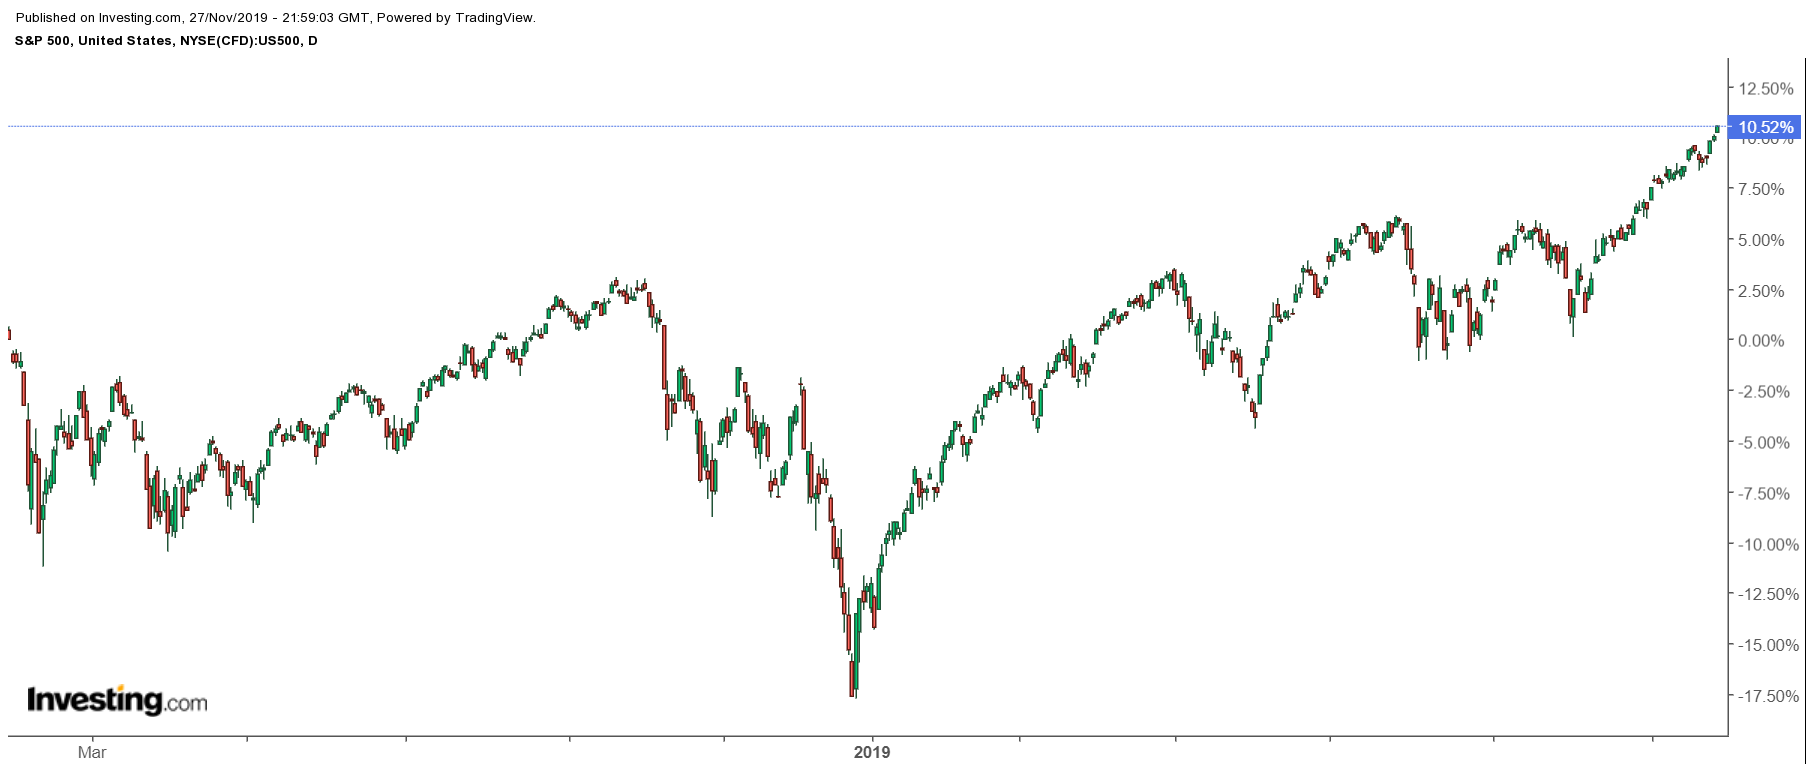
The S&P 500 is having a year-end run-up, and now history may be about to repeat itself. As previously noted on Oct. 18, the S&P 500 was setting up for a massive break out. Now that break out has happened, and if the technical chart proves to be correct, the index could be on a course that sends it to around 3,600 over the next two years. It could amount to a gain of about 15% from its current level of 3,153.6 on Nov. 29.
Earnings growth alone may get us halfway there in 2020. S&P Dow Jones estimates that earnings will climb by roughly 11.4% in 2020. Meanwhile, the S&P 500 could see some further multiple expansion throughout the course of the year, resulting in the index reaching around 3,360 in 2020, a gain of about 7%.

Is History Repeating Itself?
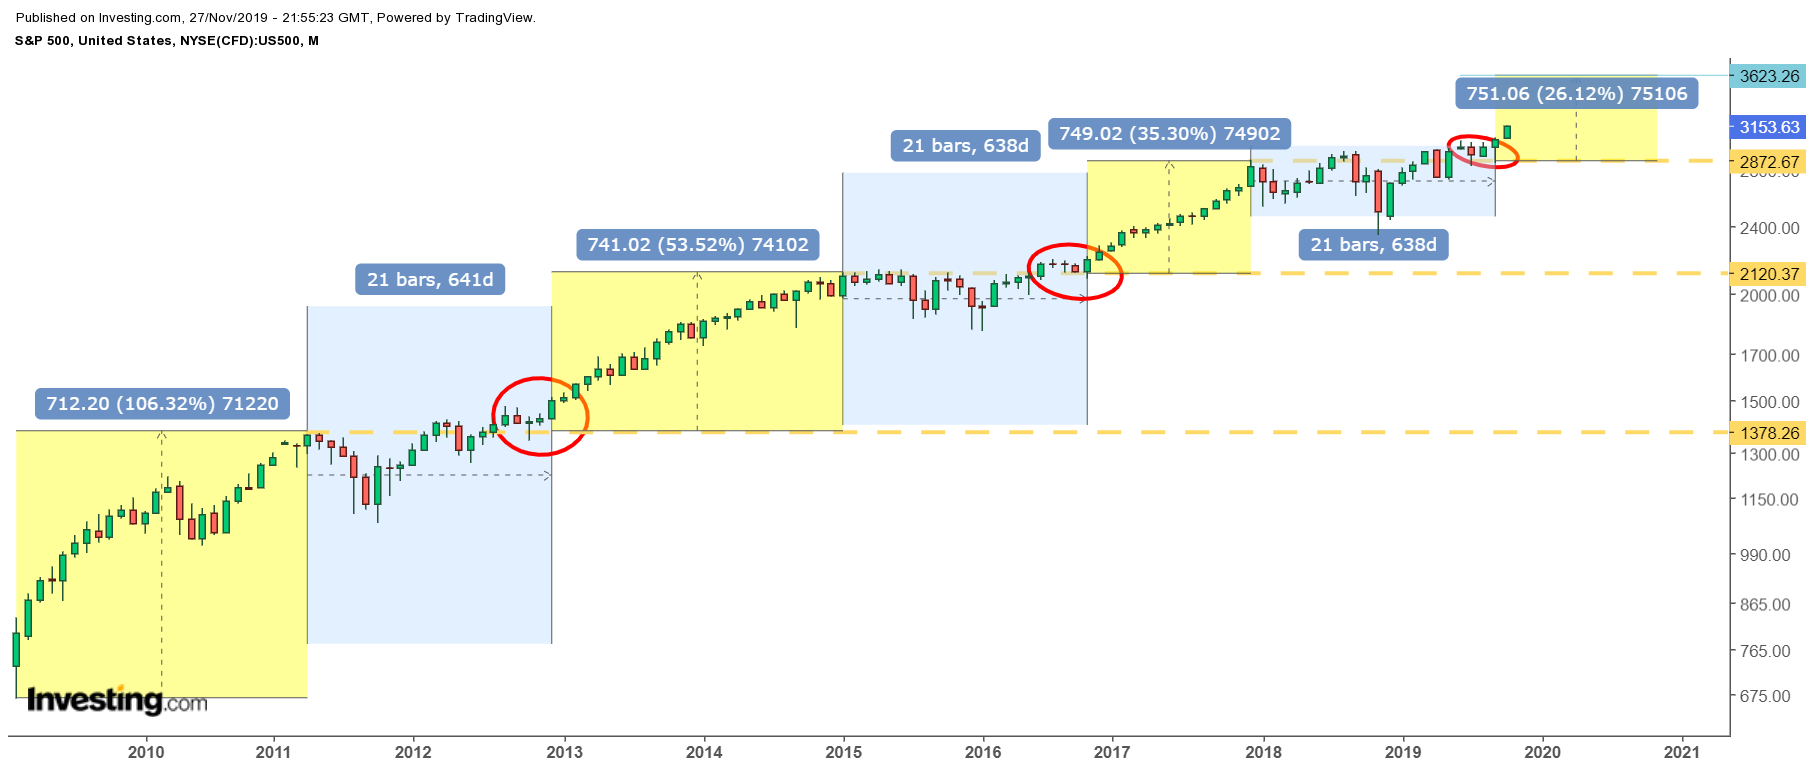
The technical chart shows that the index has now broken free of the 22 months of consolidation mentioned in the mid-October article. The breakout is occurring along the same time frame as the prior two breakouts in 2013 and 2016. If the pattern of the past projects forward, then the S&P 500 could be gearing up for a move higher of about 750 points off the breakout at 2,870 to around 3,620.
Since 2009, the S&P 500 has had three significant moves higher. The move from 2009 through 2011 accounted for the S&P 500 rising by roughly 710 points. That was followed by an increase of about 740 points from 2013 through 2015, and a gain of 750 points from 2016 through 2018. If that pattern continues then we may be in the very early stages of the S&P 500’s next advance higher.

Multiple Expansion
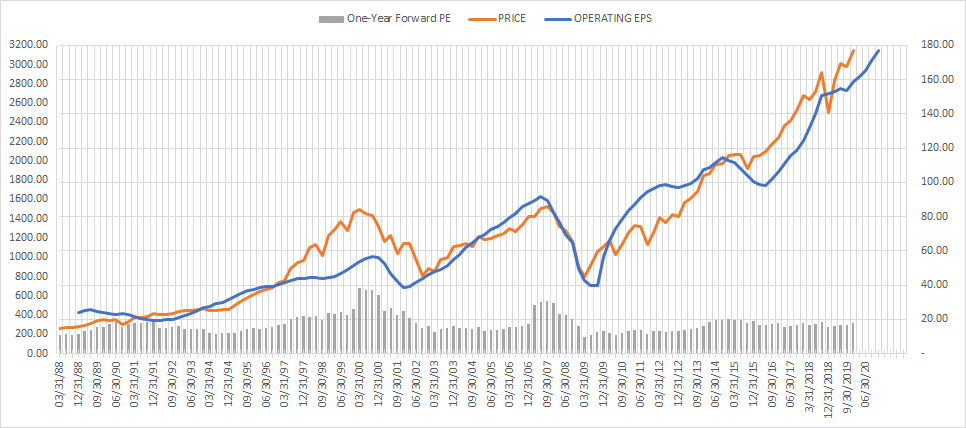
Multiple expansion and earnings growth may help to push the index higher over the course of the next year as well, pushing it into the middle of the technical chart’s projected range. Since 1988, using data from S&P Dow Jones, the S&P 500 has traded with a forward PE ratio of about 19. Today, the S&P 500 is trading at roughly 17.8 times 2020 earnings estimates.
Currently, S&P Dow Jones estimates that earnings will climb by 11.4% to $176.92 in 2020. Using those earnings estimates and a 2020 PE ratio of 19, the S&P 500 may rise by as much as an additional 7% in 2020 taking the index to around 3,360.
Back to The Fundamentals
It may seem crazy to think that the S&P 500 may be on a course that could send it higher by as much as 15% over the next two years. Especially, given that 2019 was a year filled with headlines about trade wars, slowing global growth, and a potential U.S. recession. However, the S&P 500 always reverts to earnings growth despite the headline du jour.
What seems to fluctuate is the multiple that investors are willing to pay for those earnings. Earnings growth ultimately drives multiple expansion during times of growth, while PE ratios contract during times of flat or negative growth.

(Data from S&P Dow Jones)
After a year that saw flat earnings growth and multiple contraction, the S&P 500 is on the cusp of a unique period. One where the market appears to be sending a deafening and compelling message that economic and earnings growth may be poised for a significant rebound in 2020. If that is the case, then we all may be about to go on one heck of a ride for the foreseeable future.
