SharkNinja shares soar 11% as third quarter results crush expectations

- Since early March, high lumber has tanked
- Stock market trending lower
- Weyerhaeuser has outperformed lumber, S&P 500 in 2022
- Levels to watch in WY shares
- If you’re interested in upgrading your search for new investing ideas, check out InvestingPro+
Lumber is the critical construction material which trades on the U.S. futures market. Other industrial commodities, like copper and crude oil, trade within highly liquid markets with substantial daily volumes changing hands between buyers and sellers and significant open interest. Though lumber futures market has been around for decades, it has never built the critical mass necessary for its market to be liquid.
The lack of volume and open interest makes lumber highly volatile, as bids to buy disappear during bearish periods and offers to sell evaporate during rallies, leading to price gaps. Lumber futures is a benchmark and is not appropriate for traders or speculators without the ability to make or take delivery of the wood.
Weyerhaeuser (NYSE:WY) is a leading lumber producer, plus it owns one of the world’s most extensive portfolios of timberlands. WY opened for business in 1900 and continues to produce lumber in the U.S. and Canada on 11 million acres the company owns or leases.
Before 2018, the all-time high in lumber futures was the 1993 peak of $493.50 per 1,000 board feet. The price exploded higher and imploded lower from 2018 through 2022 and is currently in an implosive phase. Meanwhile, WY shares have outperformed both lumber and the overall stock market in 2022.
WY operates like a Real Estate Investment Trust (REIT) with a call option on lumber attached.
Since Early March, High Lumber Has Tanked
In early March, nearby lumber futures reached a lower high of $1,477.40 per 1,000 board feet. The all-time high occurred during May 2021 at $1,711.20.

Source: Barchart
The above chart shows the steady decline since the March 2022 high, with lumber futures losing more than half their value by early June when they probed below the $600 level. They are now hovering at their lowest price since November 2021.
Stock Market Trending Lower
The S&P 500 index is the most diversified stock market indicator.

Source: Barchart
It settled at 4,766.18 on Dec. 31, 2021. At the 4,121 level as of Monday's close, the index is 13.5% lower in 2022. The S&P 500 has mostly made lower highs and lower lows since the early Jan. 4,818.62 all-time high.
Weyerhaeuser Has Outperformed Lumber, S&P 500 In 2022
So far in 2022, Weyerhaeuser shares have done better than lumber and the leading stock market index.

Source: Barchart
The chart shows WY shares settled at $41.18 at the end of 2021. At $38.94 on June 6, the shares were 5.3% lower this year.
Earnings, Dividends Support WY Shares
At $38.94, WY’s market cap was at $28.99 billion. The stock trades an average of more than 4.735 million shares each day. WY pays its shareholders a $0.72 dividend, translating to a 1.85% yield.
Source: Yahoo Finance
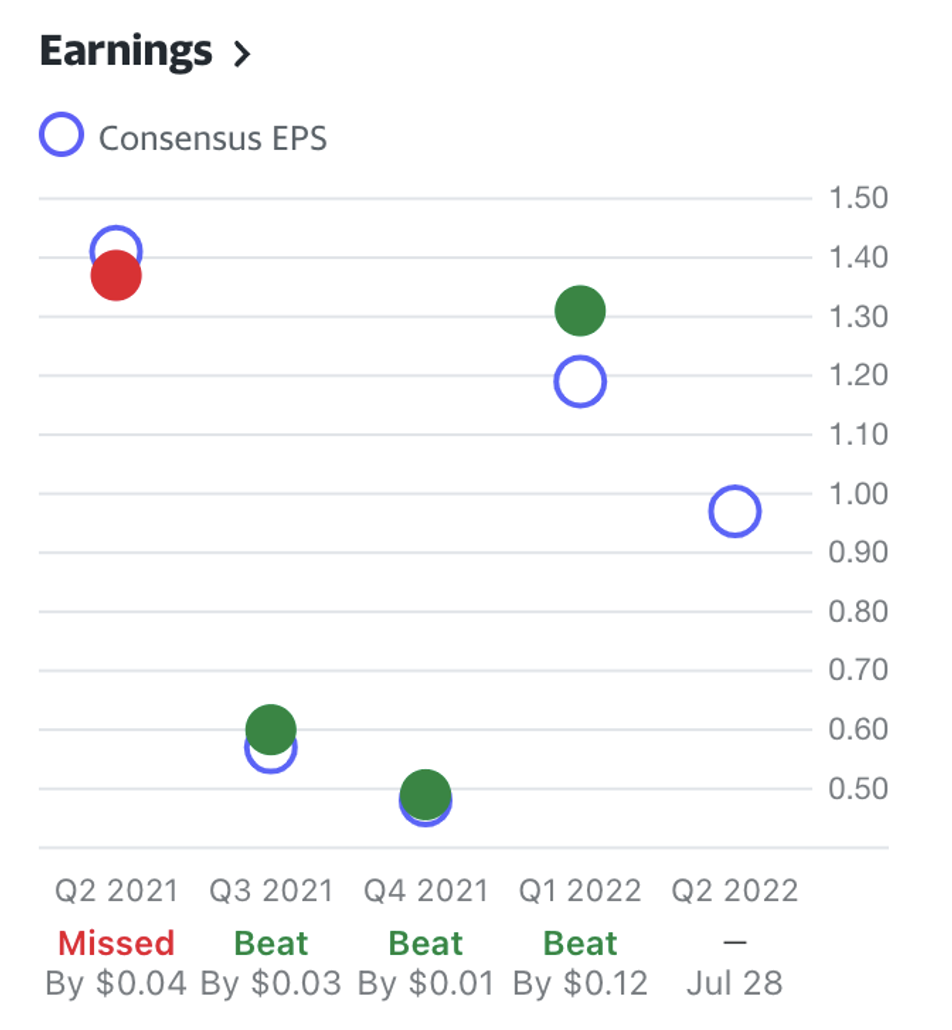
WY has beaten analysts’ earnings forecasts over the past three of four quarters. The company’s EPS in Q1 2022 was $1.31, and the market expects WY to earn $0.97 in Q2.

Source: Yahoo Finance
As the chart highlights, the trend in revenues and earnings is mostly higher.
A survey of nine analysts on Investing.com has an average of $45.22 per share 12-month price target for the stock, with forecasts ranging from $40 to $50.

Chart: Investing.com
At the $38.94 level, WY shares are below the bottom end of the expected range.
Levels To Watch In WY Shares
As one of the world's leading lumber producers, WY has more than 120 years of experience in the timber business. The stock has done better than lumber and the overall stock market in 2022, which is a sign of underlying strength in the business itself.
Moreover, WY is a profitable company, delivering dividends to its shareholders.

Source: Barchart
From a long-term perspective, the trend in WY shares has been bullish since the March 2020 low. WY has made higher highs over the past decade.
Above the February 2022 high of $43.04, the first technical resistance level stands at the $53.69 peak registered in April 2010. WY shares should find support around the $35 level.
Meanwhile, at around the $600 per 1,000 board feet level, lumber remains above the pre-2018 all-time high. Lumber futures should find support around the $500 level as the demand for new homes remains robust despite rising interest rates. Moreover, rebuilding the U.S. infrastructure will require lots of wood, which should keep a bid under the critical commodity for all construction projects.
Weyerhaeuser shares could continue to be a safe bet to hold in portfolios during any volatile period in the stock market.
***
Interested in finding your next great idea? InvestingPro+ gives you the chance to screen through 135K+ stocks to find the fastest growing or most undervalued stocks in the world, with professional data, tools, and insights. Learn More »