TSX jumps amid Fed rate cut hopes, ongoing U.S. government shutdown
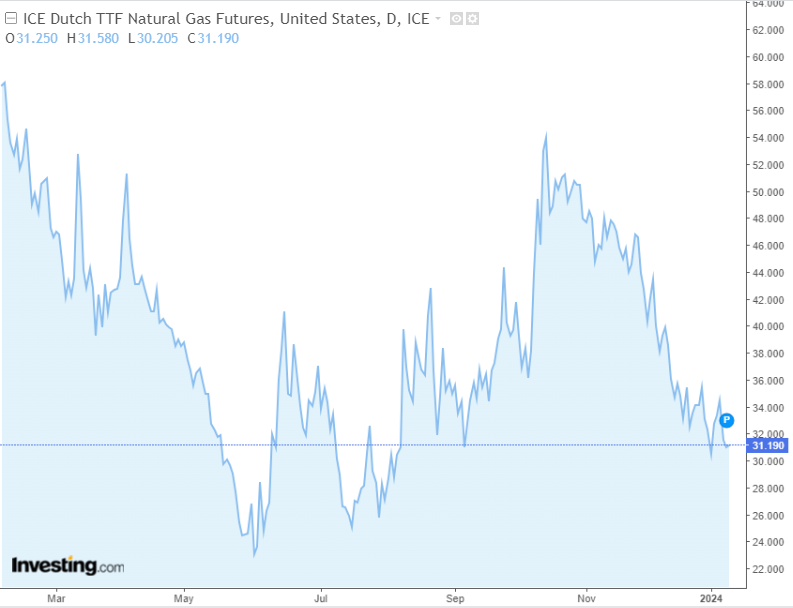
- Natural gas futures listed on Dutch hub TTF have continued a downward trend.
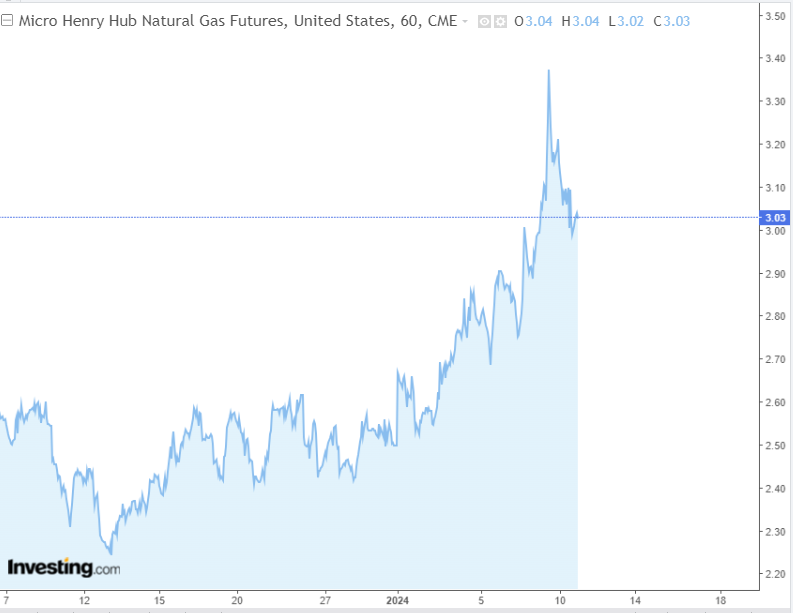
- But, prices in the US have been on the rise of late.
- Meanwhile, an International coalition has intervened in the Red Sea following supply disruption by Houthis.
- Looking to beat the market in 2024? Let our AI-powered ProPicks do the leg work for you, and never miss another bull market again. Learn More »
Recent days in northern Europe have been marked by an onslaught of winter with negative temperatures, leading to a rise in natural gas consumption.
Despite this, the Dutch TTF Natural Gas Futures bears are once again trying to break below the support at 30 euro per MMBtu with a good chance of going lower.
This down move could potentially open the way for an attack on last year's lows, which are in the range of 20 euro per MMBtu.
With the increasing attacks by the Yemeni armed group Huti on the Red Sea, there was a real threat of disruption to the supply chain leading through this route.
However, the intervention of the international coalition led by the US has relatively stabilized the situation and removed supply pressure.
The most likely scenario for the next few months is a continuation of declines, which could be disrupted mainly by political events such as the possible spillover of the Middle East conflict and Iran's involvement in hostilities.
Natural Gas Futures Continue to Rise in the US Regardless - Divergence Ahead?
Despite the declines in gas prices in Europe and Asia, in the United States we can observe a different direction when analyzing the pricing of the commodity based on Henry Hub contracts.
Over the past month, quotations have risen from $2.24 to more than $3 setting local maximums.

The reason for the recent increases is a combination of increased demand during the heating season along with a decline in inventories.
Analysts say inventories could reach 117 billion cubic feet in the first week of January, dropping to 3359 Bcf in underground storage.
In the longer term, supply pressures may subside because, despite declines in storage levels, inventories remain above the average of the past five years.
As a result of the shale revolution, the U.S. has become self-sufficient in terms of natural gas production while becoming an exporter of crude.
In Europe, U.S. supplies are already larger than those from Russia, which reduces the risk of supply chains being disrupted.
According to the Energy Institute, the U.S. will produce 978.6 bcm of natural gas (22.4% of global production) in 2022, with a demand of 881.2 bcm.
Traders are advised to keep an eye on the growing divergence between the two benchmarks. Fundamental factors, as described above, should drive the direction going forward - and they are currently bearish for gas.
Natural Gas-Related Stocks to Keep an Eye on
Looking for opportunities among companies that are related to the production and distribution of natural gas?
It is worth paying attention to Equinor (NYSE:EQNR) and BP (NYSE:BP), among others, for which the fair value ratio is at 35% and 29%, respectively.
Source: InvestingPro
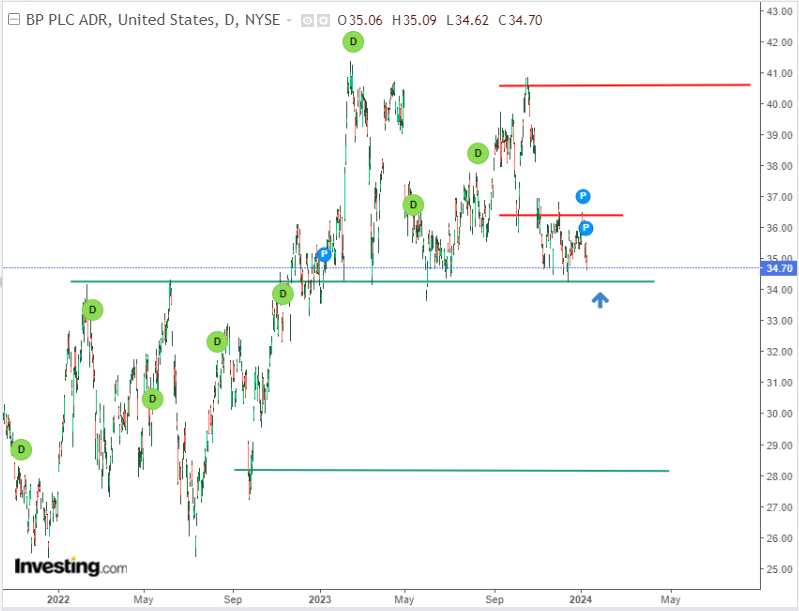
We can observe an interesting situation from the point of view of technical analysis on the BP chart, where the supply side seeks to retest the key support area located in the price area of $34 per share. 
This area is important due to the strength of the level, which has managed to repel sellers' attacks on several occasions over the past several months.
If a demand impulse reappears here, then we could witness a realization of fair value with the first target at $36.40 per share.
A strong signal will also be a breakout by the bears, which opens the way for an attack on the lows while negating the upward scenario.
***
In 2024, let hard decisions become easy with our AI-powered stock-picking tool.
Have you ever found yourself faced with the question: which stock should I buy next?
Luckily, this feeling is long gone for ProPicks users. Using state-of-the-art AI technology, ProPicks provides six market-beating stock-picking strategies, including the flagship "Tech Titans," which outperformed the market by 670% over the last decade.
Disclaimer: This article is written for informational purposes only; it does not constitute a solicitation, offer, advice, counseling or recommendation to invest as such it is not intended to incentivize the purchase of assets in any way. As a reminder, any type of asset is evaluated from multiple perspectives and is highly risky, and therefore, any investment decision and the associated risk remains with the investor.

