Costco stock price target raised to $1,218 by Goldman Sachs on strong results
- Indexes have tumbled recently amid rising market uncertainty
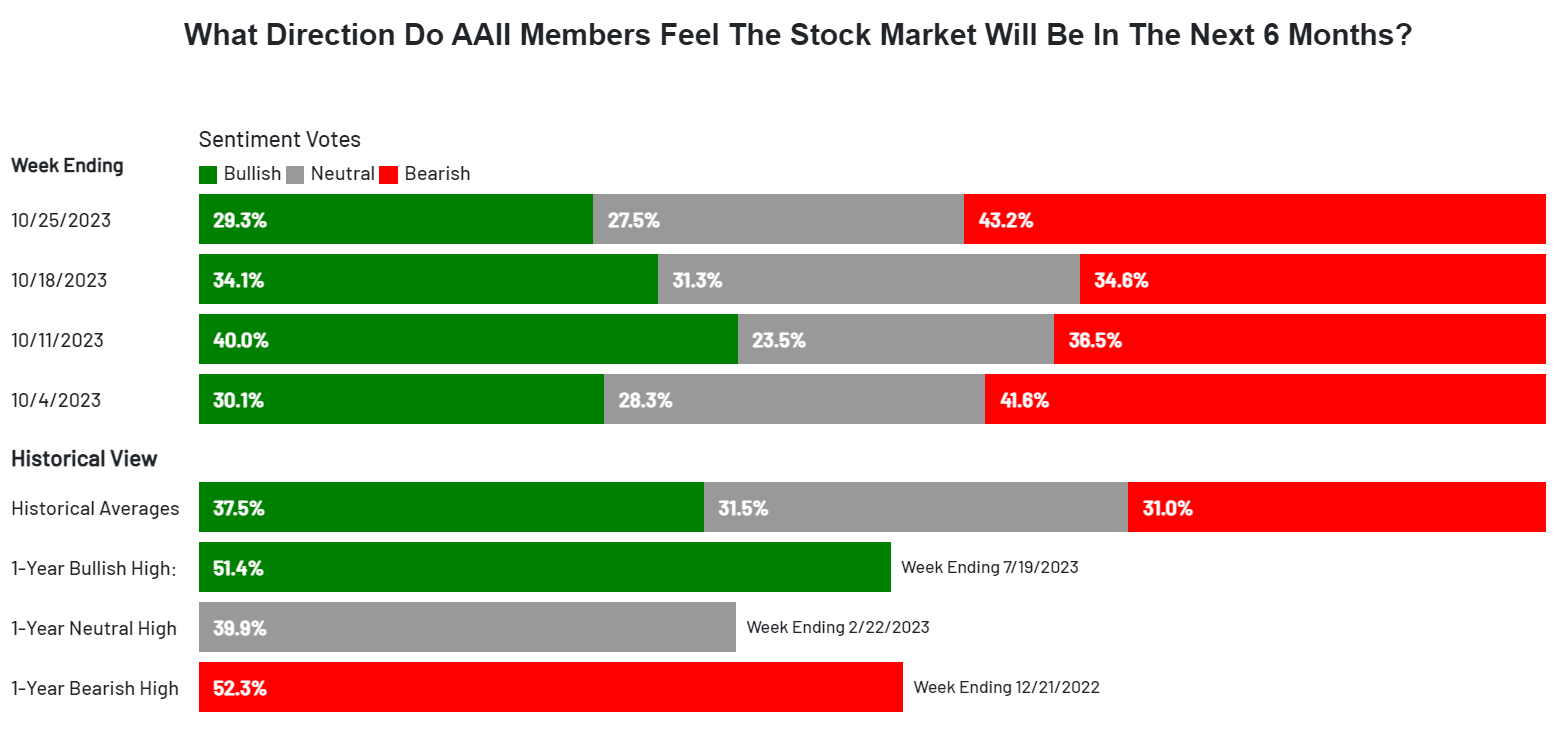
- Meanwhile, the latest AAII Investor Sentiment Survey has shown a decline in optimism within the S&P 500
- Notably, the psychologically important level around 4150-4135 is a crucial support area that must hold
Persistent worries regarding war, inflation, the possibility of a recession, and fluctuating interest rates have cast a pall of uncertainty over the market.
The most recent AAII Investor Sentiment Survey, a contrarian indicator, paints a picture of declining bullish sentiment within the S&P 500. Only 29.3% of respondents expressed bullish sentiment this week, a notable decline from the 34.1% reported in the previous week.
This downtrend aligns with the recent decline that brought prices back to levels last seen in April 2022.
Notably, the range of 4150 to 4135 carries significant psychological weight, forming a fundamental level that has proven to be formidable resistance in the past, making it a critical threshold not to be breached.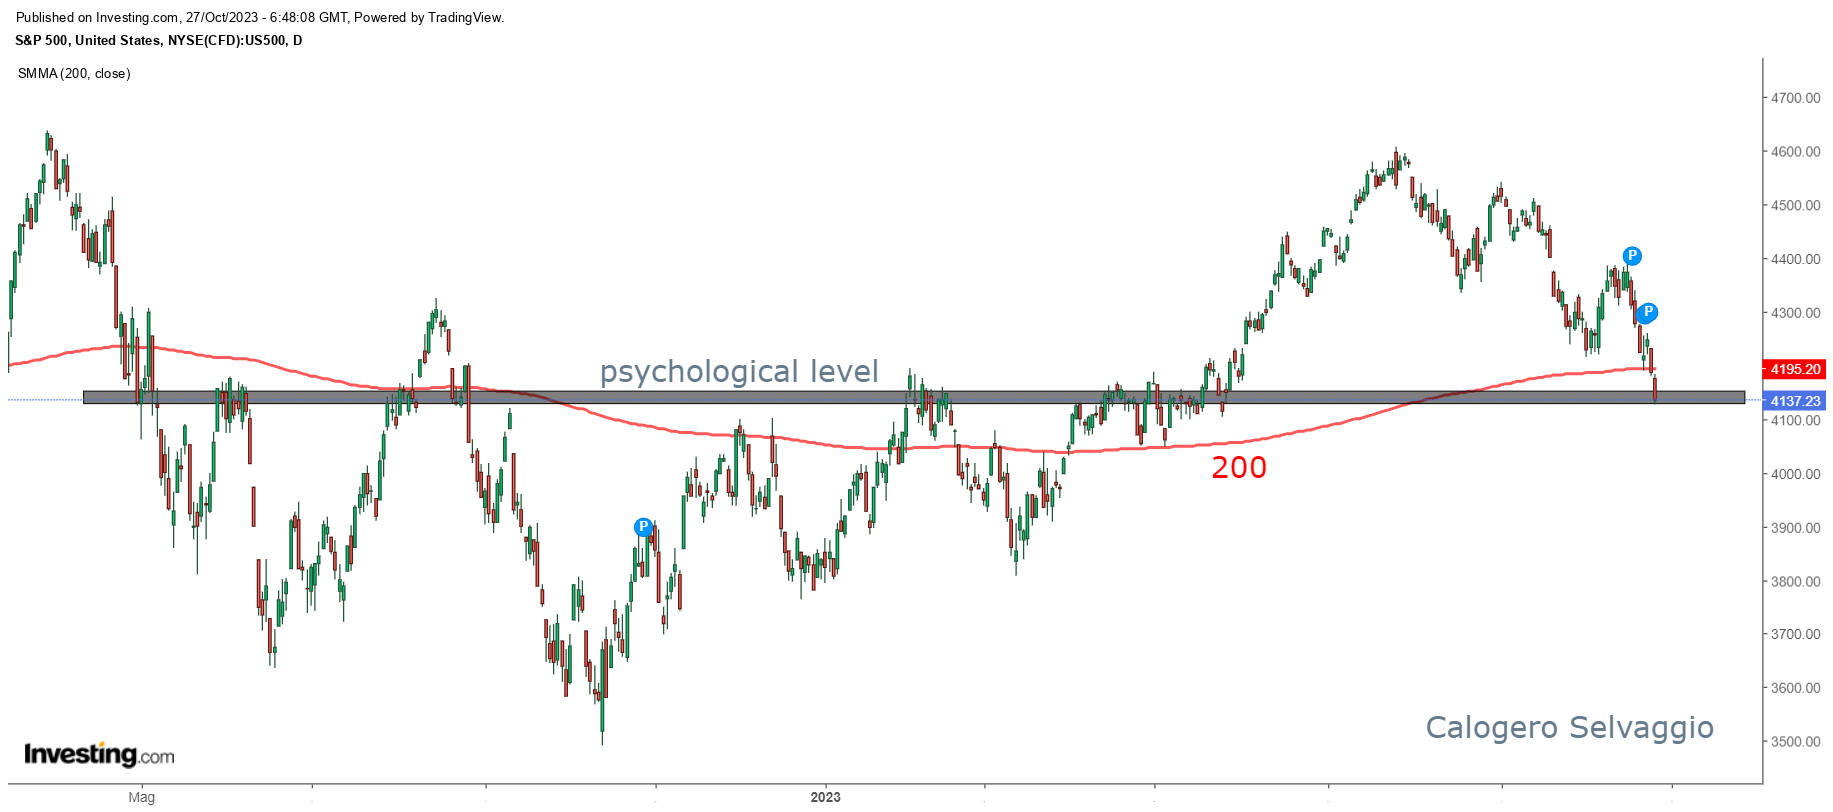 While sentiment appears decidedly pessimistic, it's worth noting that the last week of September saw an even lower level of bullish sentiment, with only 27.8% expressing positivity.
During that period, the index experienced a decrease of approximately 1%. 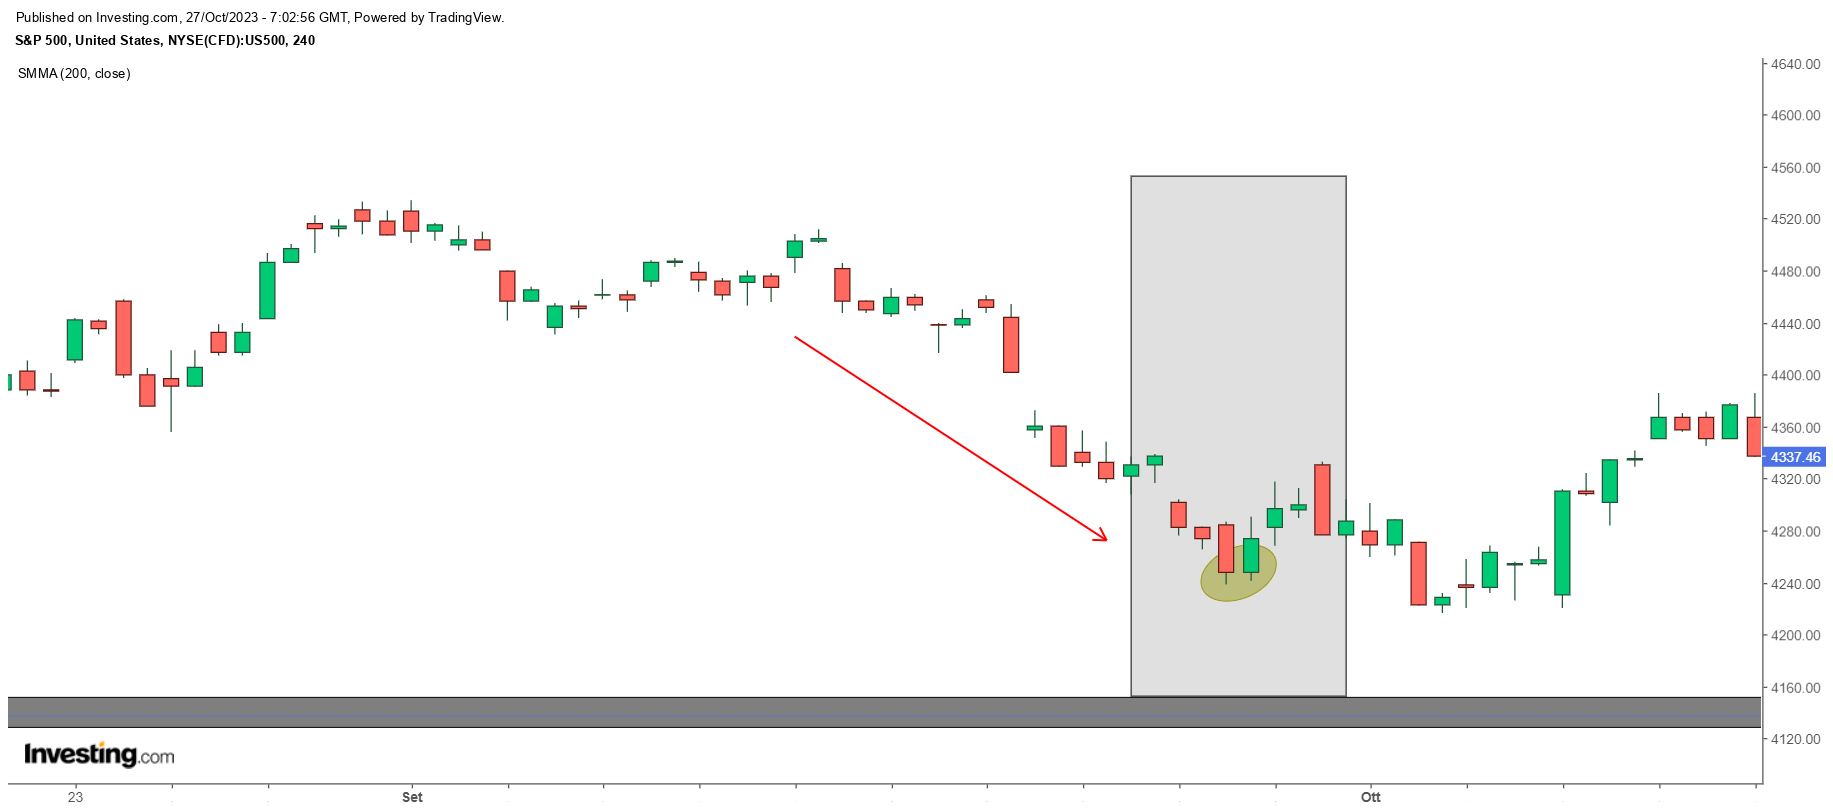 Bearish sentiment, on the other hand, increased to 43.2%, marking the highest level since May 2023, with a weekly growth of 8.6%. This recent surge represents the most significant increase in a single week since February 2023.
The AAII survey indicates a pronounced shift in sentiment. When compared to the NAAIM index, which mirrors fund managers' equity exposure, this shift is even more notable.
The NAAIM index has dipped below its March 2022 level and is regressing to the levels observed in October 2022.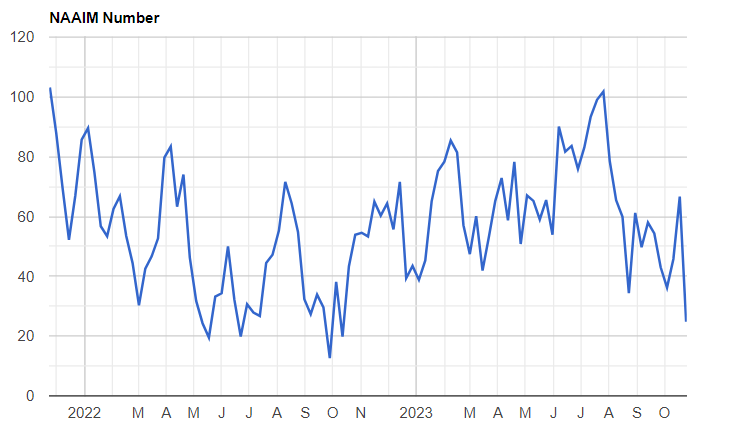
The NAAIM exposure index is not predictive in nature, but the main objective is to provide information on the actual adjustments, as far as the stock market is concerned, made by active risk managers to client accounts over the past two weeks.
Here is the general sentiment:
The indexes in fact have begun a significant retracement. But declines create opportunities. Looking graphically at "the magnificent 7" they are well off their highs with RSI (oversold) lows. 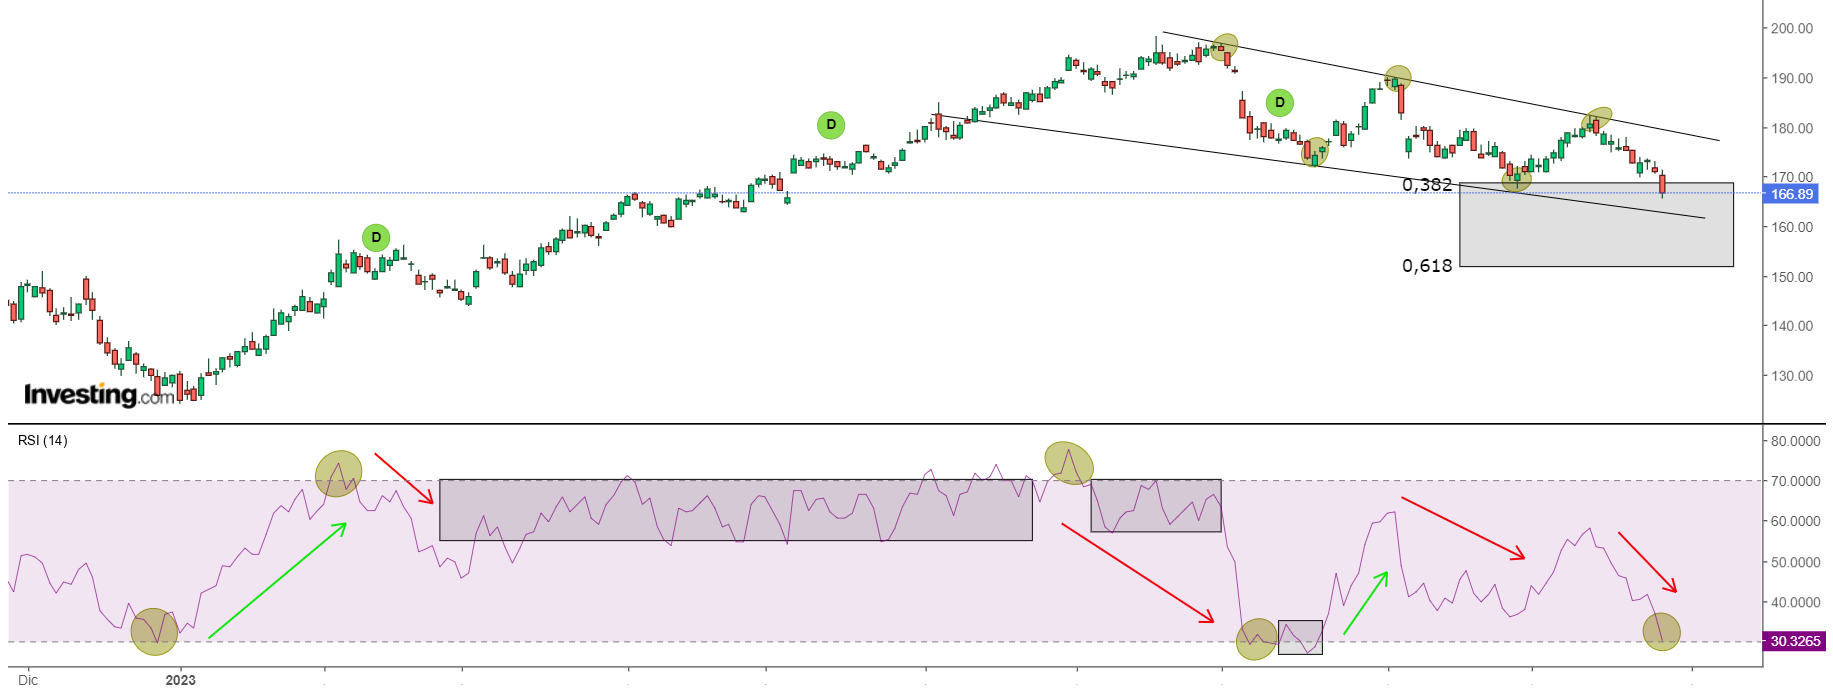
Taking Apple (NASDAQ:AAPL) as an example first, it is down more than 15% from its high, below the main 200 moving average, with RSI at its lows (oversold) and the creation of a descending channel that has entered the Fibonacci levels area of attention.
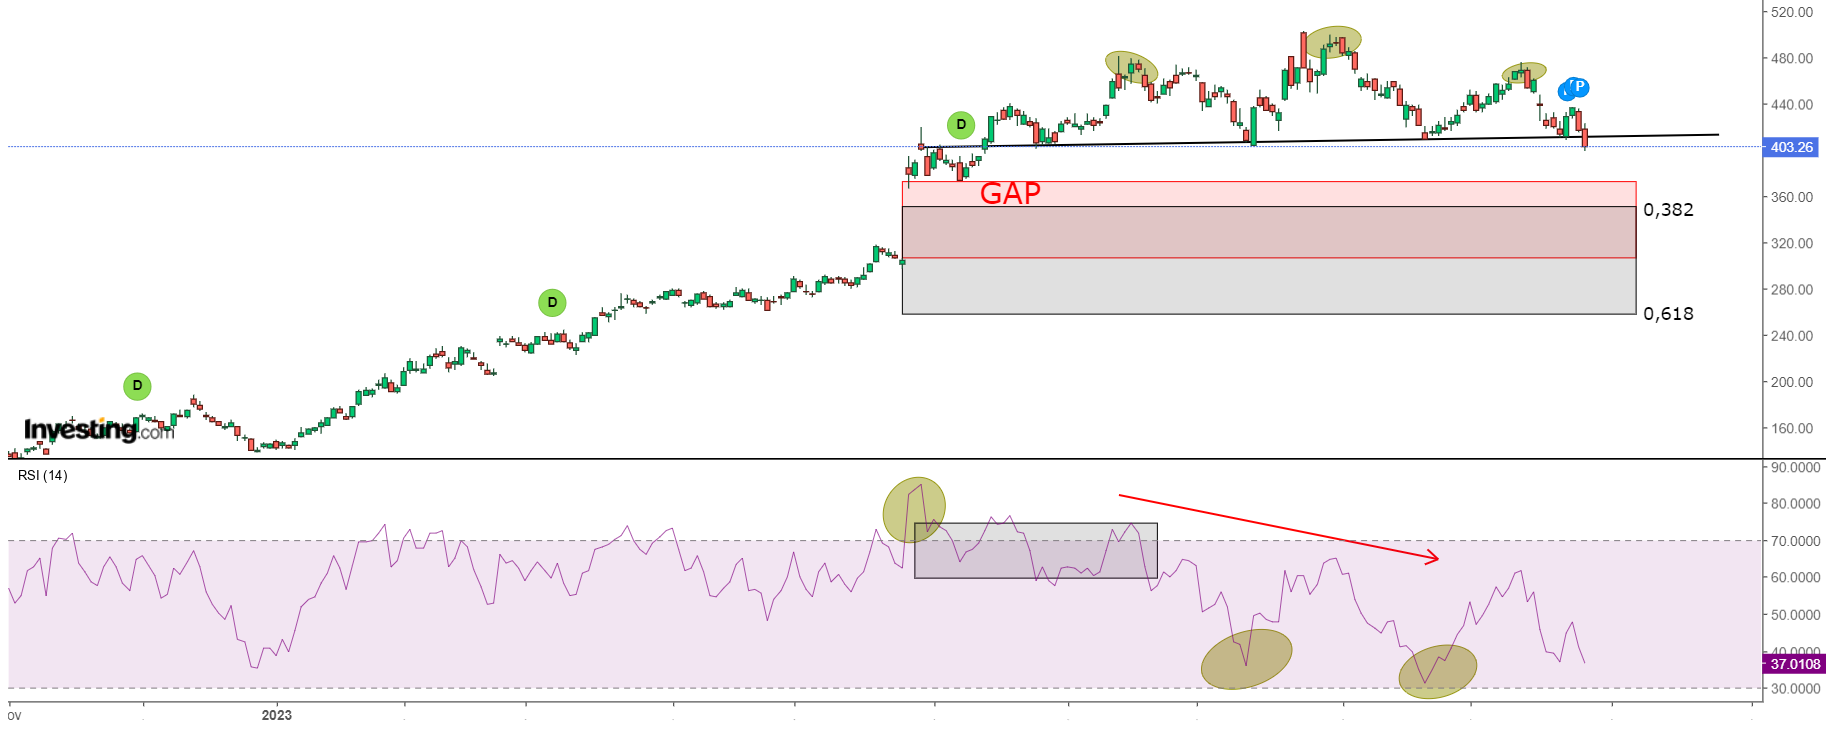
Nvidia (NASDAQ:NVDA) is down more than 18% from its high with a direct RSI at the lows (oversold) and the creation of a head and shoulders that if confirmed could return to close the gap created in May 2023 and enter the attention area of the Fibonacci levels.
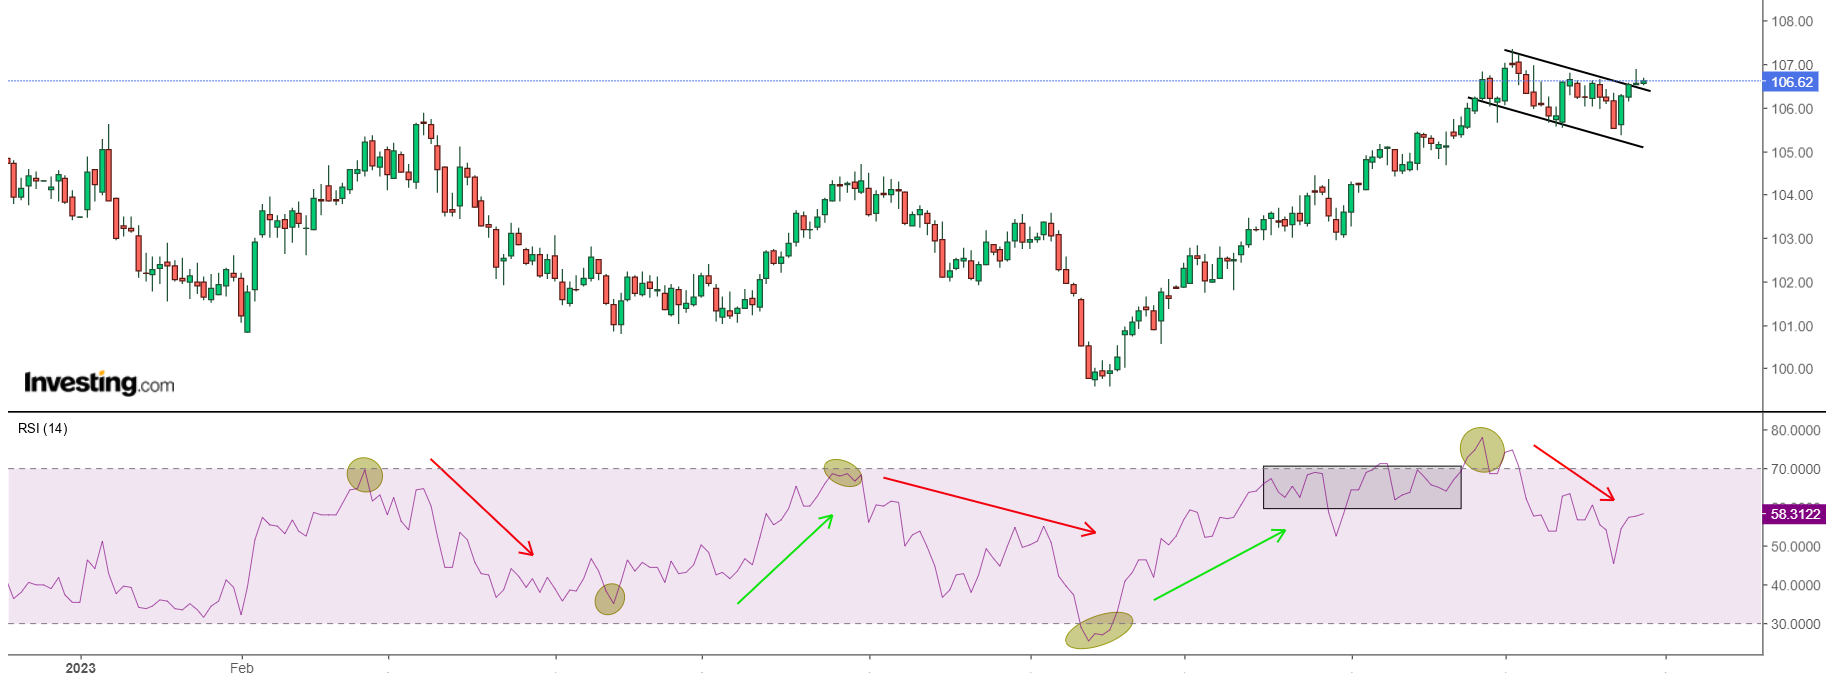
The US dollar has been trending positively since July, registering a performance of more than 7% with the last high on October 3.
As of today, it has formed a bullish flag pattern and there is a still high RSI level (above 50). This is not what many are hoping for, as it doesn't bode well for stocks.
Conclusion
Despite the growing bearish sentiment, declining equity exposure, and the strengthening US dollar, it's worth noting that historical trends often point to October as a month marked by market lows.
In light of this, there remains the possibility that current stock levels might serve as a foundation for a new upward trajectory.
***
Disclaimer: This article is written for informational purposes only; it does not constitute a solicitation, offer, advice, or recommendation to invest as such it is not intended to incentivize the purchase of assets in any way. I would like to remind you that any type of asset, is evaluated from multiple points of view and is highly risky and therefore, any investment decision and the associated risk remains with the investor.

