Esperion stock rises after Japan approves cholesterol drug NEXLETOL
Some of our best friends are permabears. They are smart economists and strategists who tend to be bearish. We look to them for a thorough analysis of what could go wrong for the economy and the stock market. They are very vocal and fuel lots of pessimism about the future among the financial press and the public.
In response, to provide some balance, we examine what could go right. Often, we find that the permabears have missed something in their analyses. Since they accentuate the negatives, they often fail to see the positives, or they put negative spins on what’s essentially positive.
We rarely have anything to add to the bearish case because the bears’ analyses tend to be so comprehensive. So our attempts to provide balance often cause us to accentuate the positives while still acknowledging the negatives. Not surprisingly, we get criticized for being too positive when it comes to the outlook for the US economy and stock market and get called “permabulls.”
That’s alright with us, since the US economy often grows at a solid pace, and the stock market has been on a bullish long-term uptrend as a result. Consider the following:
1. Recessions are infrequent and don’t last very long
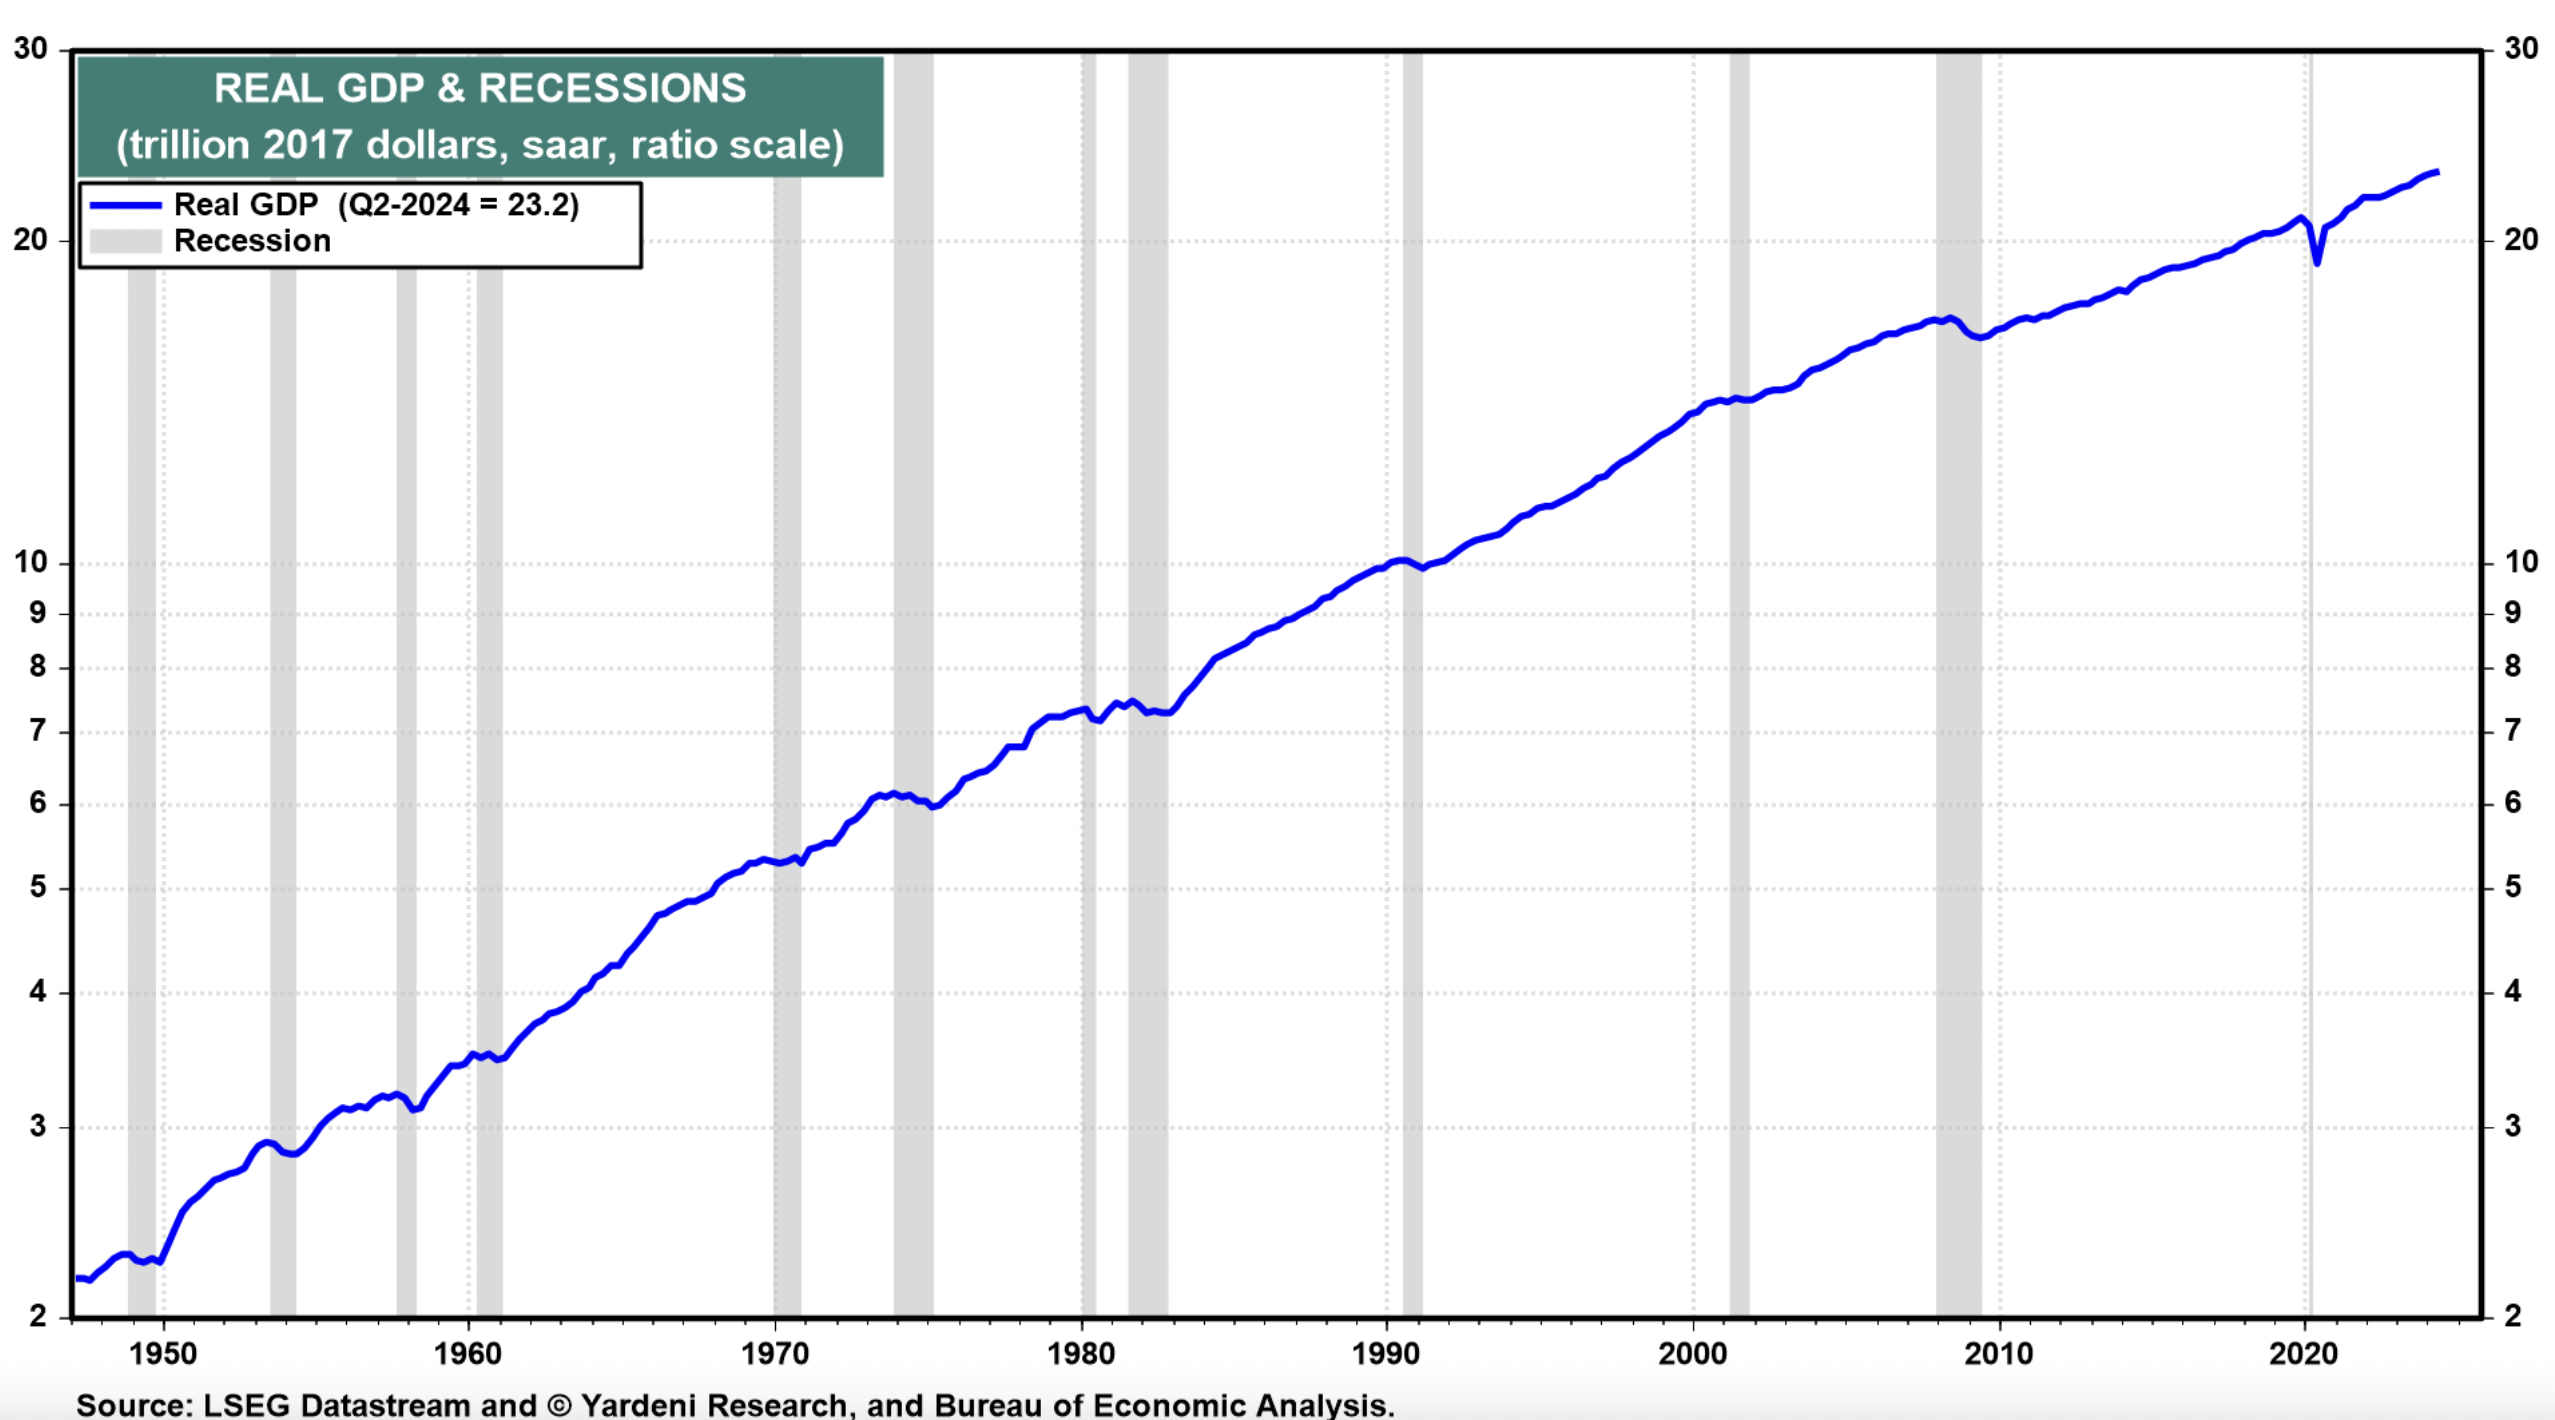
In the US, the National Bureau of Economic Research (NBER) is the authority that defines the starting and ending dates of recessions. According to the NBER, the average US recession over the period from 1854 to 2020 lasted about 17 months. 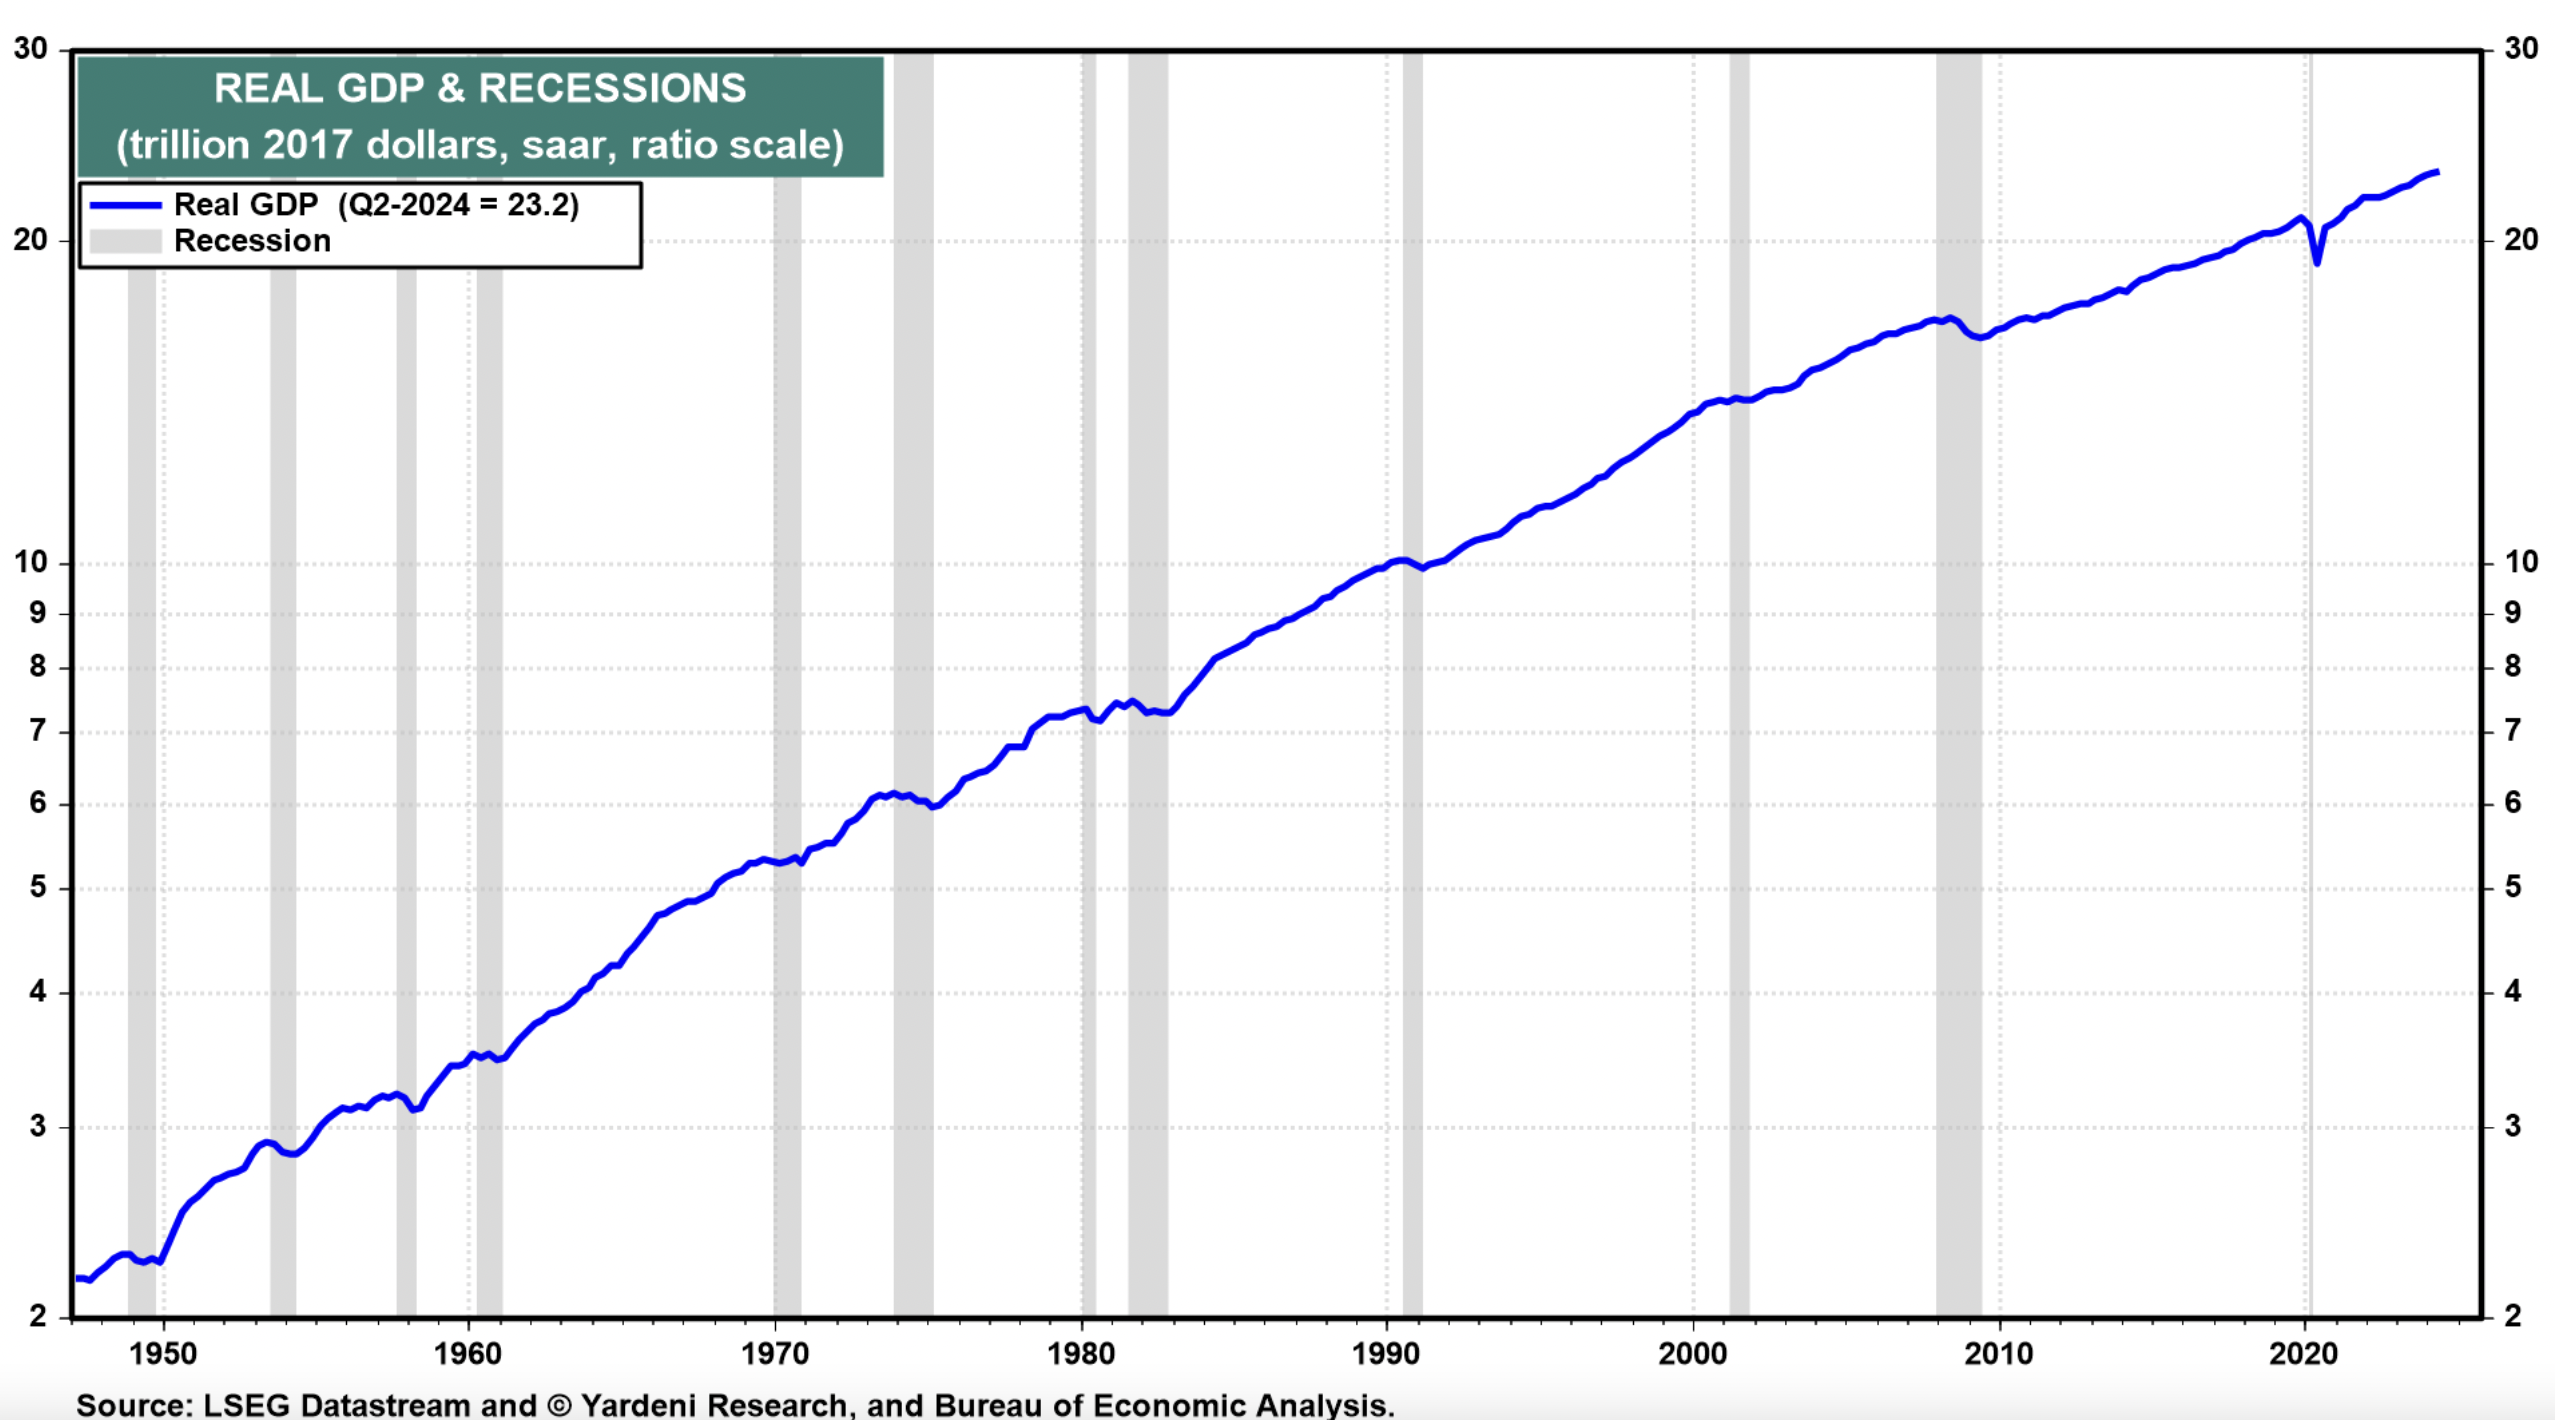
In the post-World War II period, from 1945 to 2023, the average recession lasted about 10 months. Since 1945, there have been 12 recessions that occurred during just 13% of that time span.
2. Bear markets are also infrequent and don’t last very long since they tend to be caused by recessions
There have been 28 bear markets in the S&P 500 since 1928, with an average decline of 35.6%. The average length of time was 289 days, or roughly 9.5 months. ABC News reported that since World War II, bear markets on average have taken 13 months to go from peak to trough and 27 months for the stock price index to recoup lost ground. The S&P 500 index has fallen an average of 33% during bear markets over that time frame.
3. US Economy: Significant Upward Revisions Show No Landing
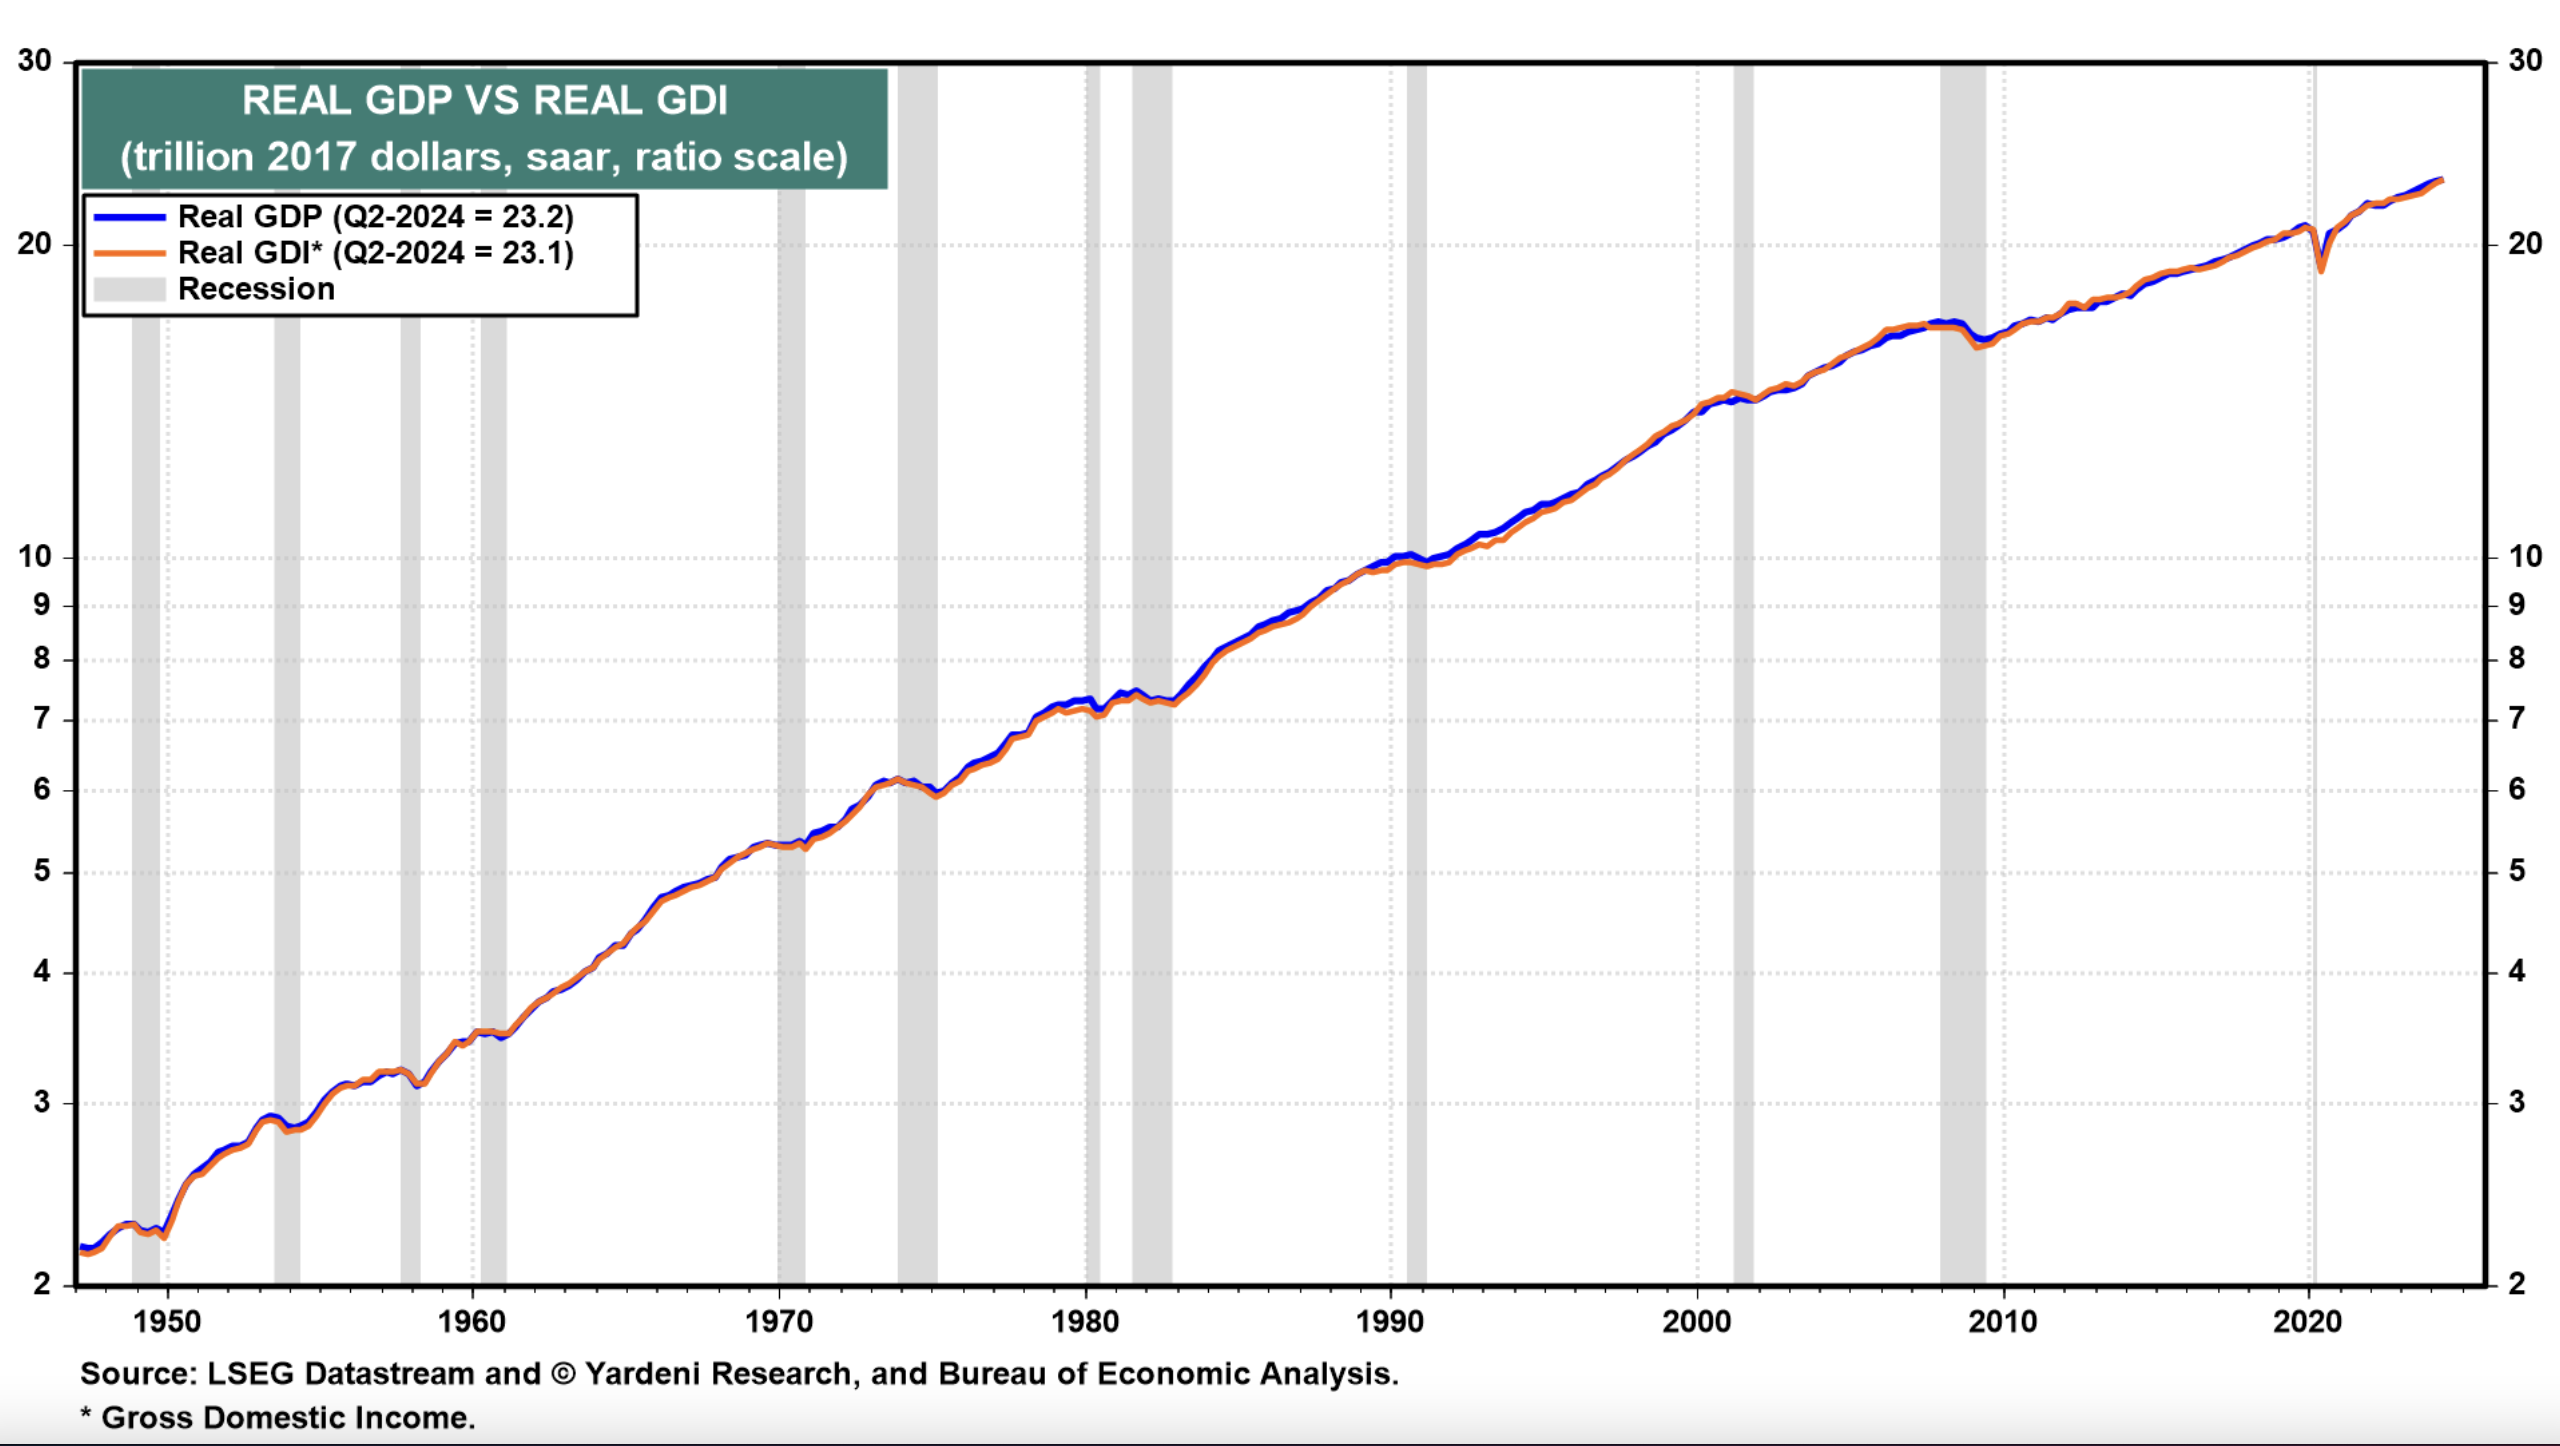
Among the recent pessimistic scenarios of the permabears is that real Gross Domestic Production (GDP) has been growing faster than real Gross Domestic Income (GDI). The two alternative measures of the US economy have increasingly diverged, suggesting that something is wrong with the real GDP data and that it is bound to be revised downward, consistent with the naysayers’ pessimism. They haven’t explained why they deem the GDI data to be a more accurate measure of economic activity than the GDP data.
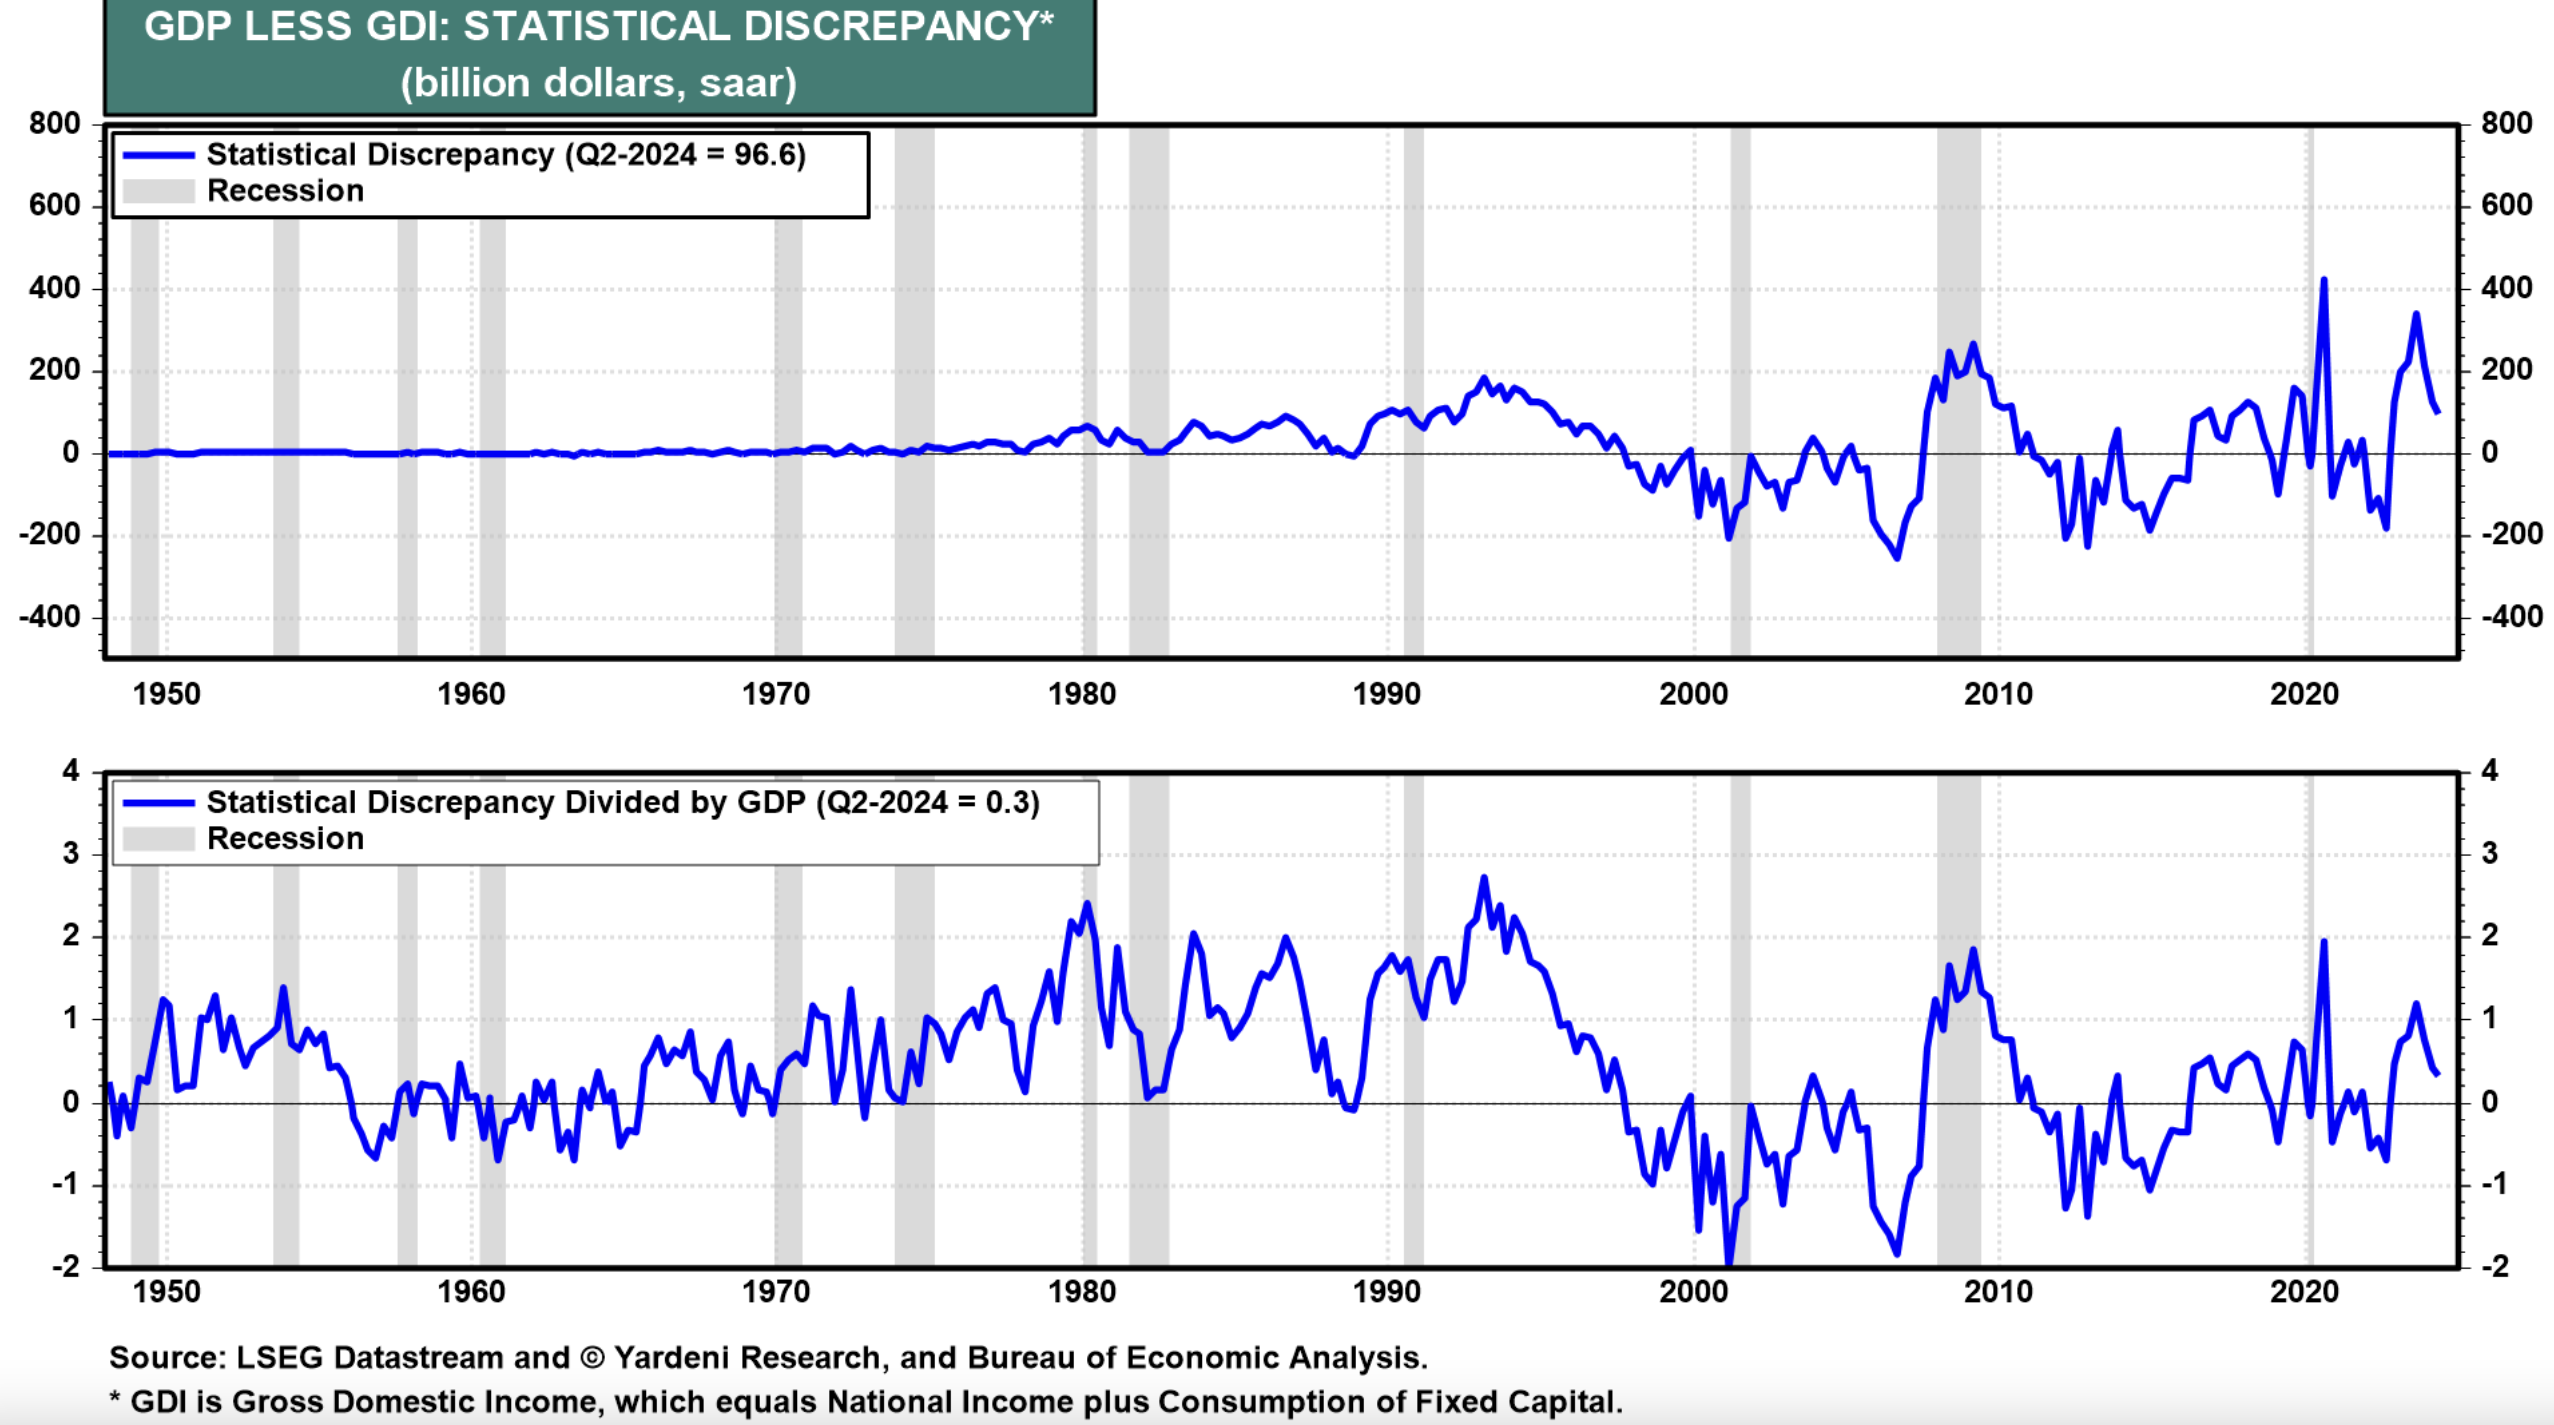
Indeed, the Bureau of Economic Analysis (BEA), which compiles both series, favors GDP over GDI: “GDI is an alternative way of measuring the nation’s economy, by counting the incomes earned and costs incurred in production. In theory, GDI should equal gross domestic product, but the different source data yield different results. The difference between the two measures is known as the ‘statistical discrepancy.’ BEA considers GDP more reliable because it’s based on timelier, more expansive data.”
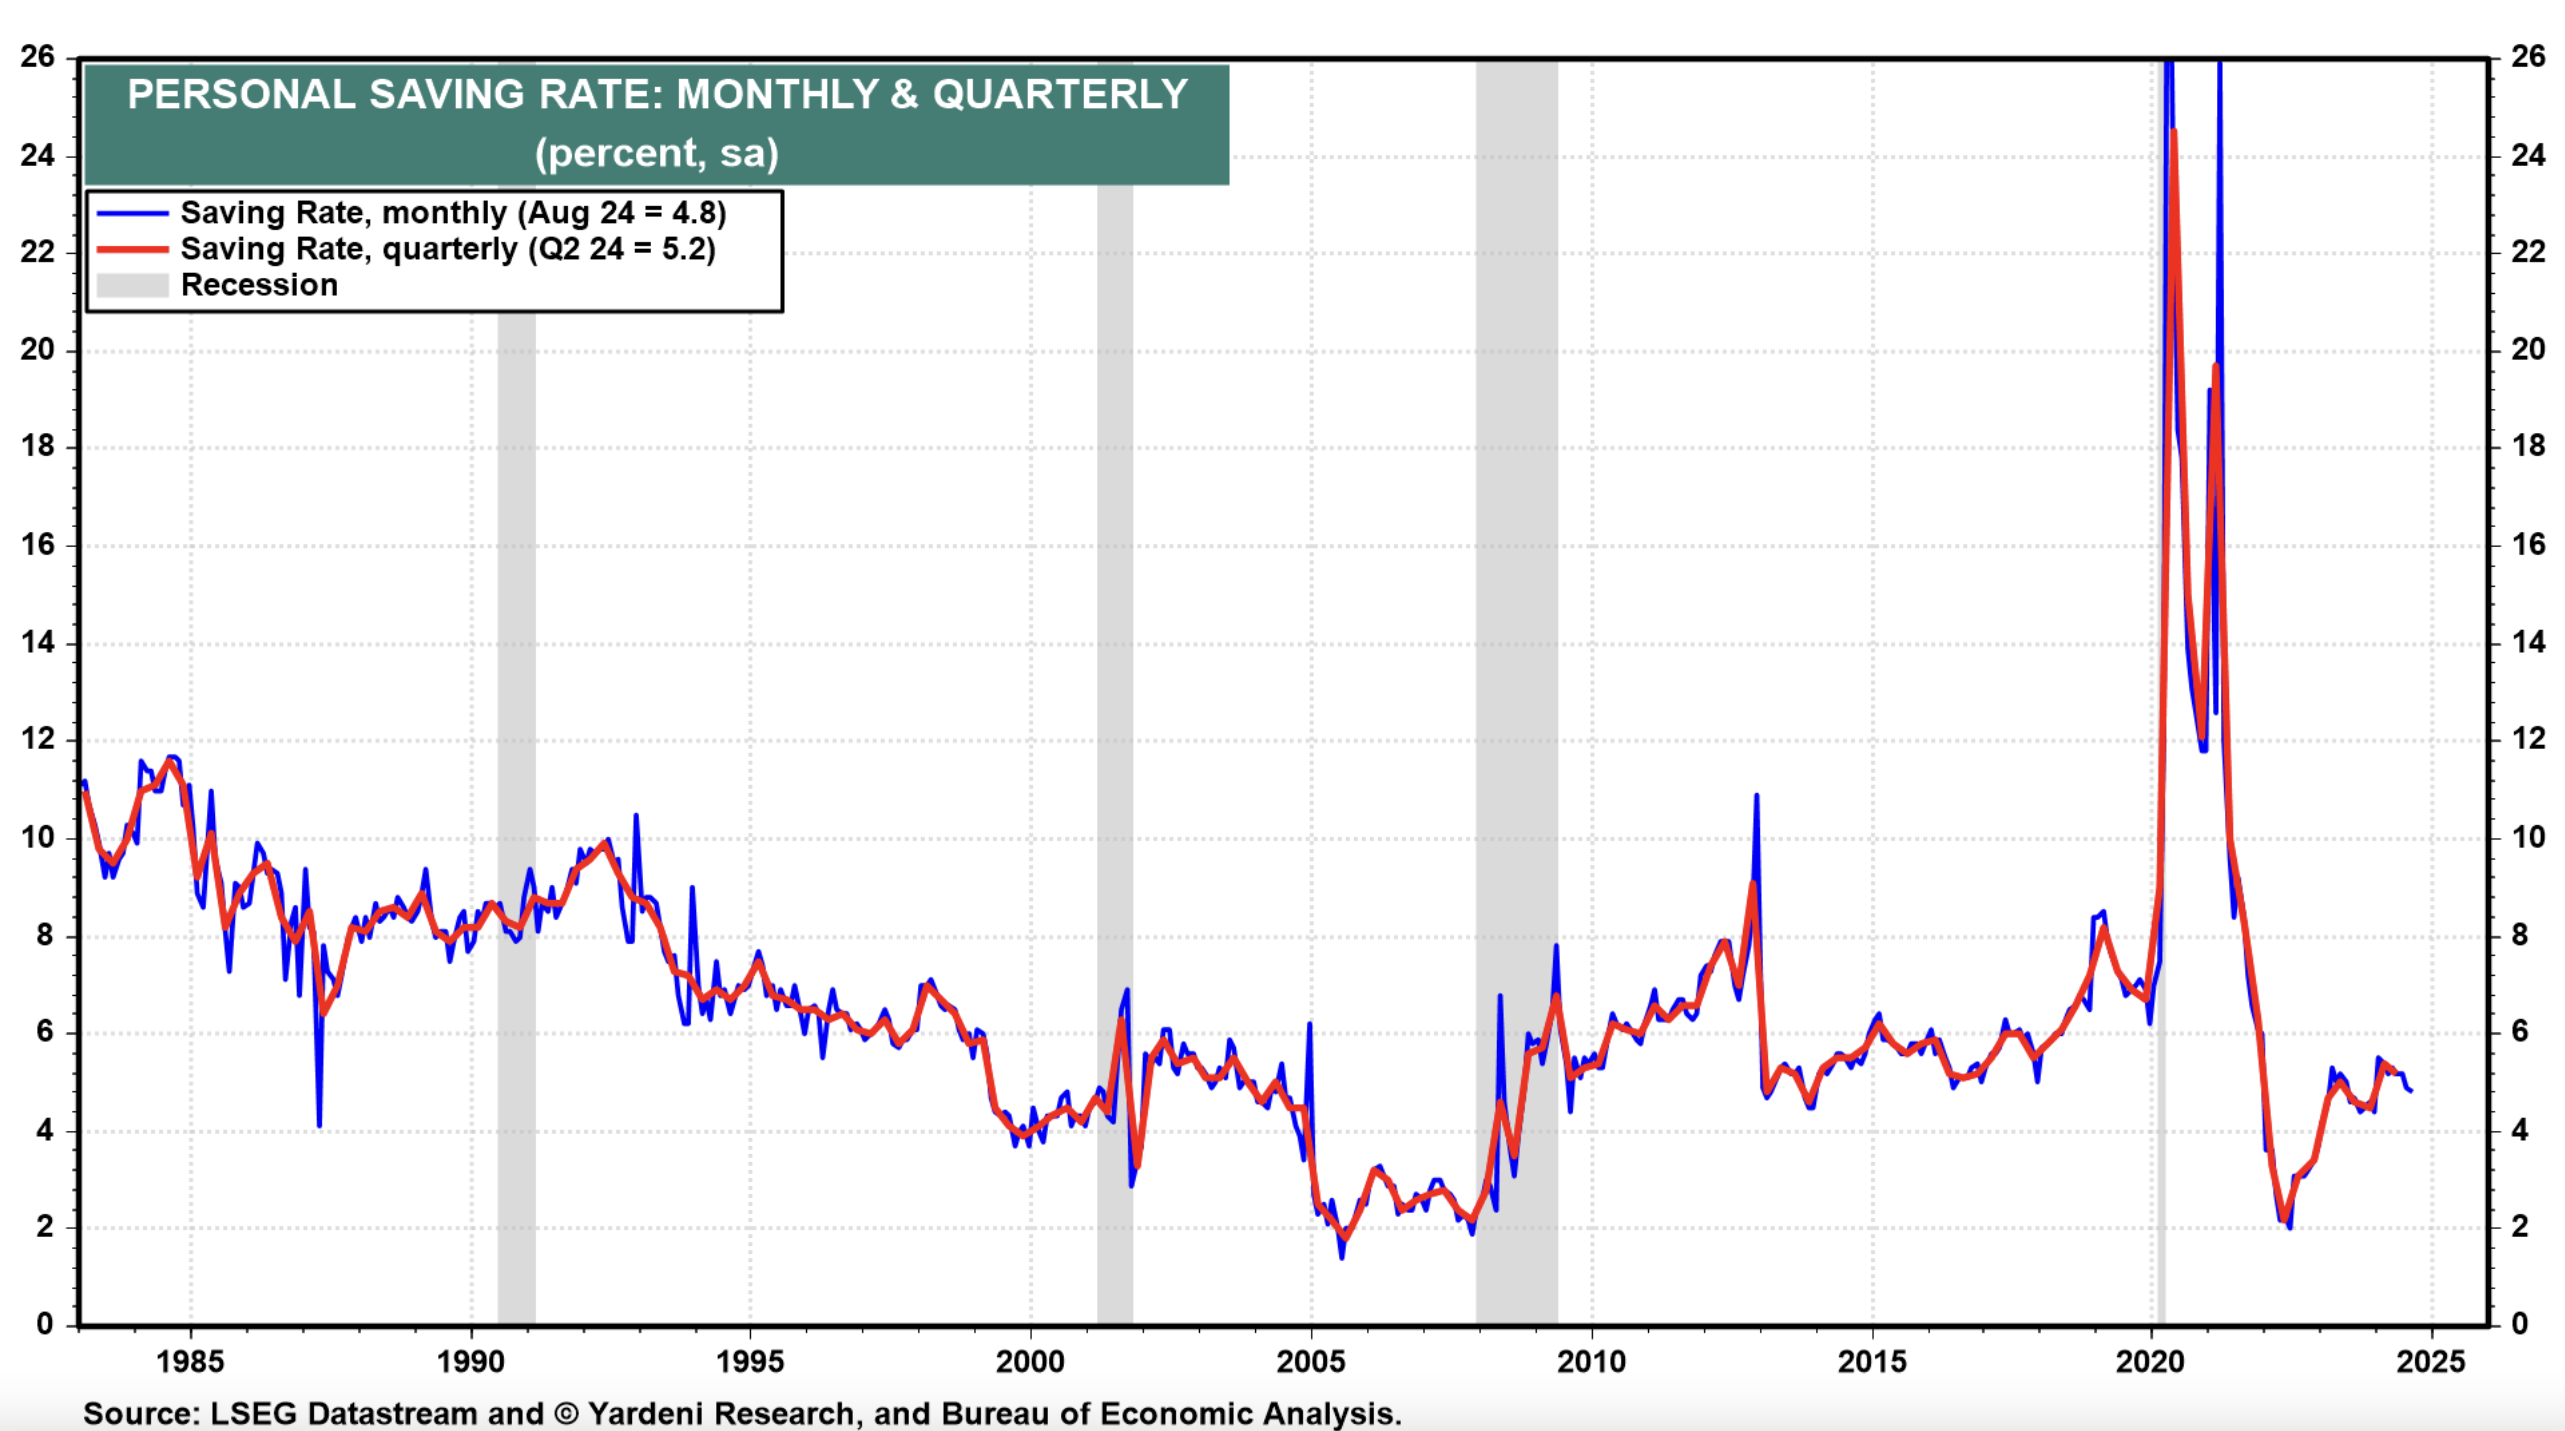
Meanwhile, the permabears have also been ringing the alarm bell about the personal saving rate lately. It had dropped to 3.3% during Q2-2024, according to the previous estimate, the lowest since Q3-2022. One permabear wrote on September 25 that “history suggests when the SR sinks this low, it usually proves unsustainable with a subsequent rise triggering a recession.
The slide in the SR from 4% at the start of this year was not due to households dipping into to their pandemic-era excess savings, which have been long since spent. But it seems that households have become used to running down their savings and can’t break the habit.” His conclusion was that “the super-low US saving ratio [is] a ticking economic timebomb.”
The very next day, on September 26, the BEA released its latest revisions of Q2-2024 GDP and GDI. Much to the chagrin of the permabears, real GDI was revised significantly higher, led by an upward revision in wages and salaries—which also caused a significant upward revision in the personal saving rate!
Here is the happy news from the BEA:
(1) GDP & GDI.
Real GDI increased 3.4% (saar) in Q2, an upward revision of 2.1ppts from the previous estimate. Real GDP rose an unrevised 3.0% during Q2. The average of real GDP and real GDI—a supplemental measure of US economic activity that equally weights GDP and GDI—increased 3.2% in Q2, an upward revision of 1.1ppts from the previous estimate.
Even Q1’s numbers were revised higher, likewise much to the bears’ chagrin. Real GDP was revised up from 1.4% to 1.6%, and real GDI was revised up from 1.3% to 3.0%. The average of the GDP and GDI was raised from 1.4% to 2.3%.
The statistical discrepancy between the two measures of the economy is tiny now. In current dollars, it was revised down to 0.3% from 2.7% during Q2.
(2) Personal savings
Personal saving was $1.13 trillion in Q2, an upward revision of $74.3 billion from the previous estimate.
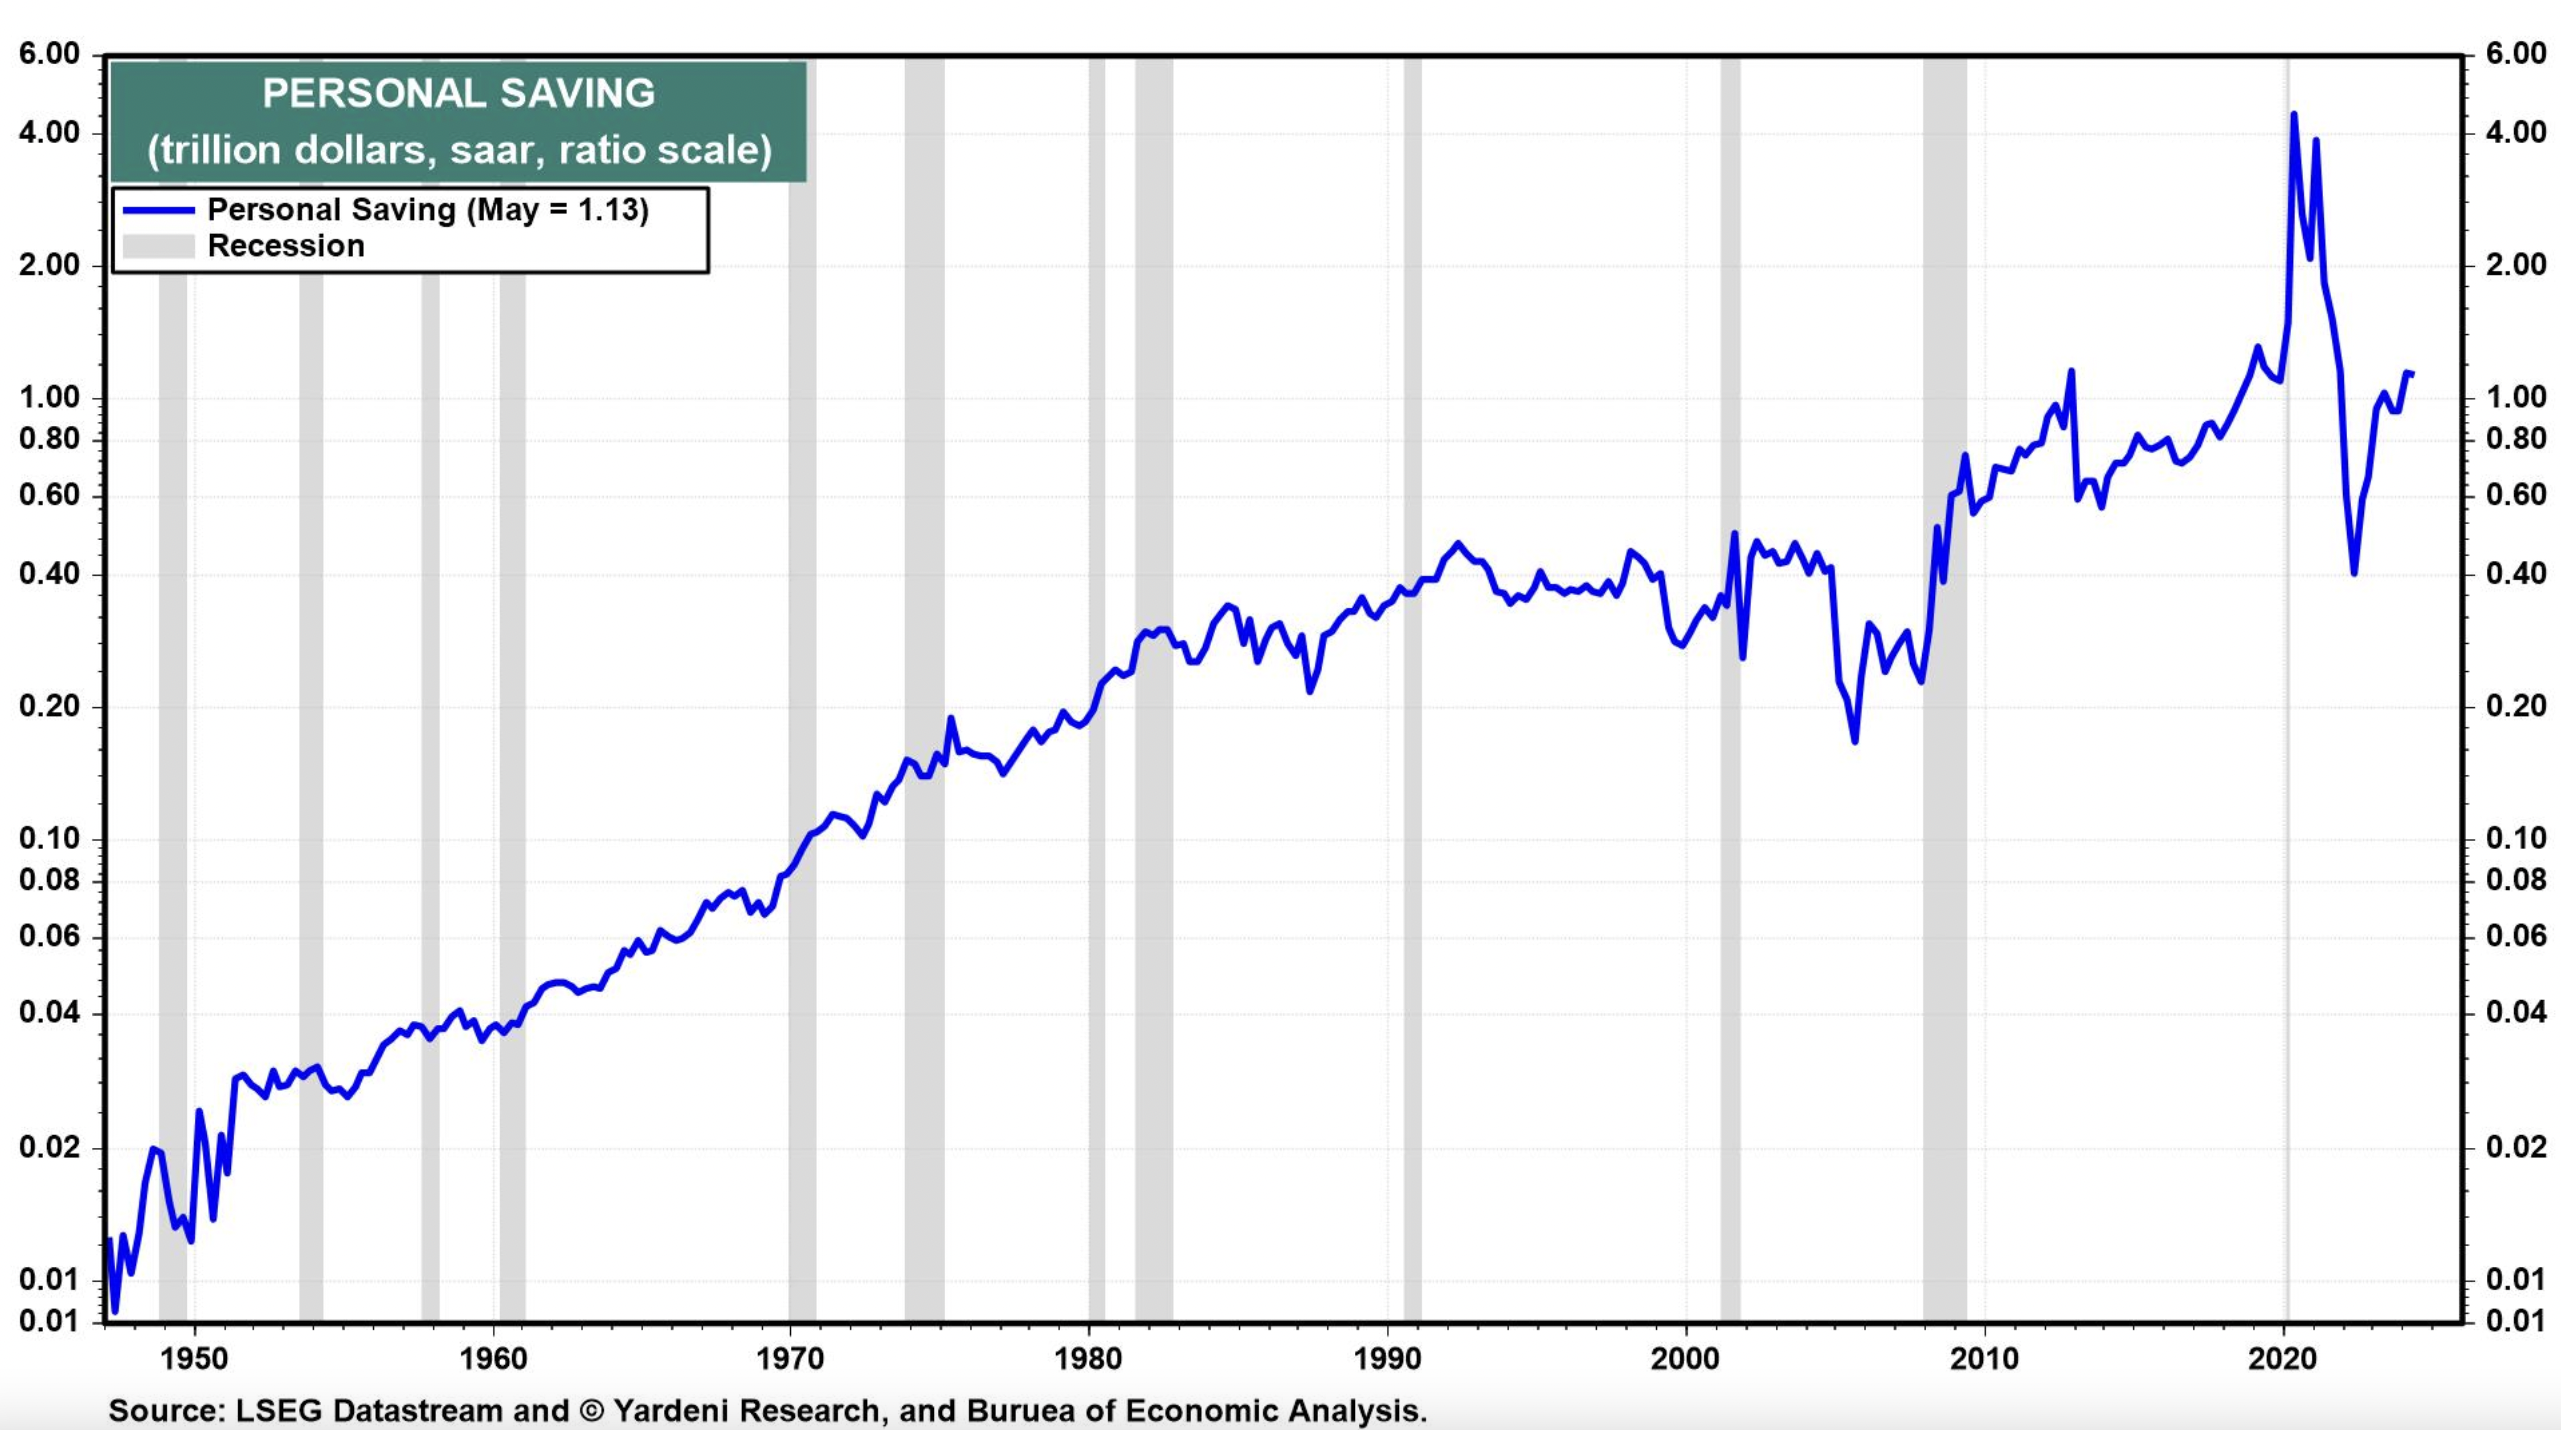
The personal saving rate—personal saving as a percentage of disposable personal income—was 5.2% in Q2, compared with 5.4% (revised) in Q1. The previous estimates for the saving rate were 3.3% in Q2 and 3.7% in Q1.
(3) Wages & salaries
The upward revisions to both the GDI and the personal saving rate reflected an upward revision in nominal wages and salaries compensation. So consumer spending was strong during the first half of the year, while the personal saving rate remained relatively high, and certainly higher than the “timebomb” forecast.
(4) Corporate profits
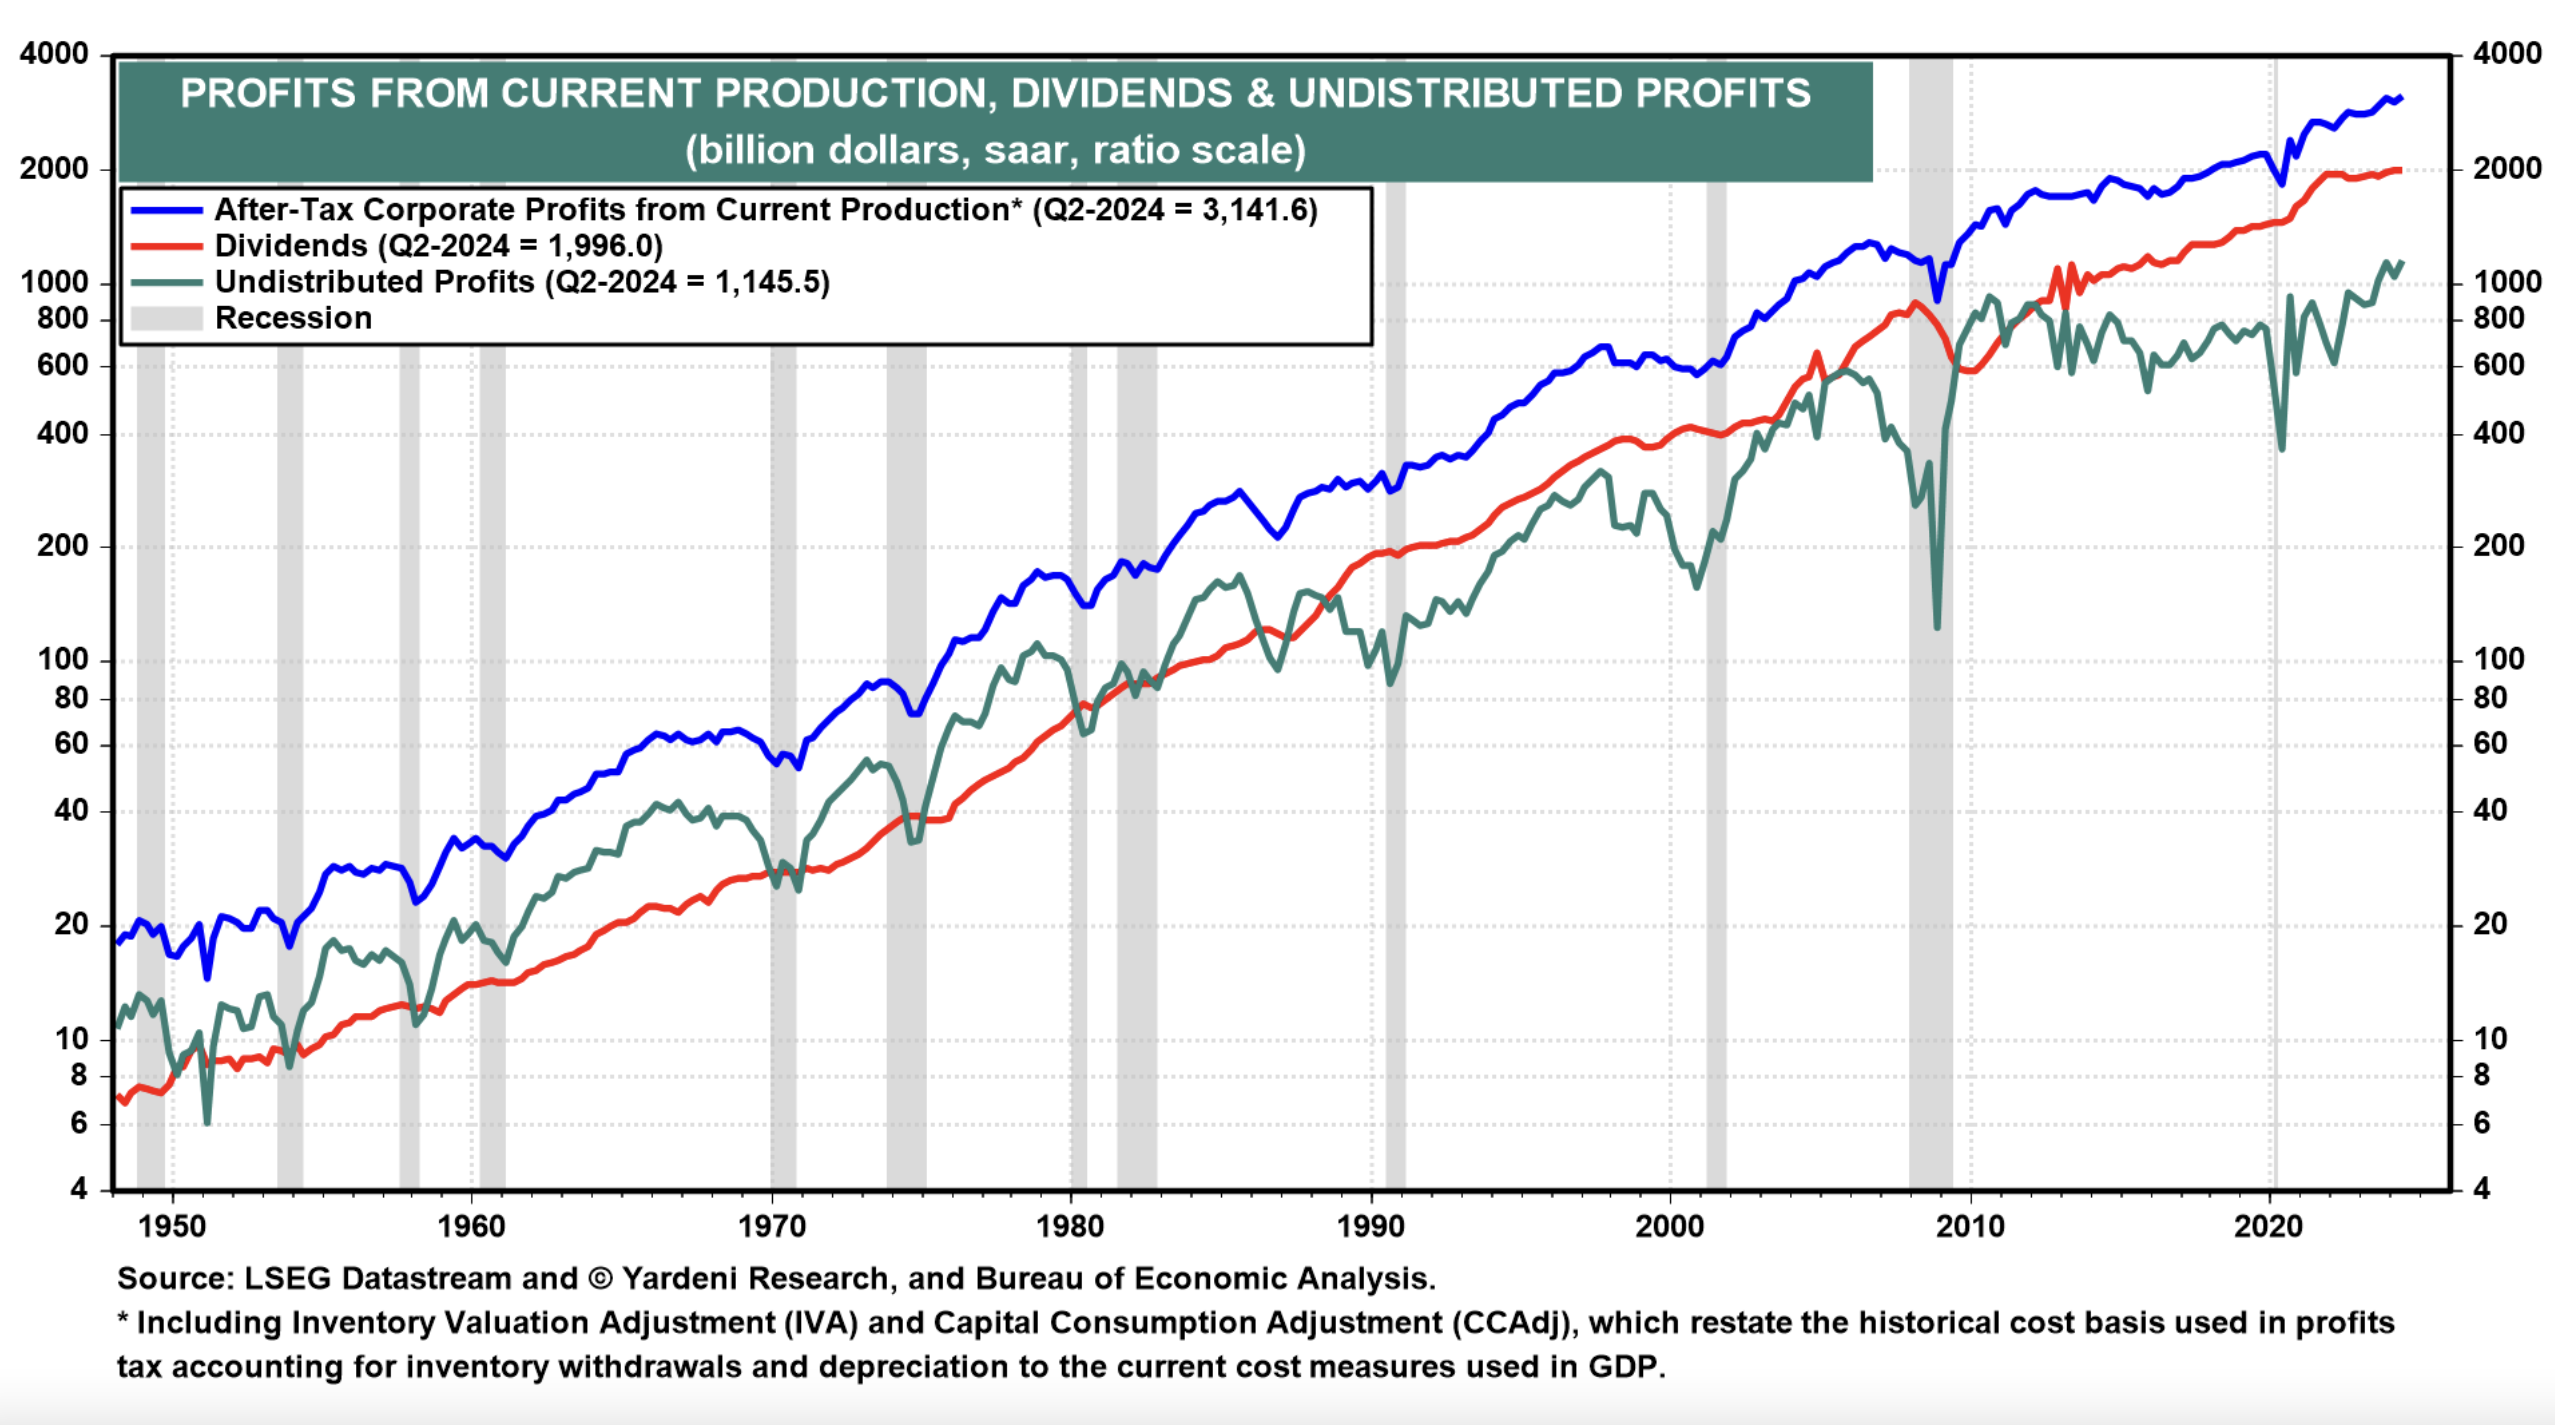
There’s more: After-tax corporate profits from current production (corporate profits with inventory valuation and capital consumption adjustments) was revised up by 3.5% to a record $3.1 trillion (saar).
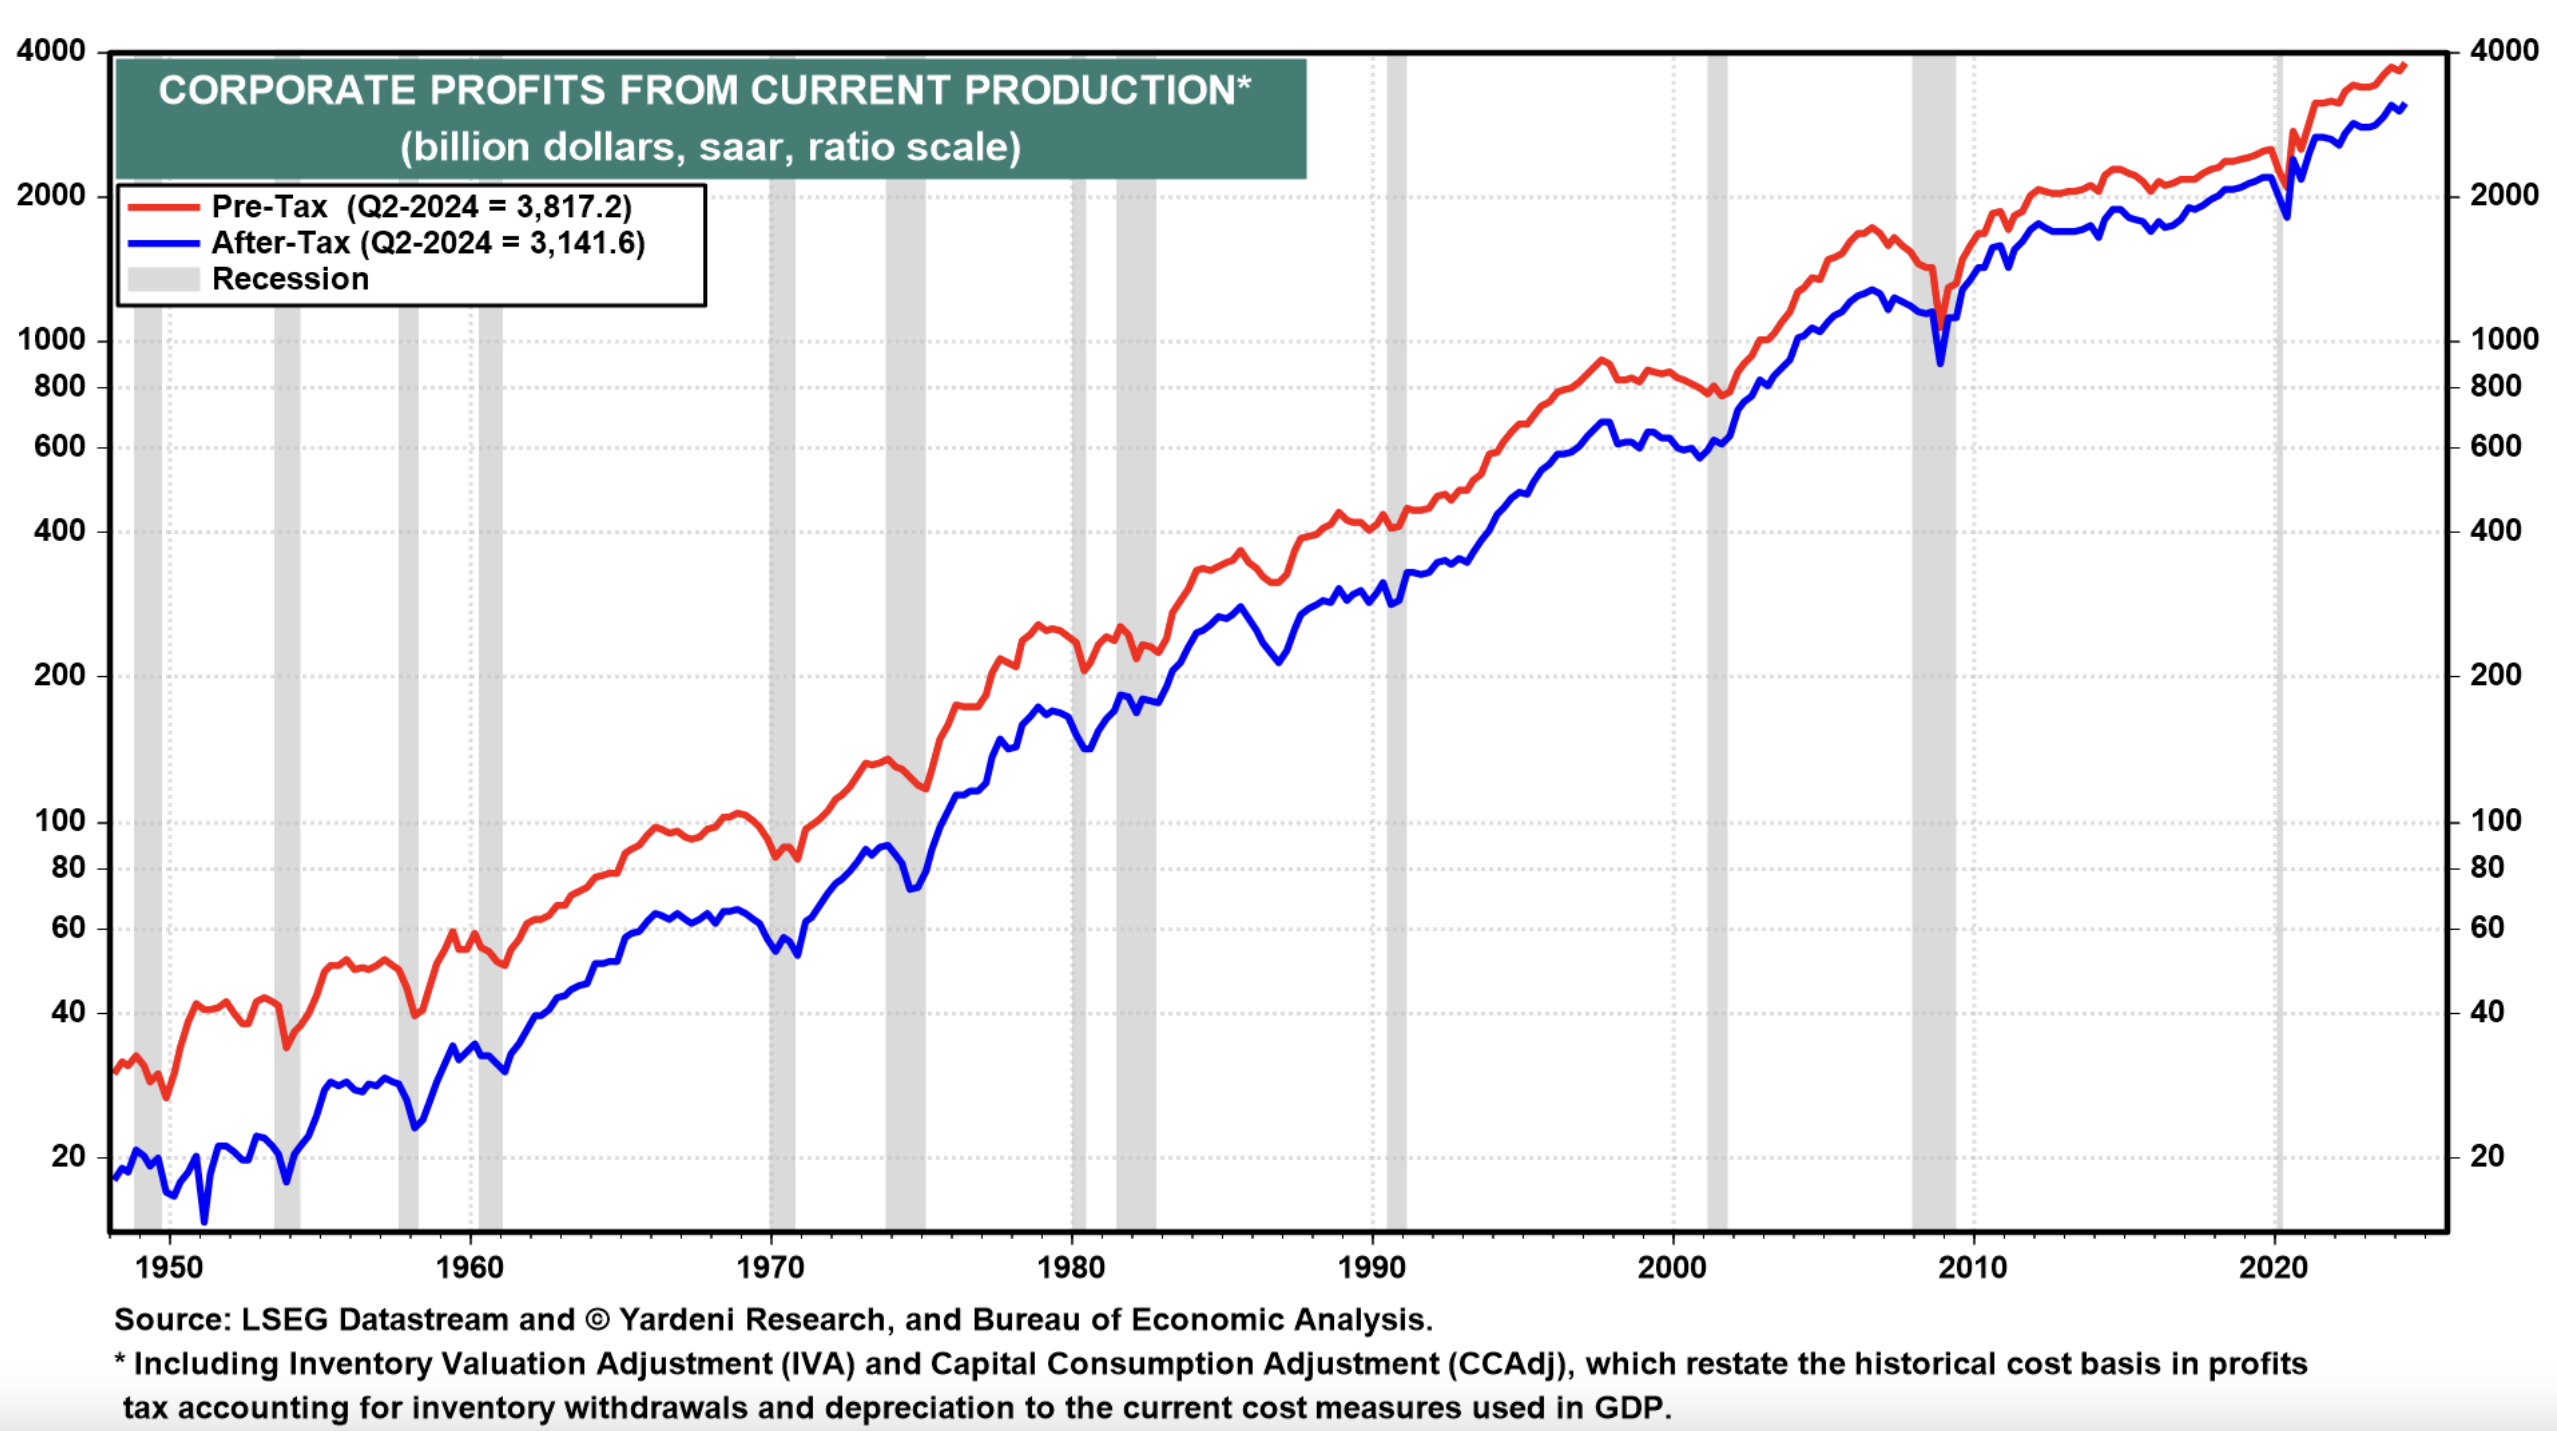
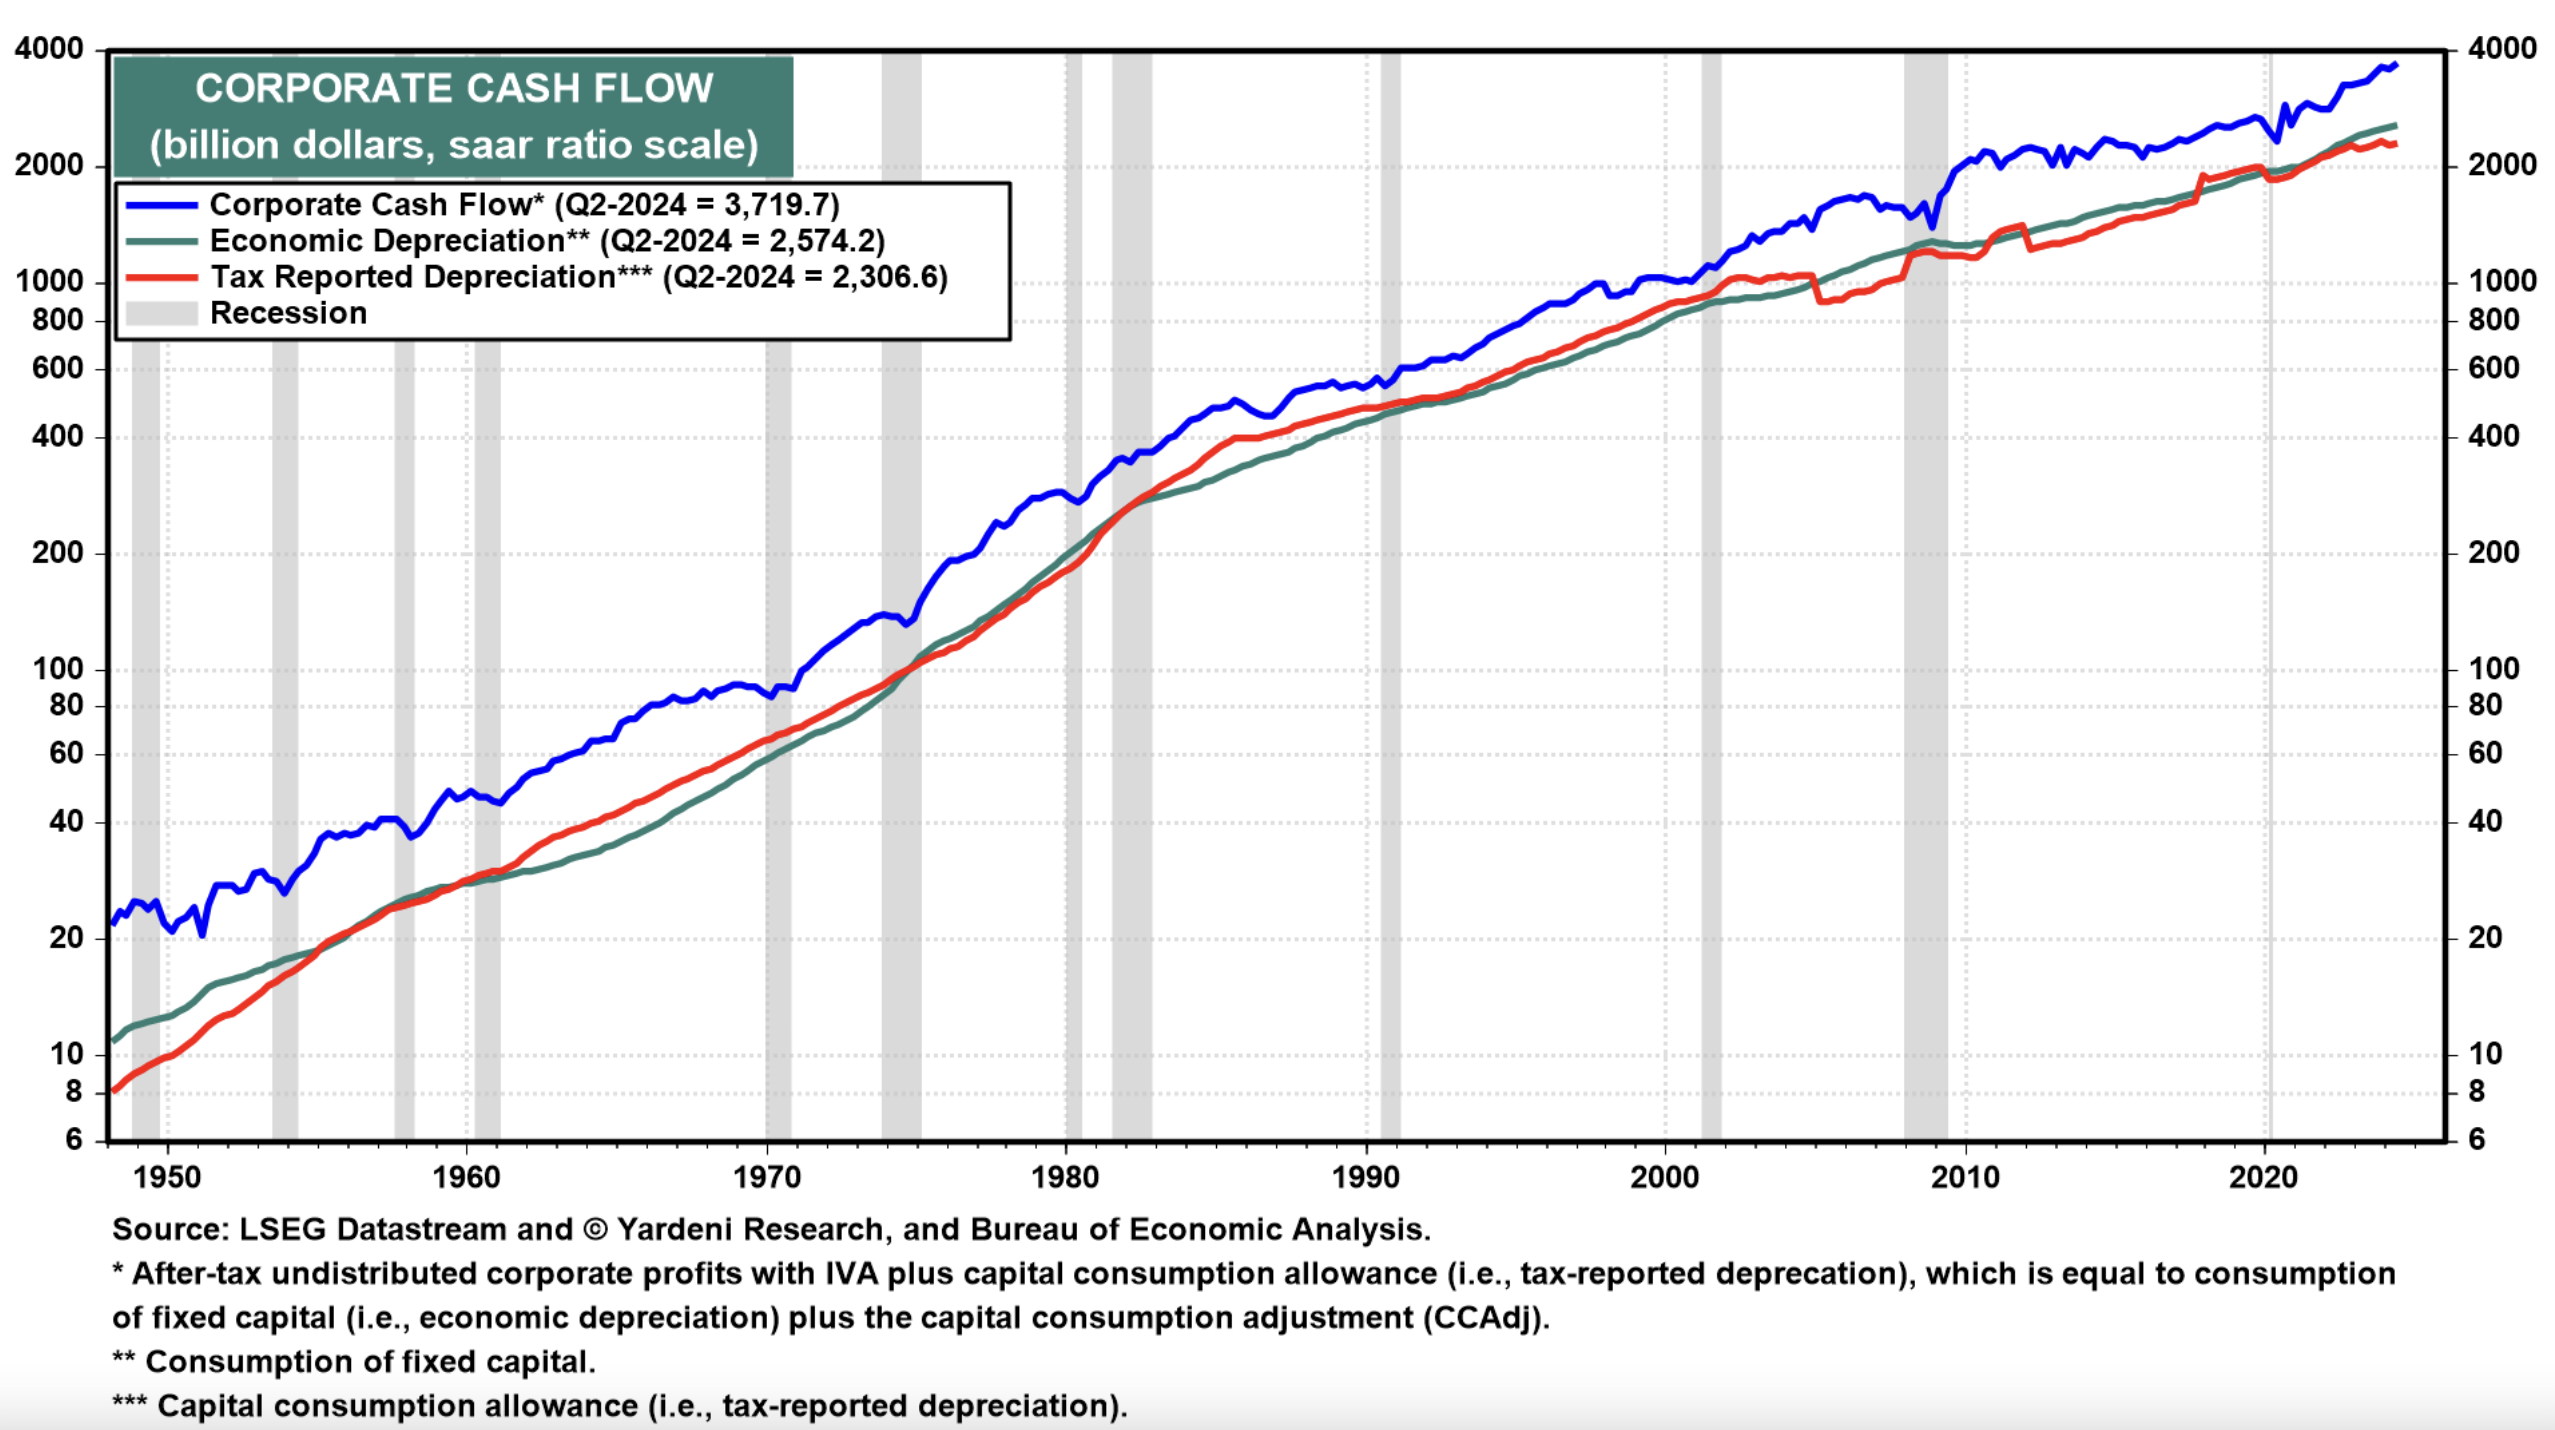
So corporate cash flow was also revised up, to a record $3.7 trillion.
Also rising to a new record high of $2.0 trillion was corporate dividends.
(5) Q3’s GDP.
The current quarter will continue to frustrate any remaining hard-landers. The Atlanta Fed’s GDPNow model shows real GDP up 3.1% (saar) during Q3. That’s an upward revision from 2.9% on September 18.
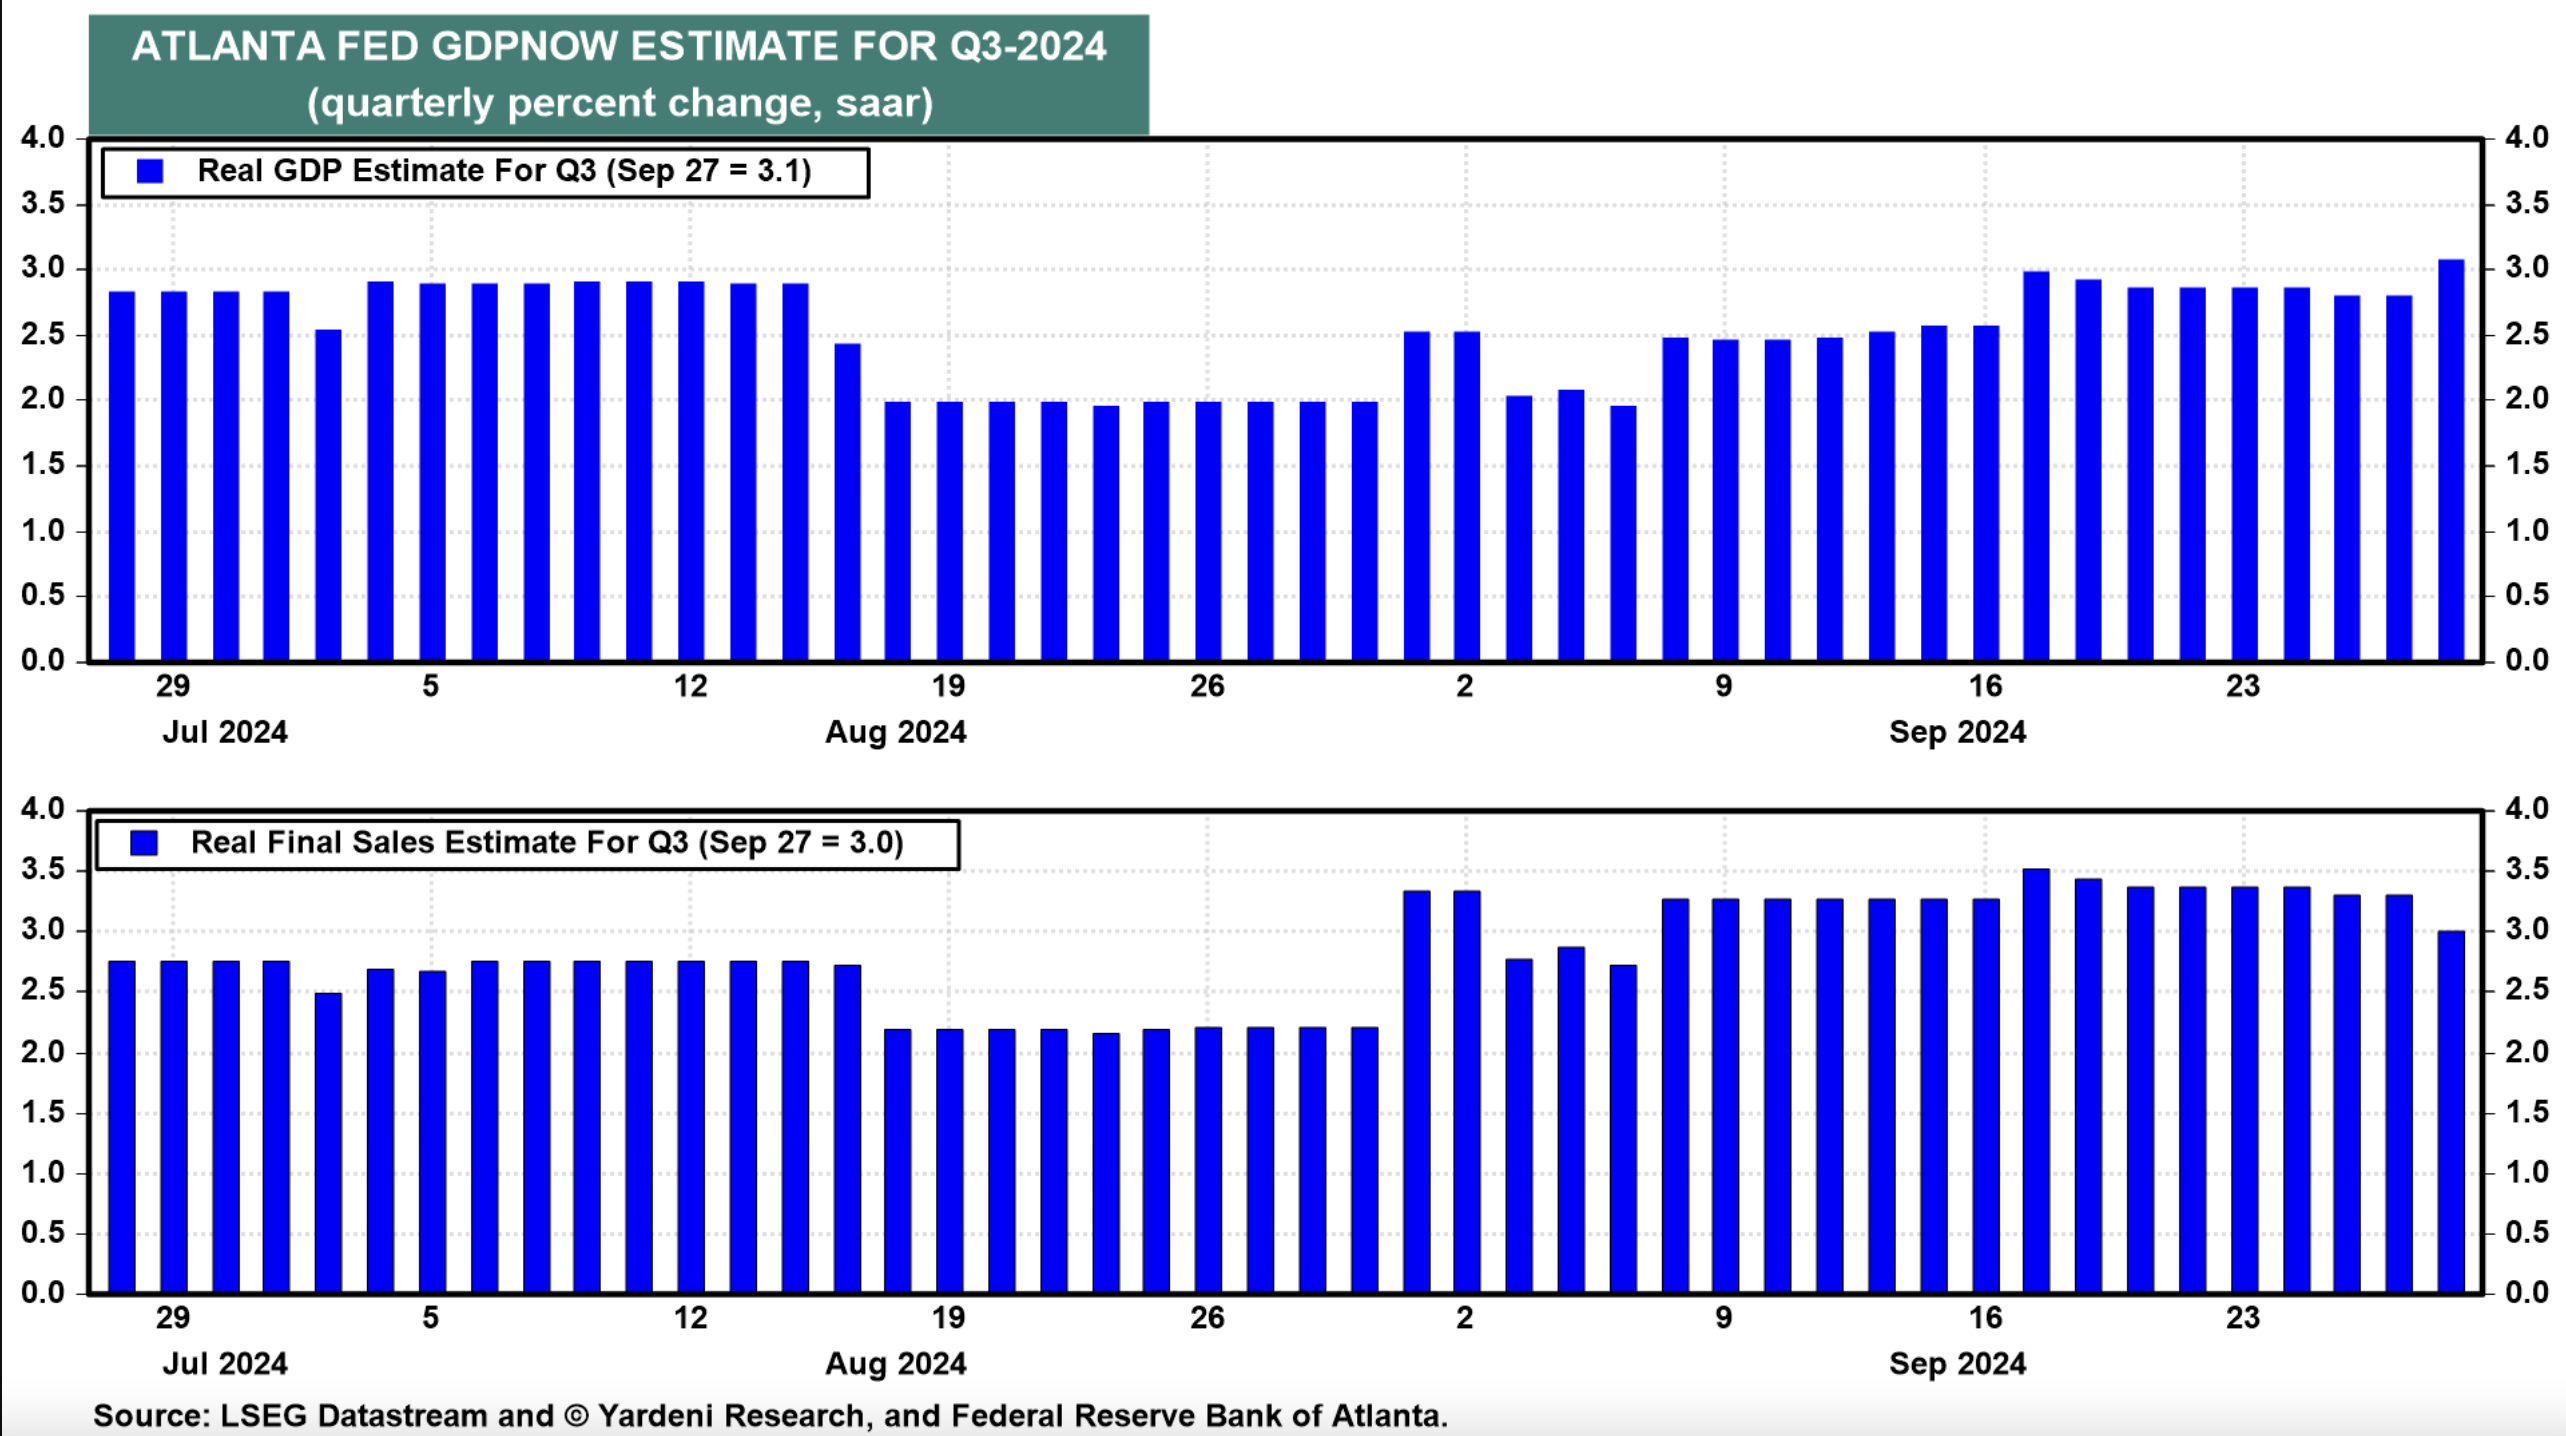
Real consumer spending is tracking at a still robust 3.3%, down from 3.7%.
(6) No landing.
The latest BEA revisions even erased the technical recession during H1-2022 when real GDP fell 2.0% and 0.6% during Q1 and Q2 of that year. Those two numbers were revised to -1.0% and 0.3%.
The “Godot recession” continues not to show up. Instead, a rolling recession has hit a few industries that were most sensitive to the tightening of monetary policy. But the overall economy has remained resilient and less interest-rate sensitive than in the past.
As a result of the latest benchmark revisions, Q2’s real GDP and real GDI are 1.3% and 3.8% greater than previously estimated. There’s no hard or soft landing in the revisions. The economy is still flying high, as it has been since the two-month pandemic recession during March and April 2020!
So, Why Did the Fed Ease?
That’s a good question given all the above.
The answer is that Congress told the Fed to ease by mandating that monetary policy must aim to keep both the inflation and the unemployment rates low. Fed officials can certainly claim that they have achieved this remarkable balancing act. In August, the unemployment rate was only 4.2%, and headline and core PCED inflation rates were down to 2.2% and 2.7%.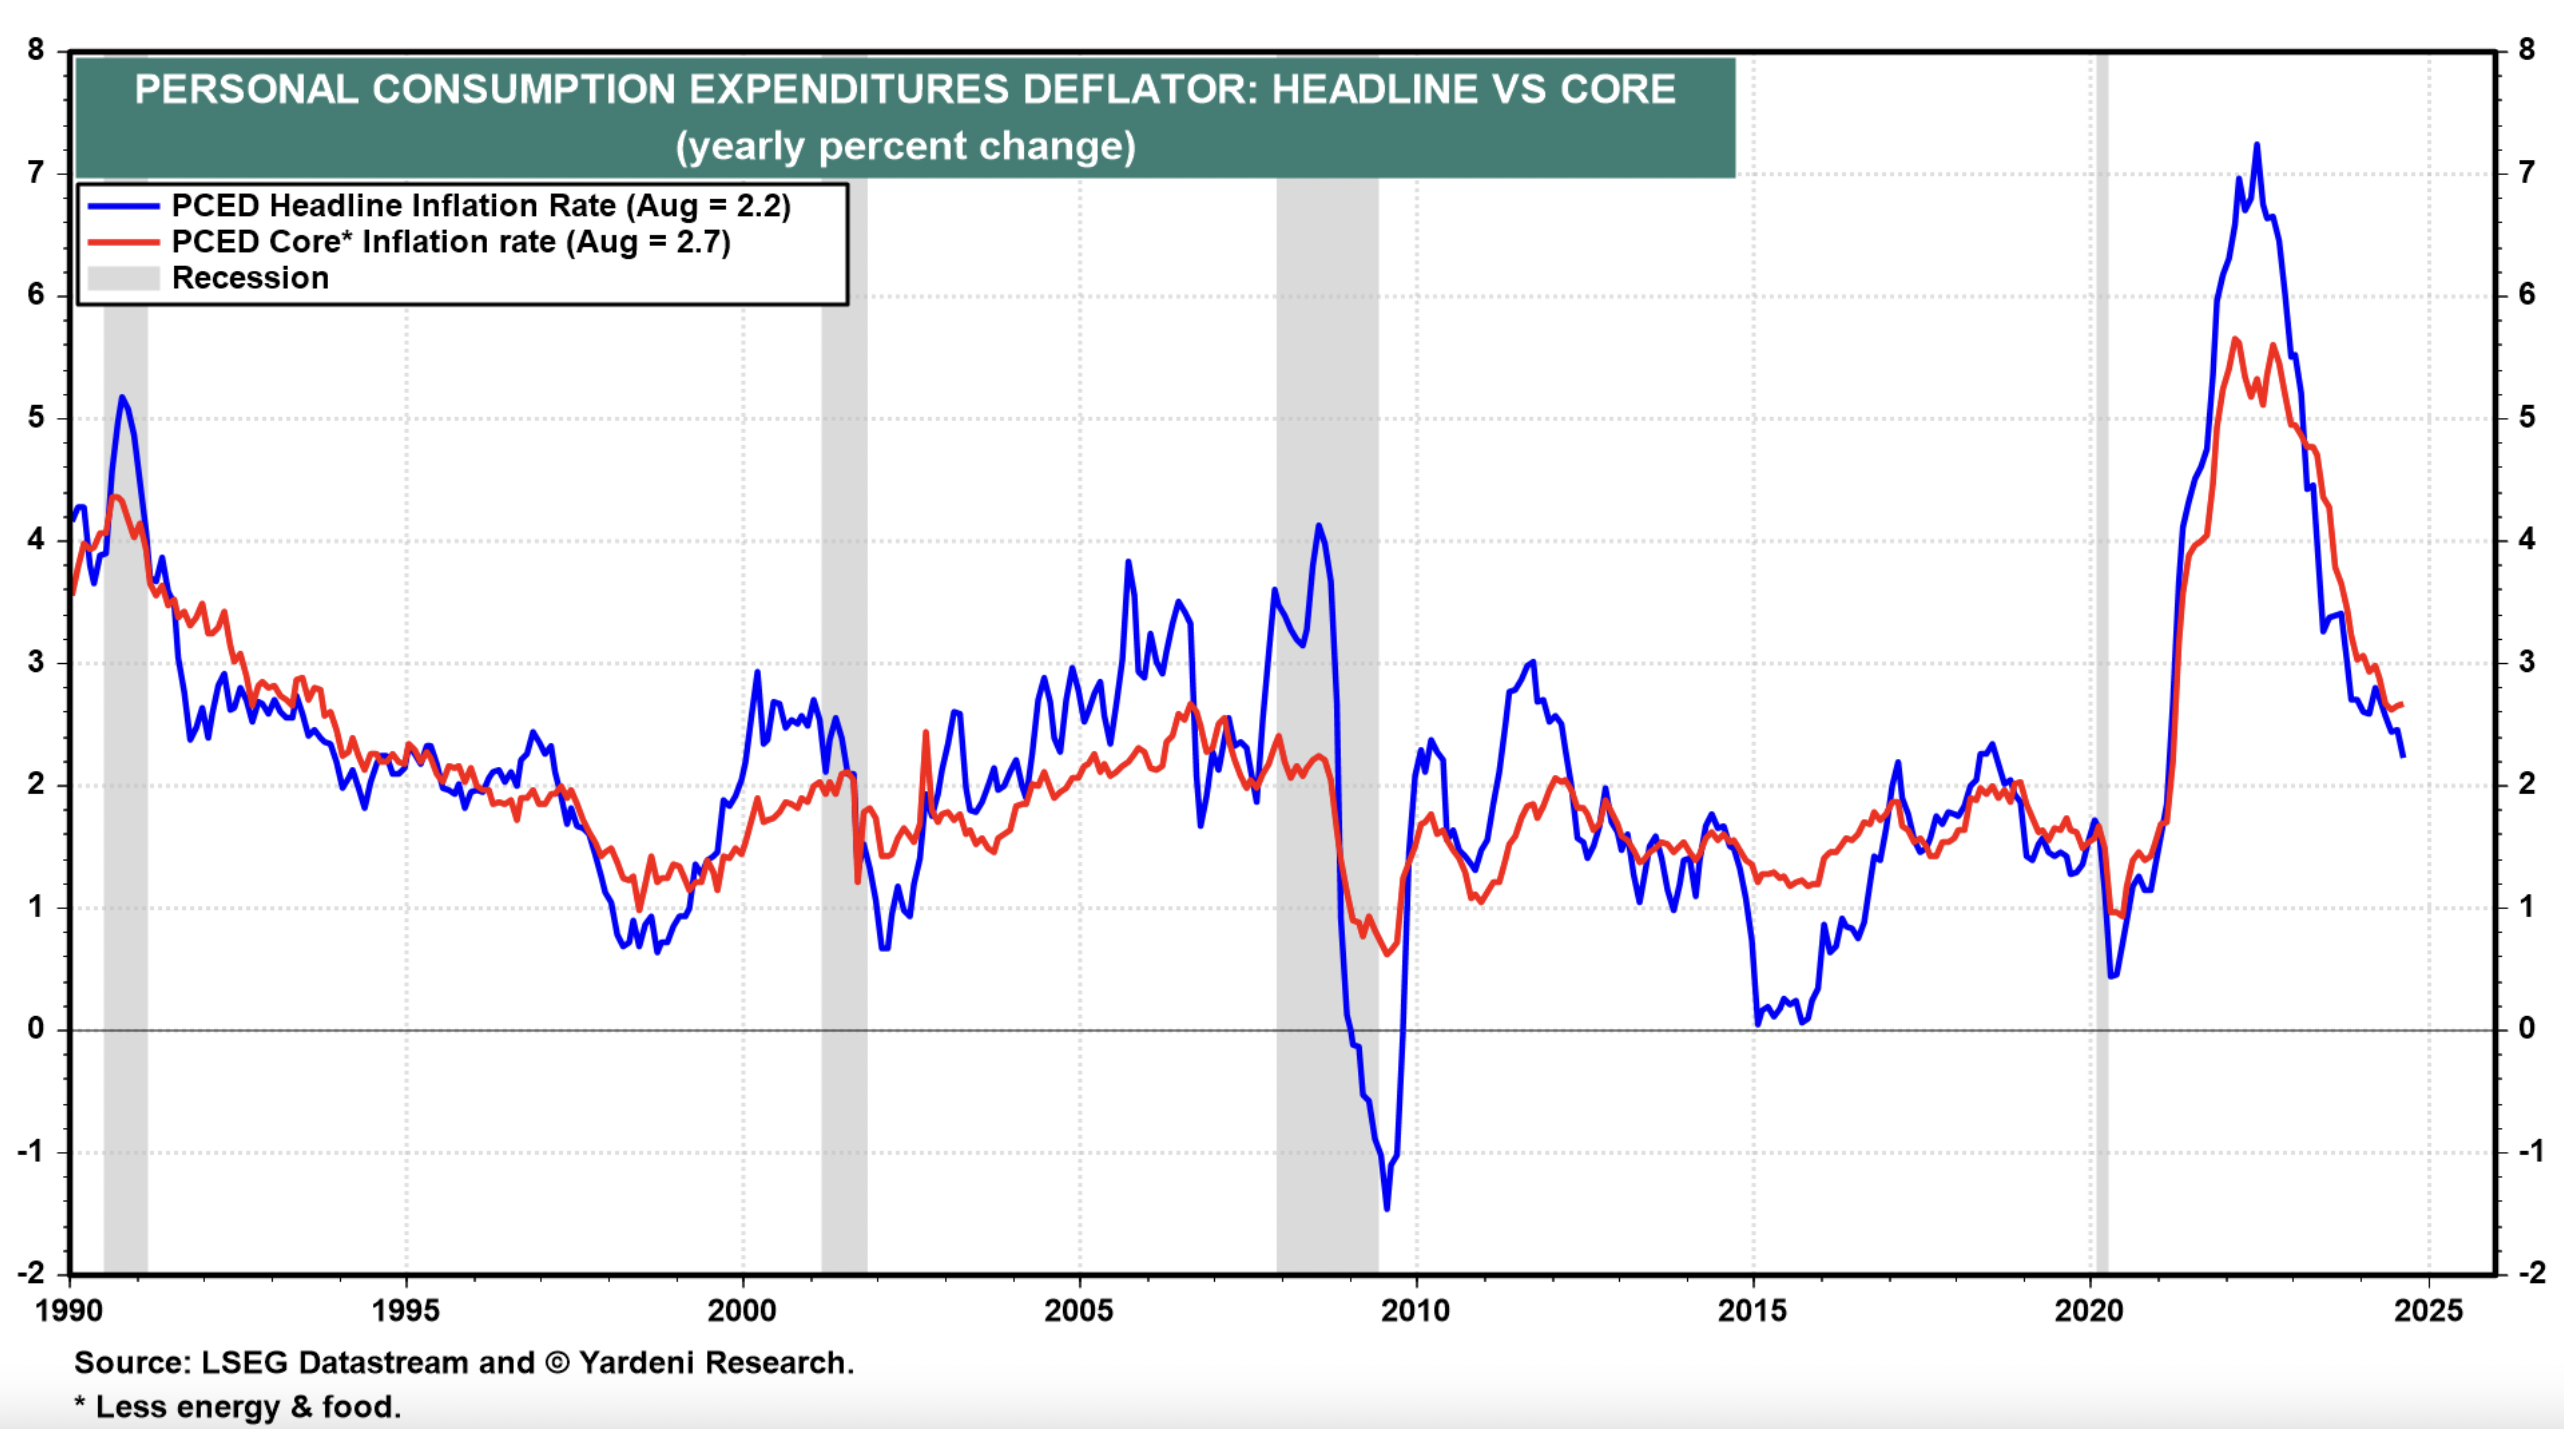
Fed officials can declare “Mission accomplished!” And it was achieved without a recession as was required in the past to do the job.
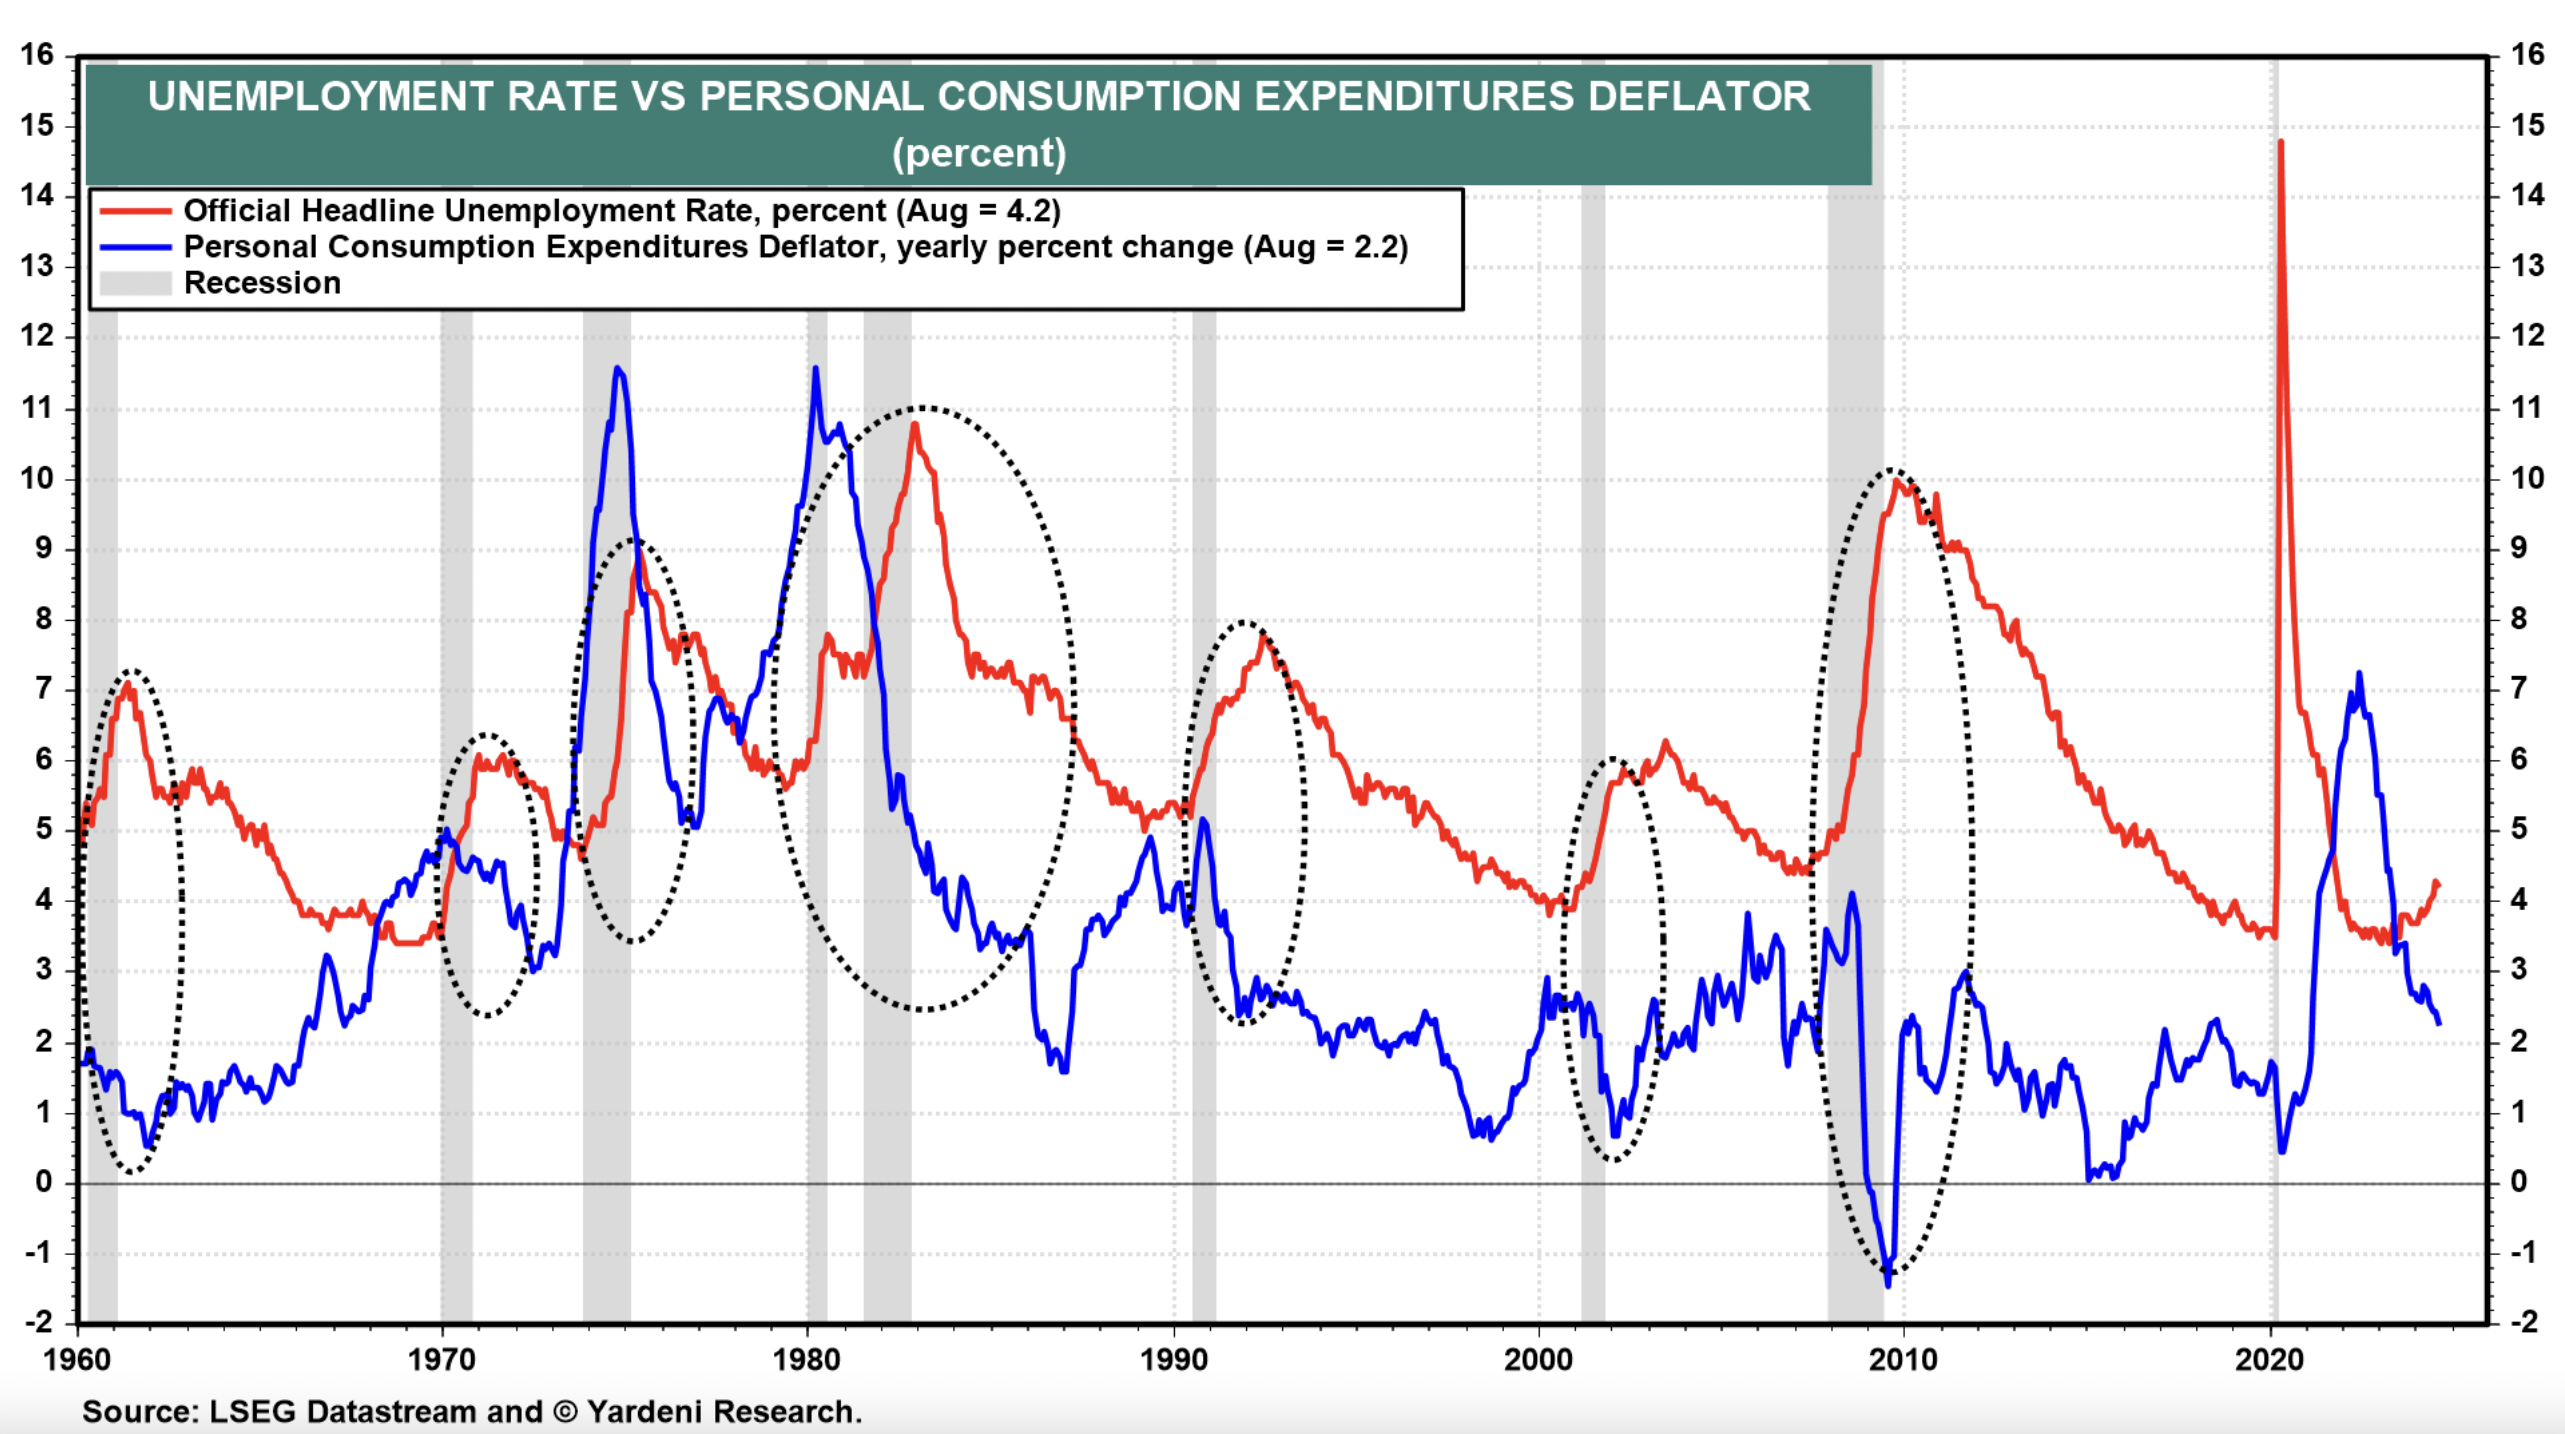
However, the unemployment rate is up from last year’s low of 3.4% in April and January. That’s the main reason that Powell & Co. decided to lower the federal funds rate by 50bps last week.
They chose to ignore August’s sticky readings of the “supercore” inflation rate (i.e., consumer price inflation for services excluding energy and housing), which was 3.3% for the PCED and 4.3% for the CPI.
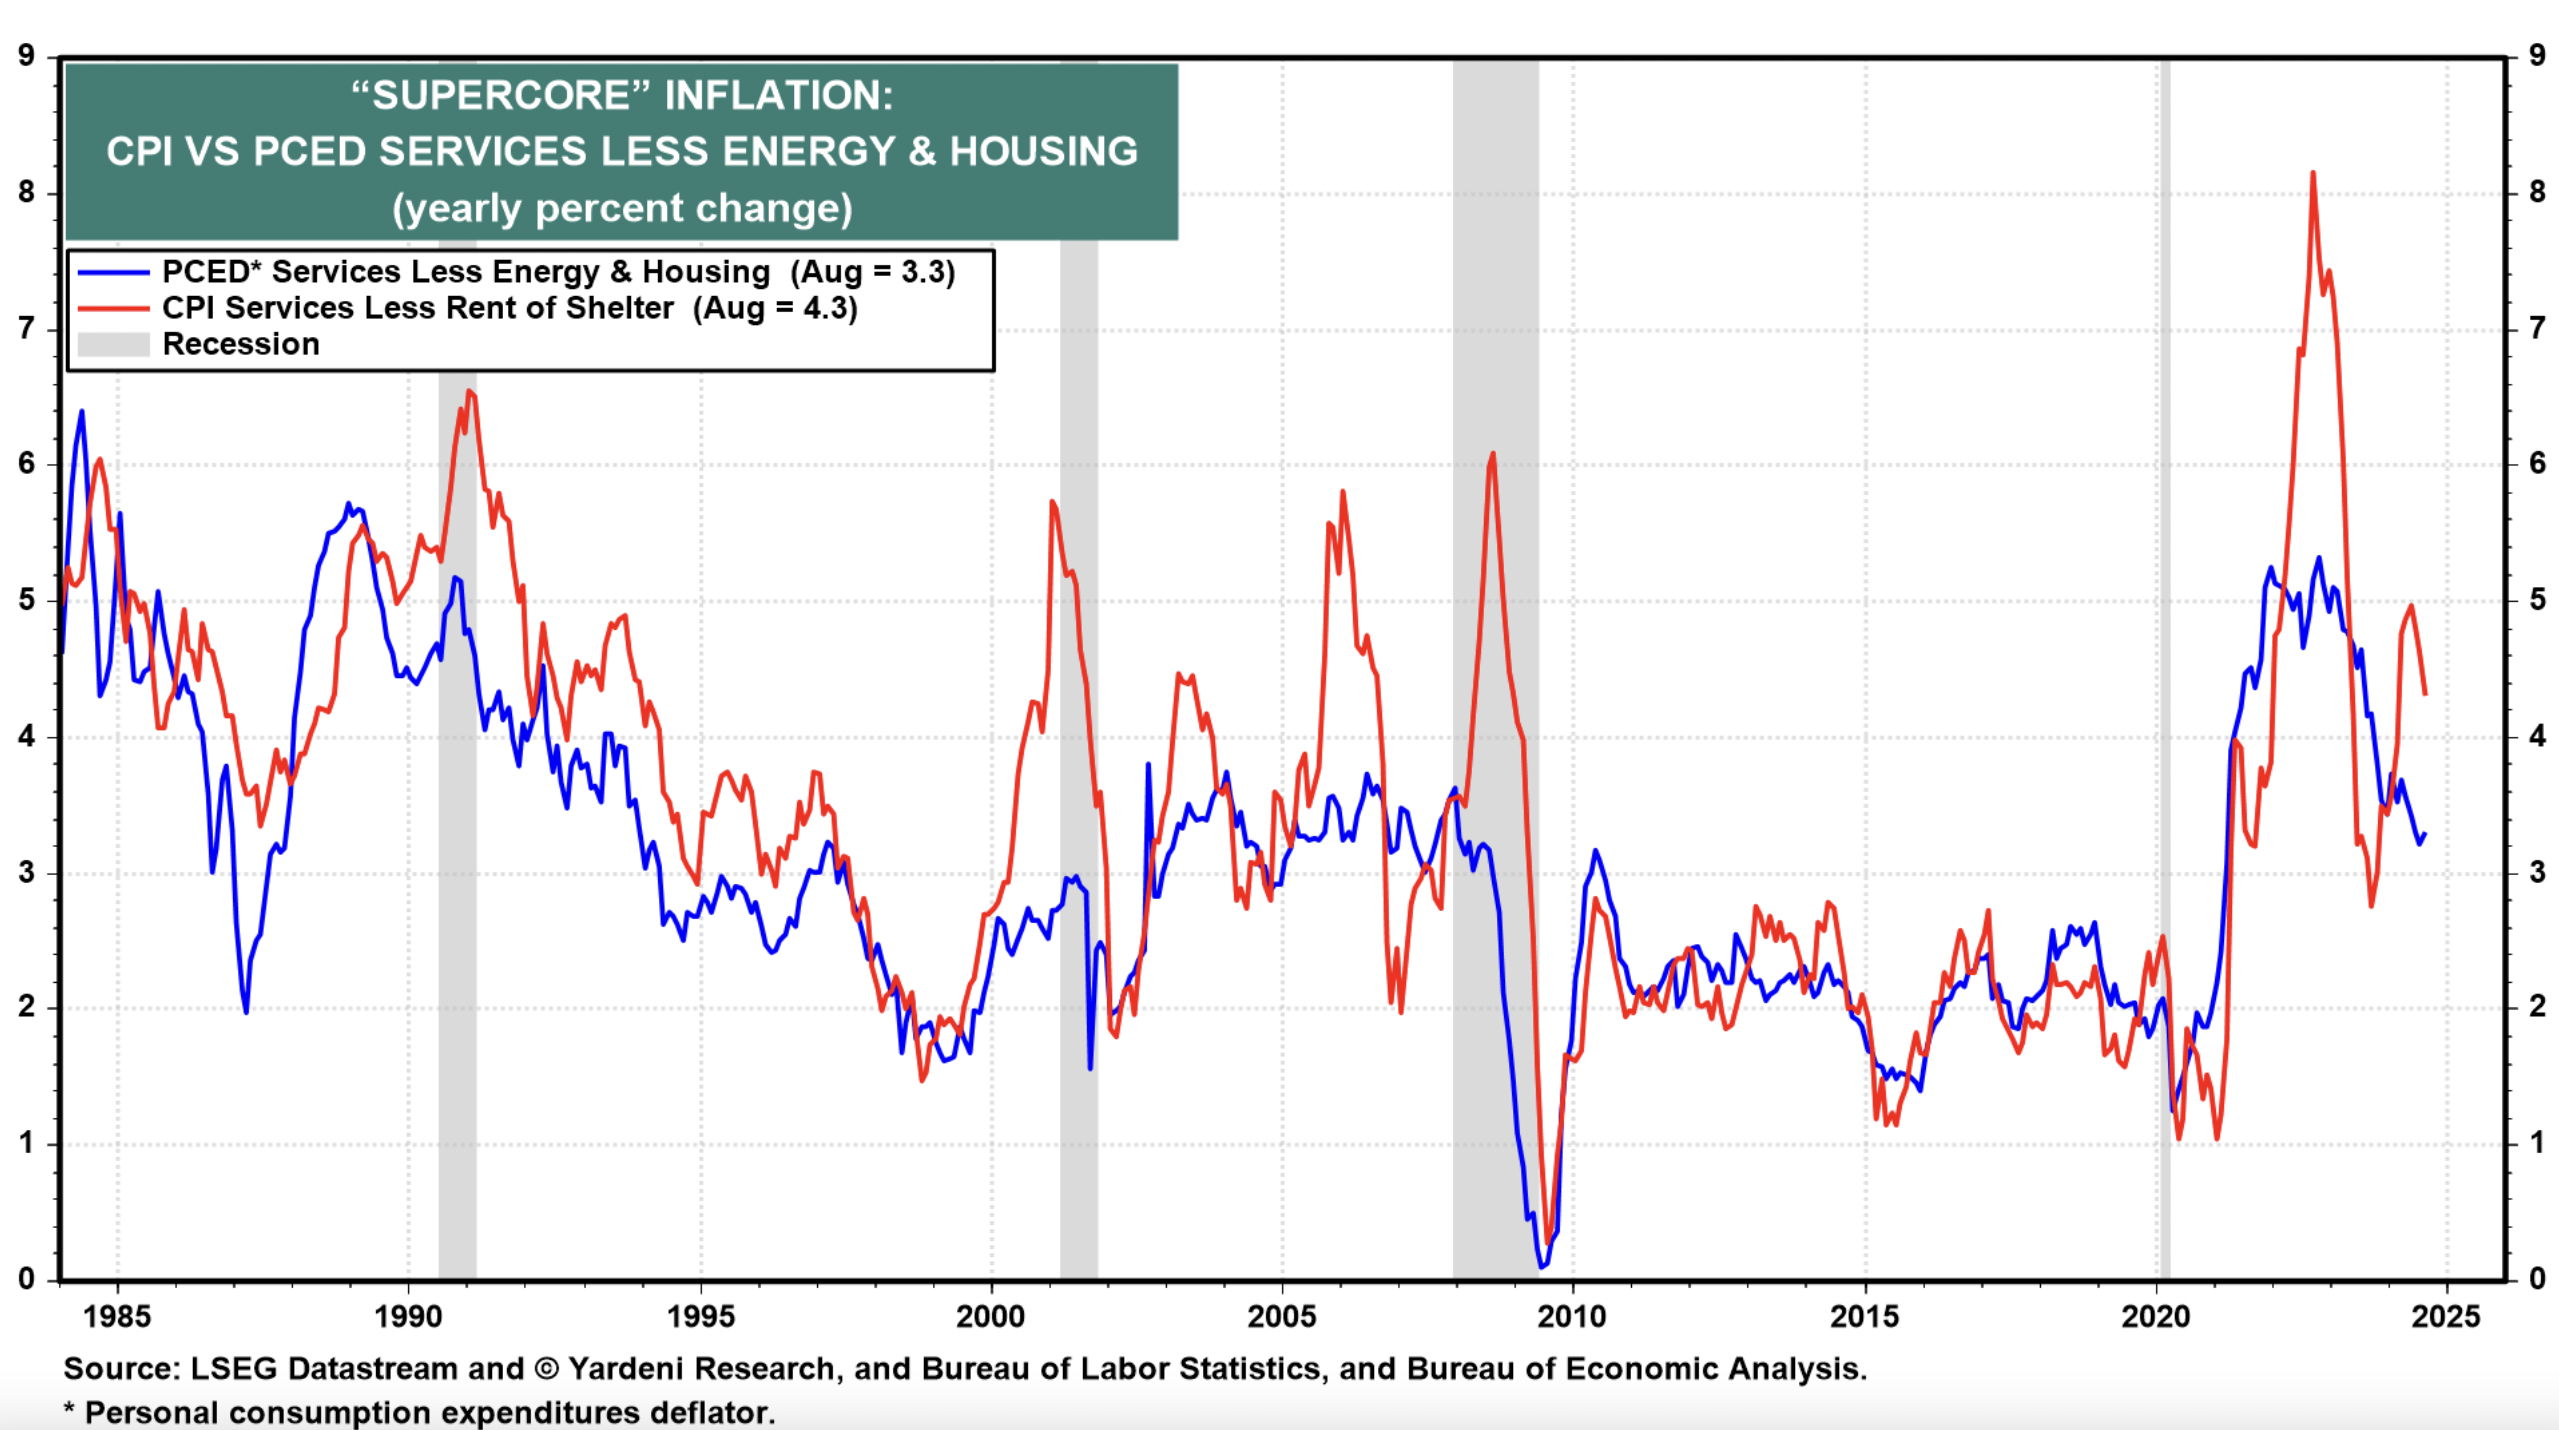
So their mission isn’t completely accomplished given that Fed Chair Jerome Powell first mentioned “supercore” inflation in his speech at the Hutchins Center on Fiscal and Monetary Policy at the Brookings Institution back on November 30, 2022. He made a big deal about it. He observed that it constituted more than half of the core PCE index. He no longer mentions it.
Meanwhile, layoffs remain subdued, as evidenced by the latest initial unemployment claims data.
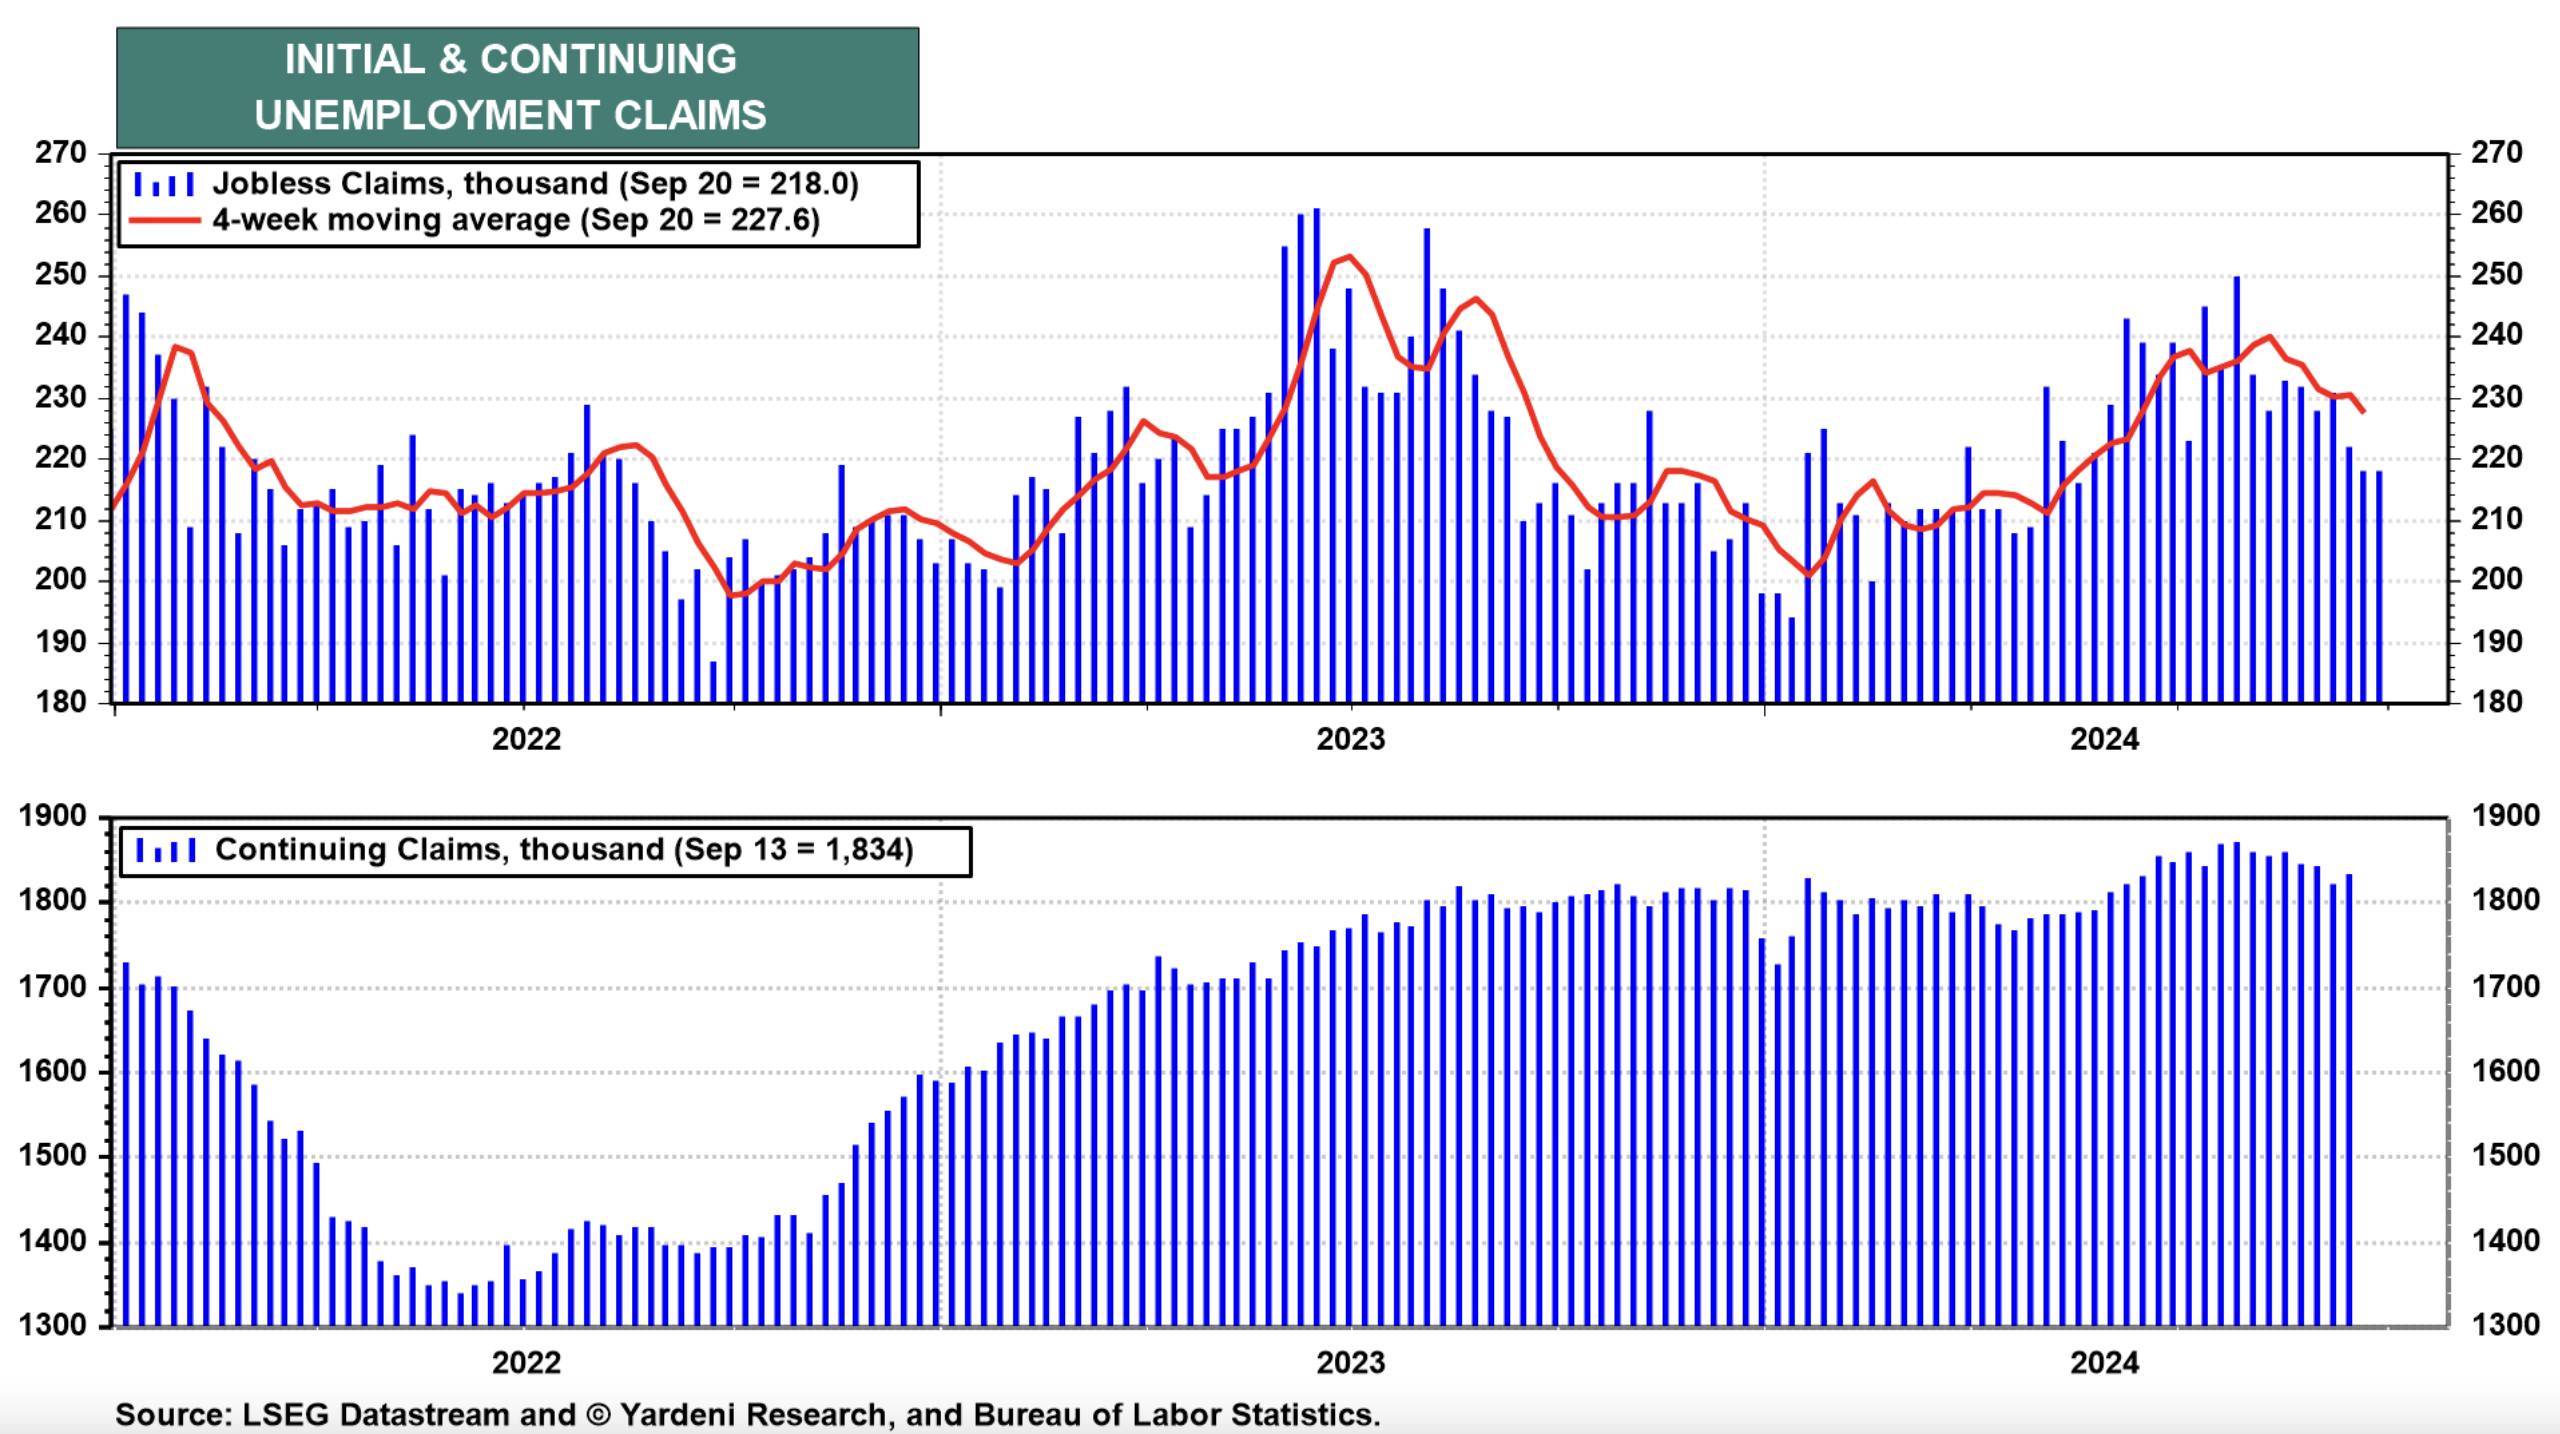
Fed officials have acknowledged that the problem in the labor market is that unemployed new entrants and reentrants into the labor force are staying unemployed longer because job openings have declined.
So their easing of monetary policy is aimed at boosting economic demand and the demand for labor, i.e., job openings, which remained above the pre-pandemic levels in July.
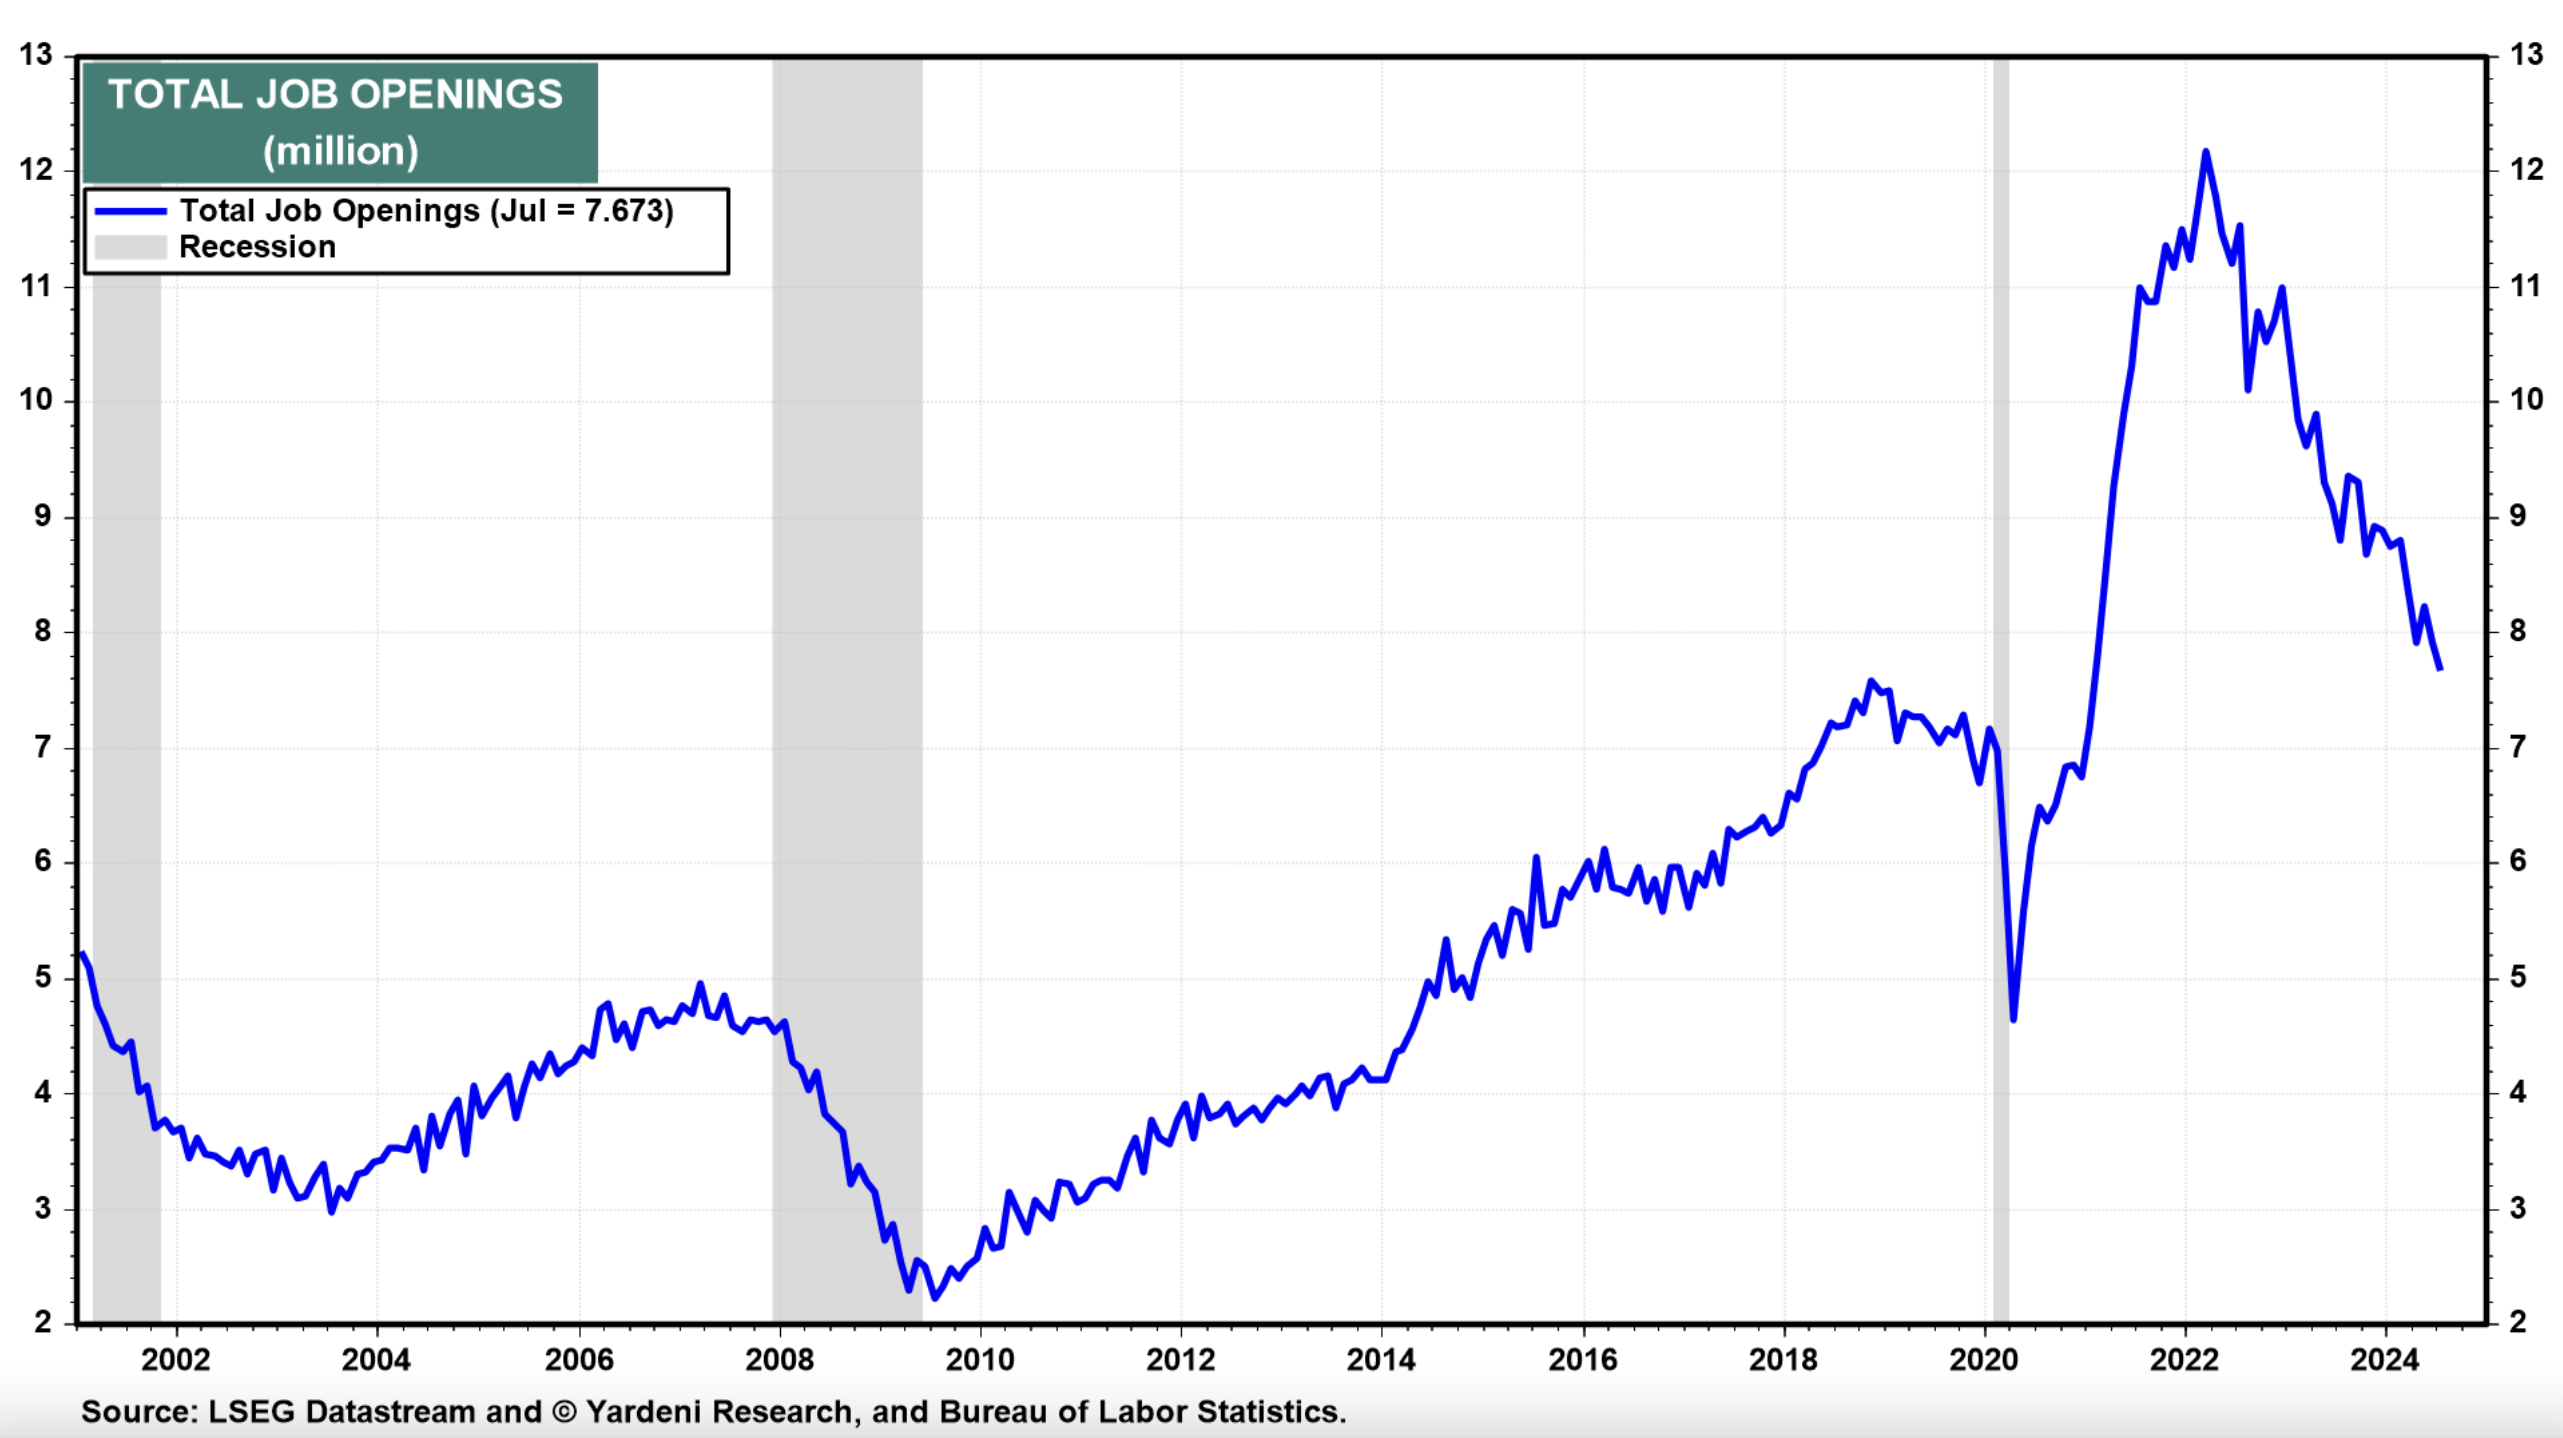
That’s great unless the unemployed don’t have the skills and the geographical locations to match the job openings that are currently available. That could heat up inflation. So could the fiscal policies of the next occupant of the White House.
So why did the Fed officials decide to ease? And why might they continue to ease?
They are willing to do so to avert a recession and to create more job openings. They are willing to risk inflating consumer prices as well as asset prices. We wish them luck. In any event, any remaining diehard hard-landers should remember the old adage: “Don’t fight the Fed!”
