60%+ returns in 2025: Here’s how AI-powered stock investing has changed the game
- Markets are cyclical, with downturns inevitably following upswings.
- If uncertainty is in the air, having a long-term perspective always helps.
- While past performance doesn't guarantee results, understanding historical trends can help navigate future volatility.
- For less than $9 a month, access our AI-powered ProPicks stock selection tool. Learn more here>>
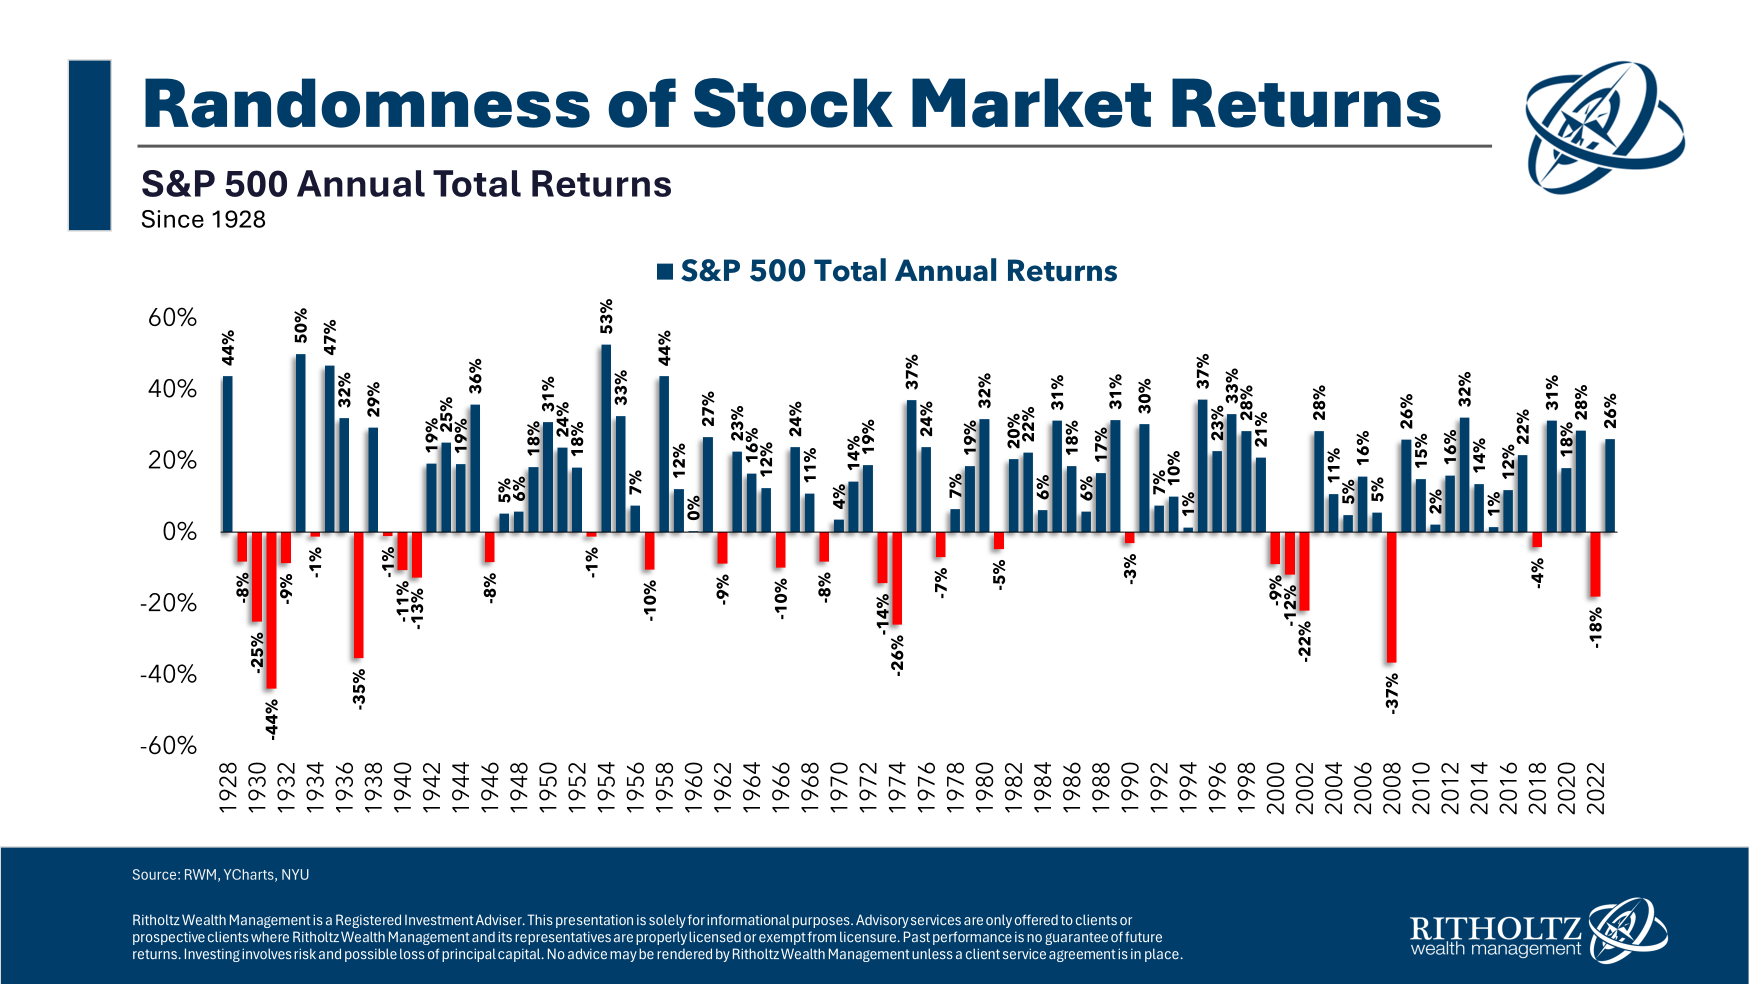
The S&P 500 chart below paints a clear picture: markets are cyclical. These cycles vary in length, intensity, and the emotions they evoke – from bullish optimism to fearful pessimism. But one thing remains constant: bearish trends inevitably follow bullish ones, and vice versa.

While the painful 2022 bear market may feel like a distant memory, let's not forget the long-term perspective. Despite the 2022 downturn, U.S. equities have delivered an impressive average annual return of +16% since 2019.
However, it's crucial to remember that past performance is not indicative of future results. The short term can be unpredictable, with the S&P 500's historical record showcasing a mix of positive and negative annual returns since 1928. Bullish trends are followed by declines, and vice versa. The cycle continues.

The key takeaway? While short-term volatility is inevitable, the S&P 500's historical performance suggests a long-term upward trajectory. Investors who stay focused on the long game and maintain a diversified portfolio are more likely to weather the inevitable downturns and experience the market's overall growth.
Should You Expect a Market Downturn at This Point?
While past performance might suggest an impending downturn or stagnation, it's never a guaranteed outcome. Instead of relying on past trends, we should focus on the most relevant indicators to gauge potential market movements.

The CBOE Market Volatility Index (VIX) plays a crucial role in this respect. This gauge of investor sentiment historically exhibits an inverse relationship with the S&P 500. Lower VIX readings often precede strong future returns for the S&P 500.
Daily VIX closes below 13 points, like those observed in the past six months, have historically led to annualized returns exceeding 40% – a significant jump compared to periods of higher volatility.
In essence, historically, low volatility seems to translate to more stable future returns for the market. While pullbacks and corrections are inevitable, it's important to maintain perspective and avoid emotional reactions.
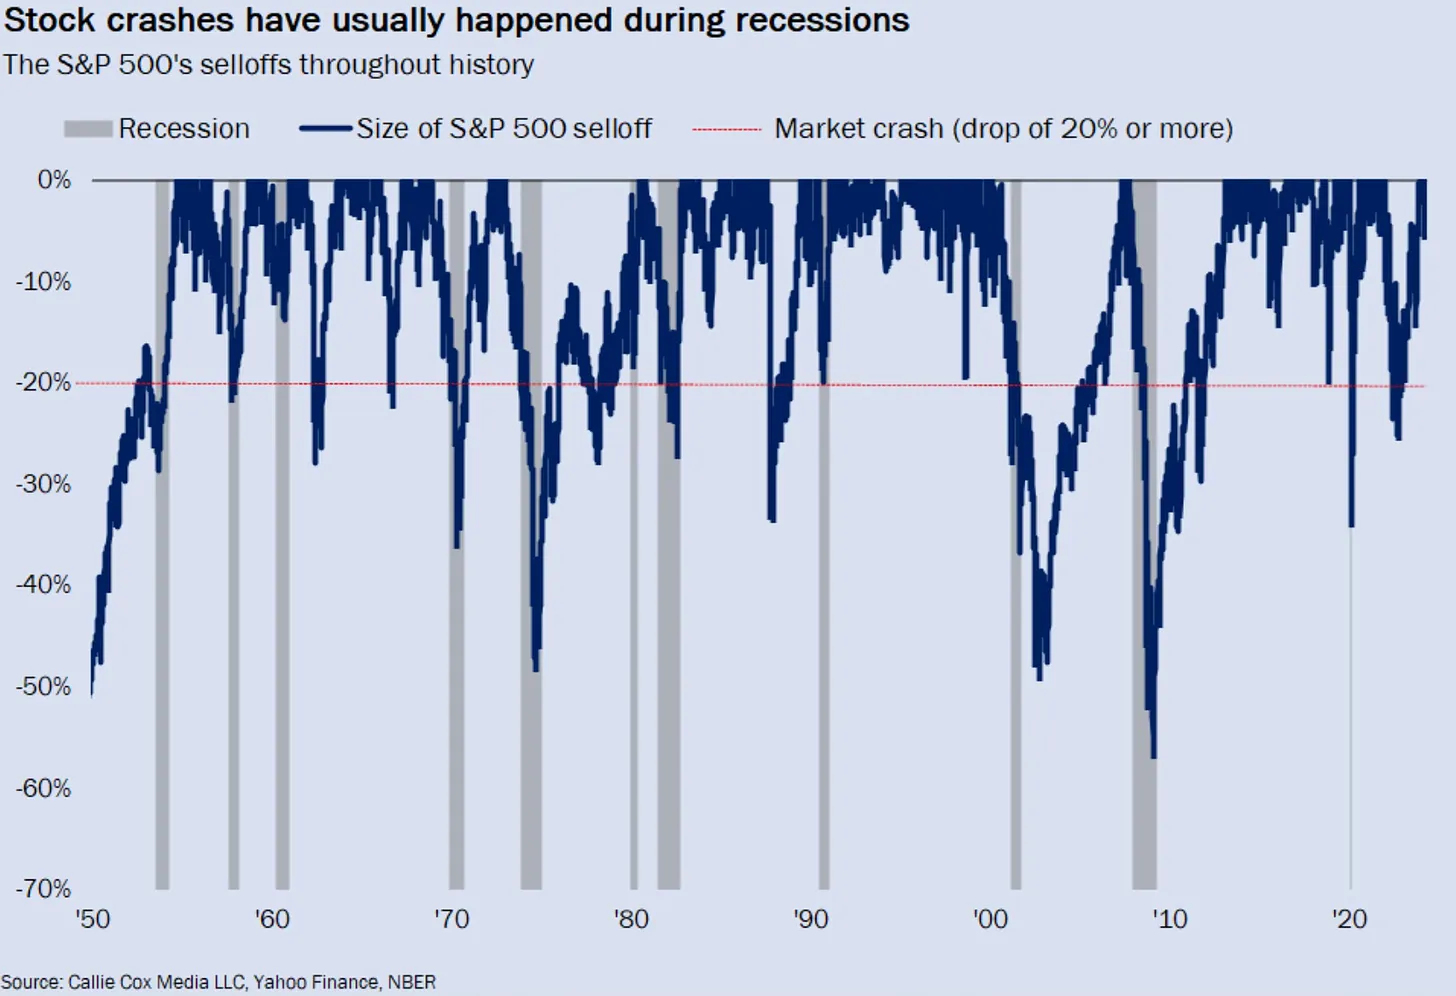
Remember, sharp declines in the stock market are not random occurrences, nor do they happen frequently. By staying informed and using the right tools, we can be better prepared to navigate market fluctuations.
Looking at historical data, crashes have occurred 13 times in the past 74 years, with 7 of those happening during recessions.

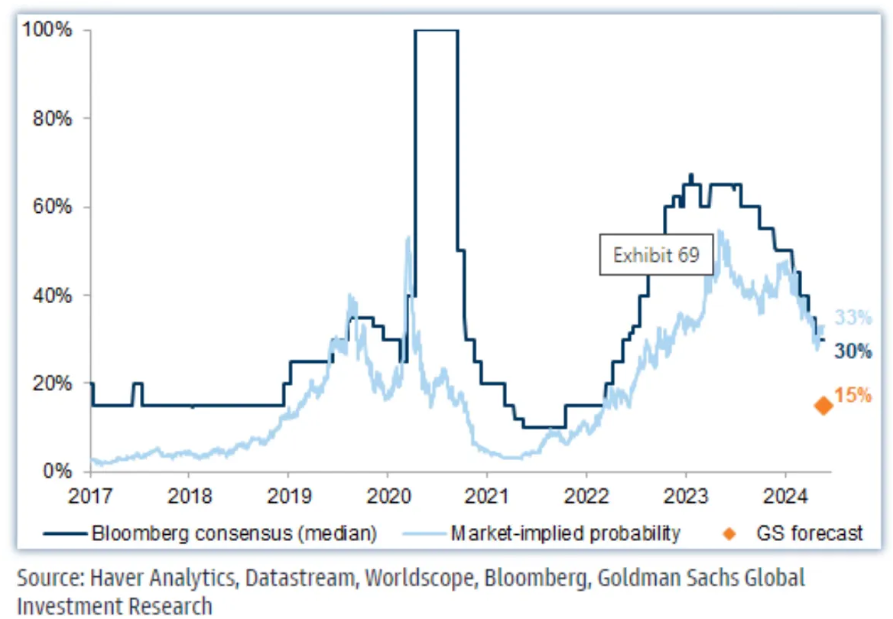
This trend naturally leads to the question: are we headed for a recession now?

While the implied probability of a recession in the US within the next year sits at 33%, Goldman Sachs paints a less concerning picture, estimating a much lower 15% chance. This difference isn't surprising – current economic conditions don't suggest a recession is imminent.
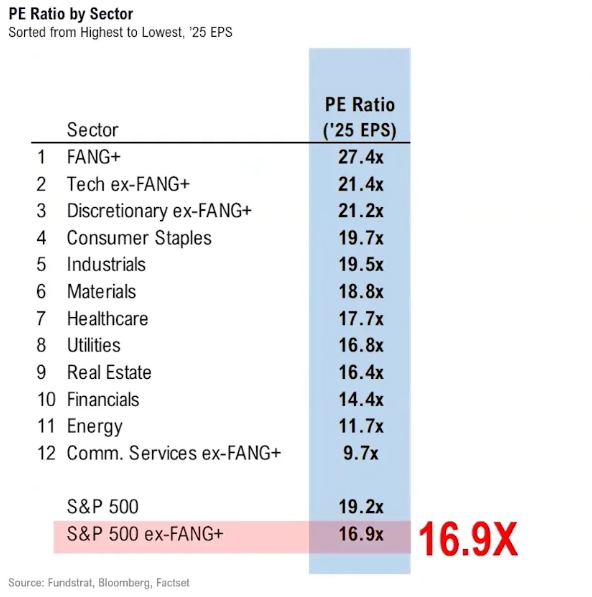
Furthermore, excluding tech stocks, the overall market trades at a P/E Ratio of 16.9x, which falls right in line with the historical average of the past 25 years. This suggests valuations may not be as high as some might believe.

***
If you want to analyze more stocks, follow us in upcoming hands-on lessons, and subscribe now with an additional discount by clicking on the banner image below.
Disclaimer: This article is written for informational purposes only; it does not constitute a solicitation, offer, advice, counsel or recommendation to invest as such it is not intended to incentivize the purchase of assets in any way. I would like to remind you that any type of asset, is evaluated from multiple points of view and is highly risky and therefore, any investment decision and the associated risk remains with the investor.

