Tyson Foods to close major Nebraska beef plant amid cattle shortage - WSJ

In this week’s newsletter, we’re going to run through the top 5 market charts on our radar right now.
Let’s dive right in...
GMI Chart 1: Bond Yields
US 2-year bond yields seem to be following a similar pattern as in 2000...
... the 10-year is also tracking this period closely...
... and when you consider that the aggregate speculative short position in US Treasuries just reached the most extreme level on record as a percentage of total open interest, the bond bull thesis is, in our opinion, becoming stronger by the day...
Additionally, DeMark daily 9 Setups have recently been quite successful in identifying inflection points on 10-year yields, and a new one was triggered on Thursday – something to keep an eye on...
GMI Chart 2: Carbon Allowances
Carbon is still messing around ahead of a larger break higher... eventually. If we break above 102 the targeted move is 133, roughly 50% higher from current levels. Definitely another one to watch...
GMI Chart 3: US Regional Banks (KRE)
The chart of the S&P Regional Banking ETF (NYSE:KRE) is not a bullish... it still feels like consolidation before a break lower...
GMI Chart 4: Dollar Index
The US dollar index (DXY) looks to be forming a big head-and-shoulders top. A break of 101 will lead to significant downside (but all within a secular dollar bull market). This should give risk assets a tailwind...
GMI Chart 5: Global Equities
Global equities just look like the mirror image of the DXY and appear to be forming a large head-and-shoulders bottom. Again, all eyes on a potential DXY breakdown of 101. That’s the signal to watch for and will probably suggest equities head much higher from here...
We’ll also throw in this chart on Ethereum that, as we’ve been flagging for quite some time, continues to trade a lot like Bitcoin during the 2014-2016 period... Vs. Ethereum (Current)")
The final two charts we'll leave you to mull over deal with positioning. At -7% of total open interest, speculative short positioning for the S&P 500 has just reached its highest level since August 2011...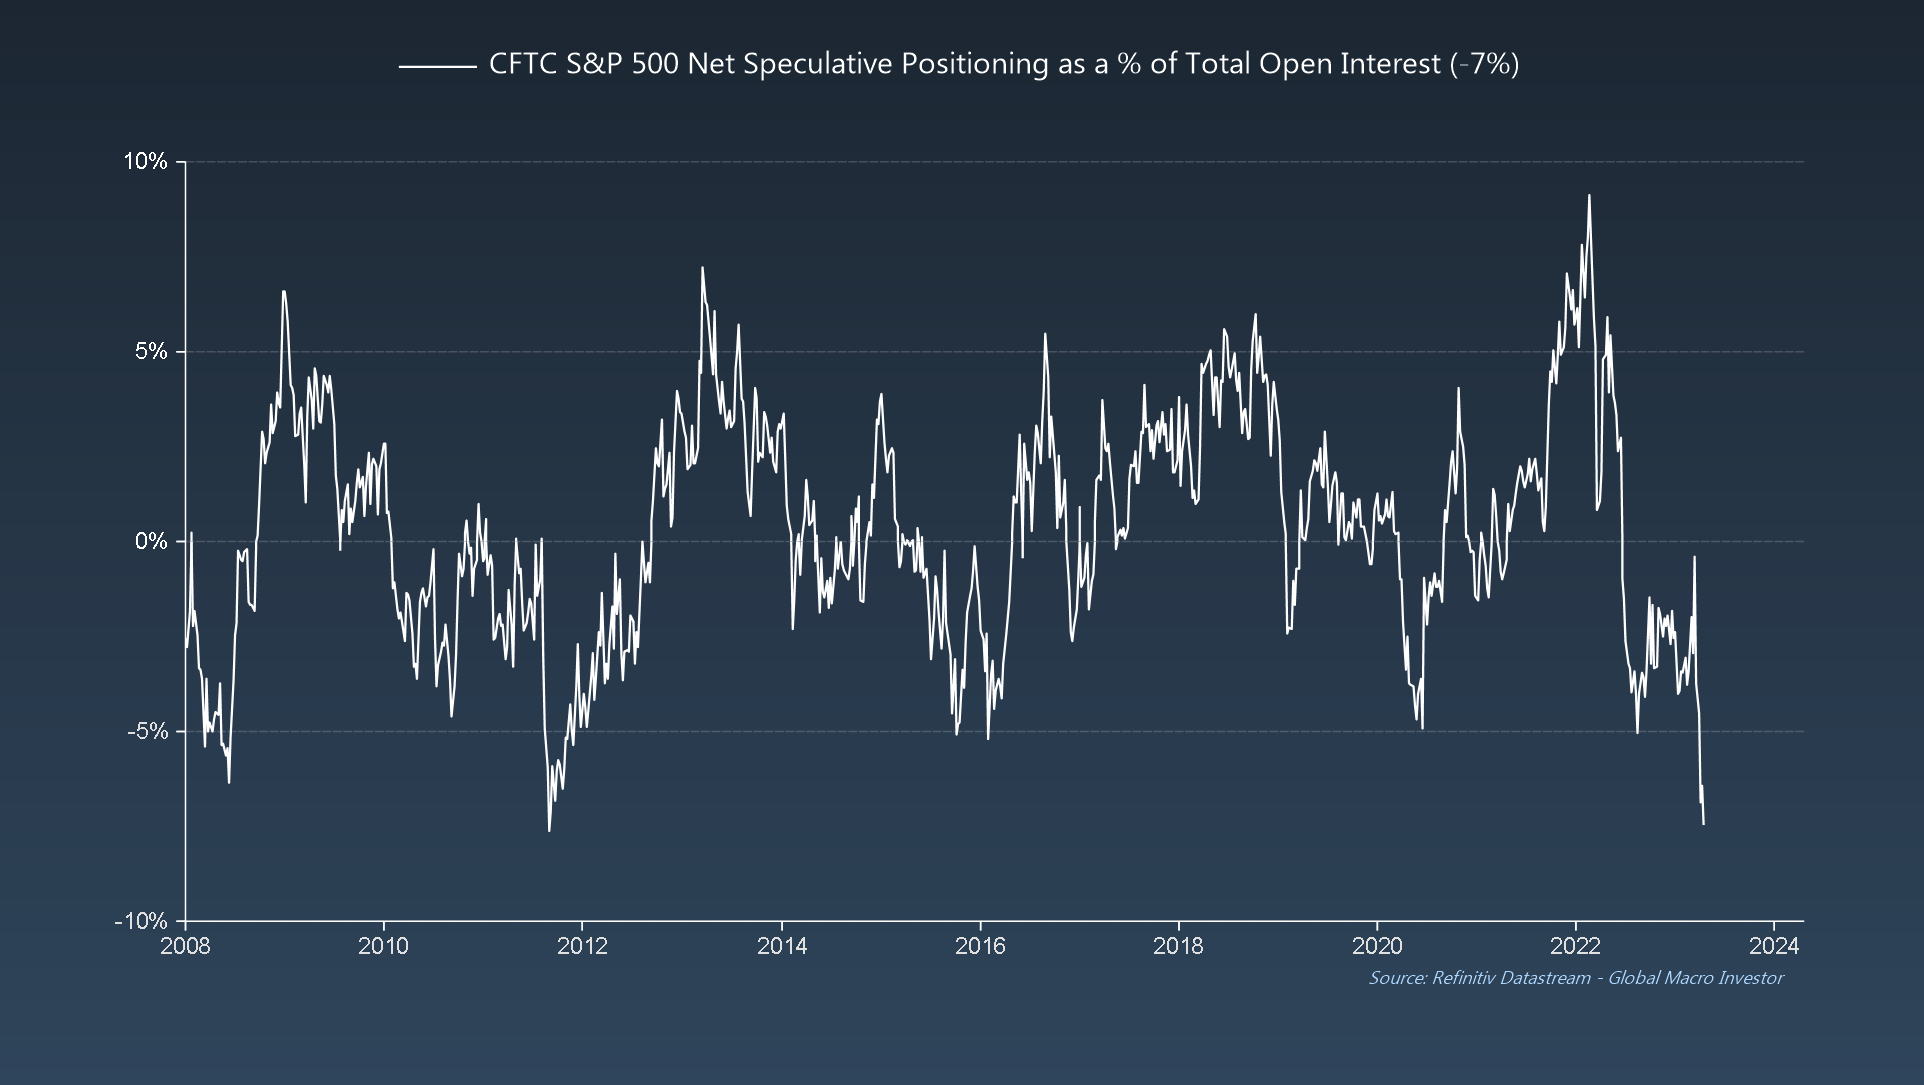
Also, according to the April BofA Fund Manager Survey, everyone is still SUPER bearish despite the slow grind higher in equities as we continue to climb the “wall of worry”.
Looking at the data, the pain trade is clearly still higher, not lower...
Next week, as we are writing the May GMI Monthly, we will not release a weekly update but, as ever, we will share something special with you from one of our recent GMI Monthly publications. Stay tuned!
***
Want to read these the moment they come out? Sign up entirely free for my newsletter, Short Excerpts From Global Macro Investor here. New articles published every single Sunday.