Moody’s upgrades Agnico Eagle’s rating to A3 on debt reduction
After details emerged on Friday of a Phase 1 trade deal between the U.S. and China, three of the four major U.S. indices—the Dow, S&P 500 and NASDAQ—all finished the week higher, with the SPX hitting a new record. Only the small cap, domestically focused Russell 2000 closed lower.
Though we're leary of the current trade agreement (more on that below), we expect stocks could keep going higher as risk-on sentiment returns to markets after the Fed remained dovish, the UK general election is now in the rearview mirror and trade seems to have found a more positive path to a resolution. Nonetheless, we continue to urge caution.
Lots of Noise, Limited Gains
Bulls and bears rumbled on Friday, over the merits of this version of the long-awaited, partial, U.S.-Sino trade deal, with the bulls ultimately garnering small advances. Still, one has to wonder why such long-awaited, good news had such a limited effect on global-facing equity benchmarks. Were Friday’s paltry advances simply a manifestation of “buy the rumor,” which occurred on Thursday, with Friday's market action just a “sell the news” response to the partial agreement?
Or is the muted market reception a sign of disappointment in the details of the Phase I deal and its questionable position as a progressive stepping stone toward a full trade resolution? Critics have characterized this version of the deal as a capitulation to China, rendering the past 18-months-worth of Trumpian saber rattling a lot of talk for an anticlimactic U.S. gain on trade with China. For his part, U.S. President Donald Trump characterized it as an “amazing deal.”
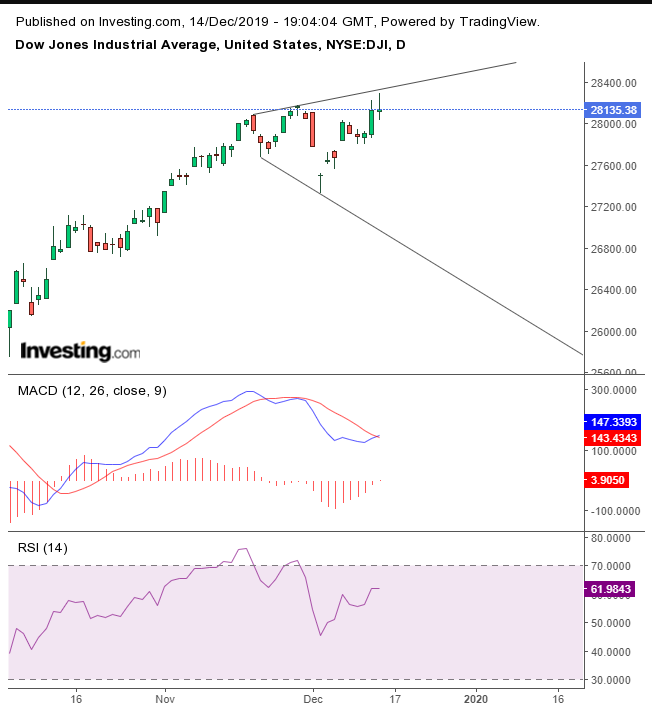
Throughout Friday's session, shares swung widely between gains and losses. Trading on the Dow Jones Industrial Average formed a High Wave candle.
The pattern is marked by very high highs and very low lows with a close near its opening, demonstrating a lot of noise but little progress. Sounds a lot like what's been going on with the trade deal.
Despite trade being the biggest market mover since the Fed reversed course on rates, the 30-component, mega cap index failed to post new all-time highs, closing up 0.13% since its Nov. 27 record. The MACD has not yet crossed into a buy signal and the RSI provided a negative divergence, as momentum failed against the rising price.
The price has also been developing a small broadening pattern, considered bearish, for the same reason a High Wave candle is a signal for a reversal. It denotes a lack of market leadership, as prices swing from side to side, reflecting investor indecision.
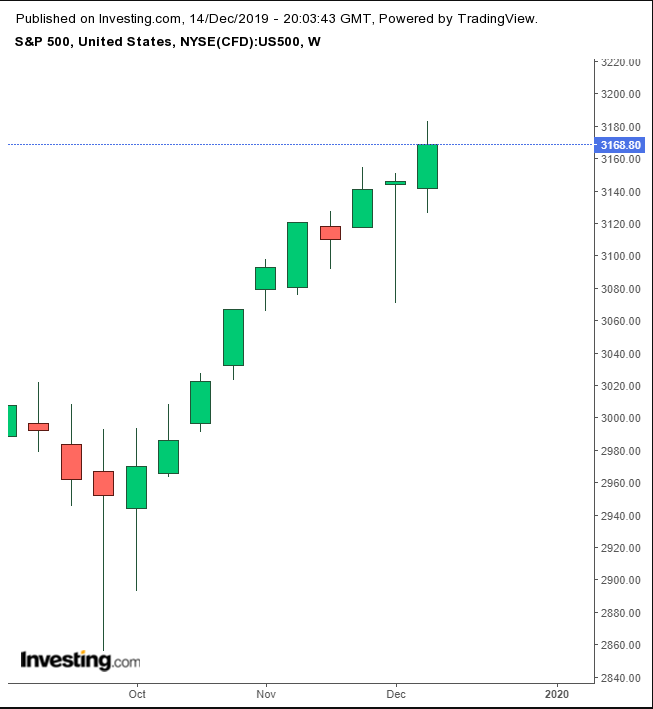
Meanwhile, all major U.S. indices climbed for the week—making it the 9th weekly gain out of 10 for the S&P 500 Index. Unlike the Dow, however, the SPX did post fresh records, though it exhibited all of the same technical question marks as the Dow.
Despite our being wary of trusting this Phase I agreement to deliver a sustainable path to a final trade resolution, on Friday, investors were able to check off as done three of the biggest recent market uncertainties: trade, the Fed—which unanimously voted to keep rates low and Chair Jerome Powell signaled the central bank will likely leave rates unchanged next year—and Brexit. A sweeping victory for UK Prime Minister Boris Johnson signals that his voters want to "Get Brexit Done."
But what would markets do without some sort of geopolitical risk to worry about? As if on cue, North Korea stepped up to possibly fill the void. The rogue Asian nation said Friday it had conducted another "crucial test" at a rocket launch site in advancing its efforts at building more reliable missiles (ICBMs) capable of reaching the U.S.
As well, assuring markets of possible additional worries, Brian Hook, a Senior State Department official said that Iran’s September attack on Saudi Aramco oil facilities was an act of war. Since then, however, WTI has jumped to the highest level since then.
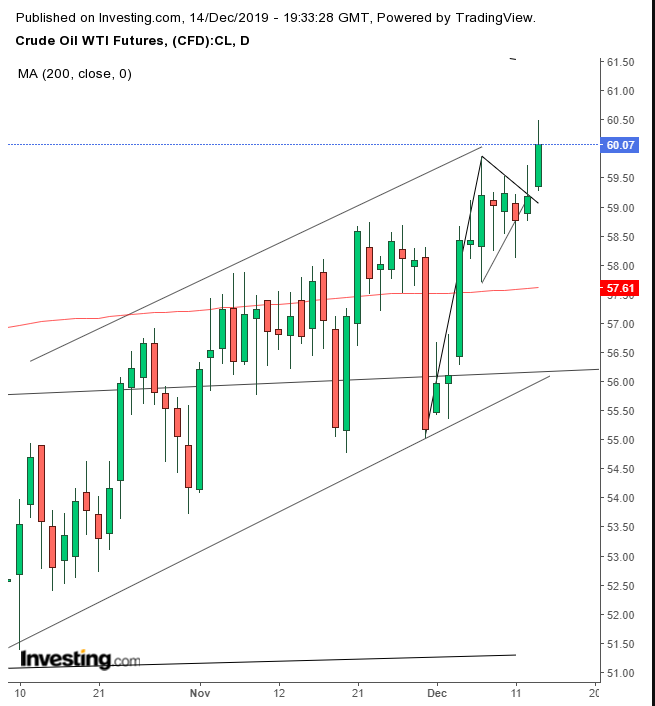
Oil completed a bullish pennant, as net-long bets on U.S. crude increased by 52%, the most in over three years, on optimism of a new era of demand following the U.S.-Sino trade deal. Still, the price of oil needs to contend with multiple bearish technical resistances ahead.
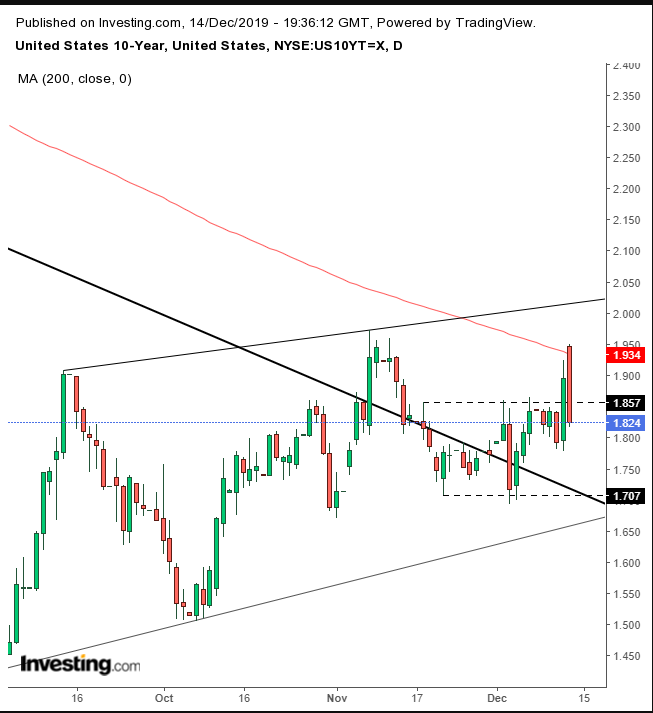
Underscoring the ambivalence expressed by stock traders on Friday, yields—including for the benchmark 10-year Treasury note—retreated. Technically, rates found resistance by the 200 DMA, touching the major MA for the first time since falling below it during December 2018, when it fell back into the range within which it has been trapped, hovering around the long-term downtrend line since November 2018.
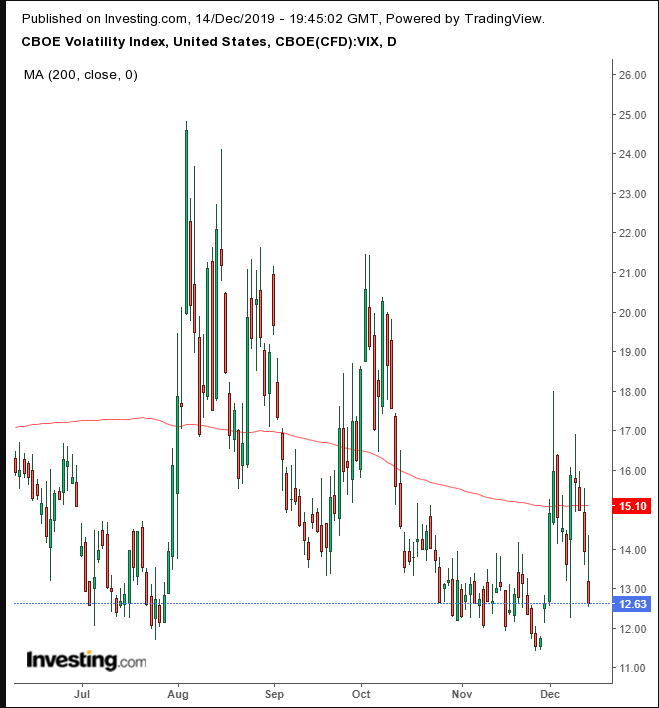
Traders betting on U.S. futures expected volatility to drop. And indeed, the VIX declined for the fourth straight day, toward the late-November lows. Diminshed volatility is seen as a prelude for a stock advance, provided, of course, it's not the calm before the storm, a result of investor complacency.
The Week Ahead
All times listed are EST
Sunday
21:00: China – Industrial Production: expected to rise to 5.0% from 4.7% YoY.
Monday
3:30: Germany – Manufacturing PMI: seen to advance to 44.5 from 44.1, though still below the 50 boom/bust level.
19:30: Australia – RBA Meeting Minutes
Tuesday
8:30: U.S. – Building Permits: probably declined to 1.400M from 1.461M.
Wednesday
4:00: Germany – Ifo Business Climate Index: forecast to edge up to 95.5 from 95.0.
4:30: UK – CPI: expected to retreat to 1.4% from 1.5%.
5:00: Eurozone – CPI: likely to remain flat at 1.0%.
10:30: U.S. – Crude Oil Inventories: last week saw an uptick to 0.822M bbl.
Thursday
4:30: UK – Retail Sales: anticipated to have jumped to 0.3% from -0.1%.
7:00: UK – BoE Interest Rate Decision: the central bank is expected to hold rates steady at 0.75%.
8:30: U.S. – Philadelphia Fed Manufacturing Index: seen to drop to 8.0 from 10.4.
18:30: Japan – National Core CPI: likely to have moved higher, from 0.4% previously to 0.5% in November.
Friday
4:30: UK – GDP: expected to remain flat at 0.3% QoQ and at 1.0% YoY.
8:30: U.S. – GDP: forecast to remain steady at 2.1% QoQ.
