Gold prices tick higher on fresh US tariff threats, Fed rate cut hopes

Introduction & Market Context
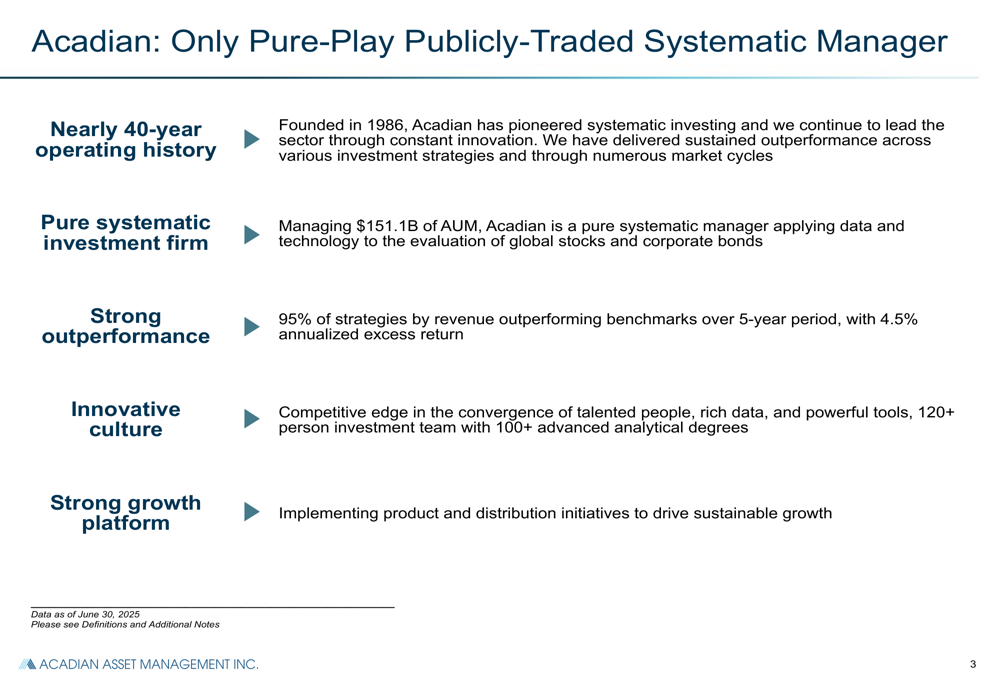
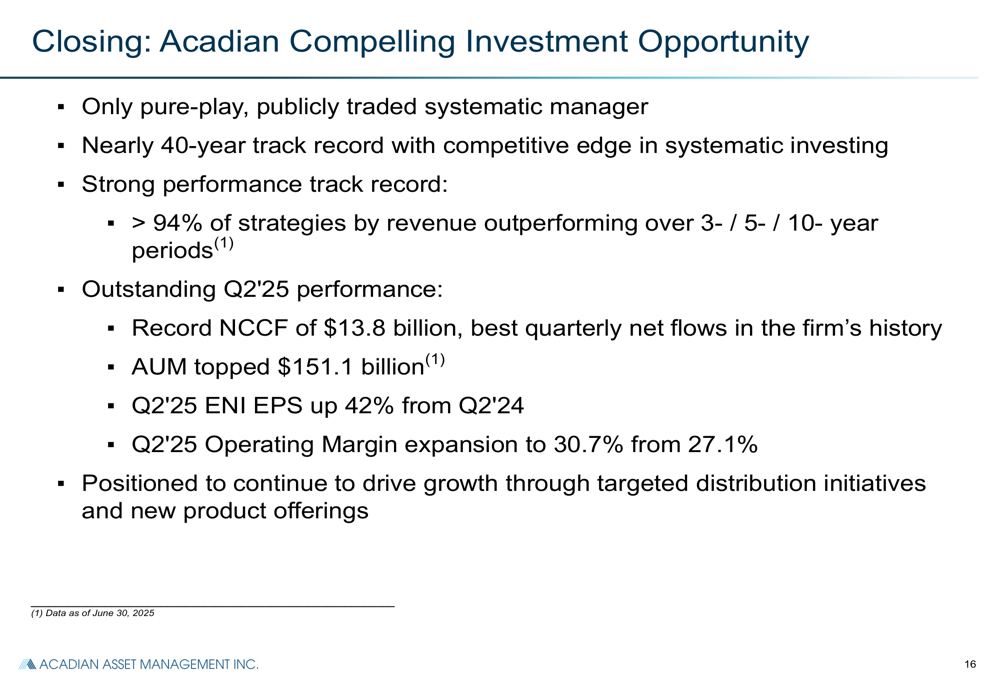
Acadian Asset Management reported its second quarter 2025 financial results on July 31, 2025, showcasing record assets under management (AUM) and net flows despite mixed earnings results. As the only pure-play, publicly traded systematic manager with a nearly 40-year operating history, Acadian has positioned itself as a leader in quantitative investment strategies.
The company’s presentation highlighted its strong investment performance track record, with 95% of strategies by revenue outperforming benchmarks over a 5-year period, generating a 4.5% annualized excess return. This performance comes amid a period of continued growth following a strong first quarter.
Quarterly Performance Highlights
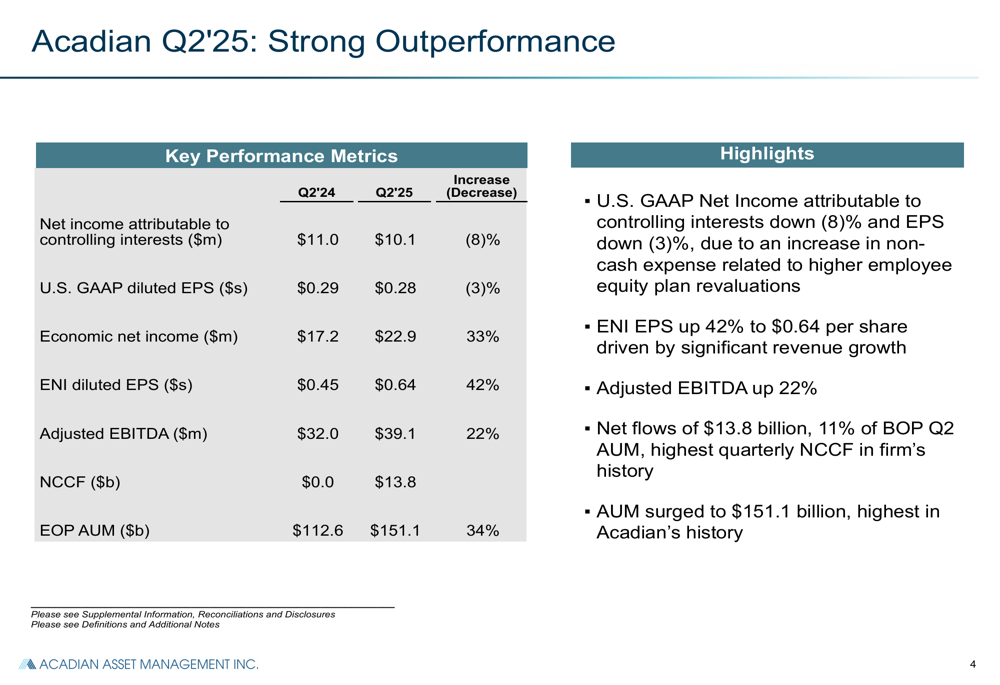
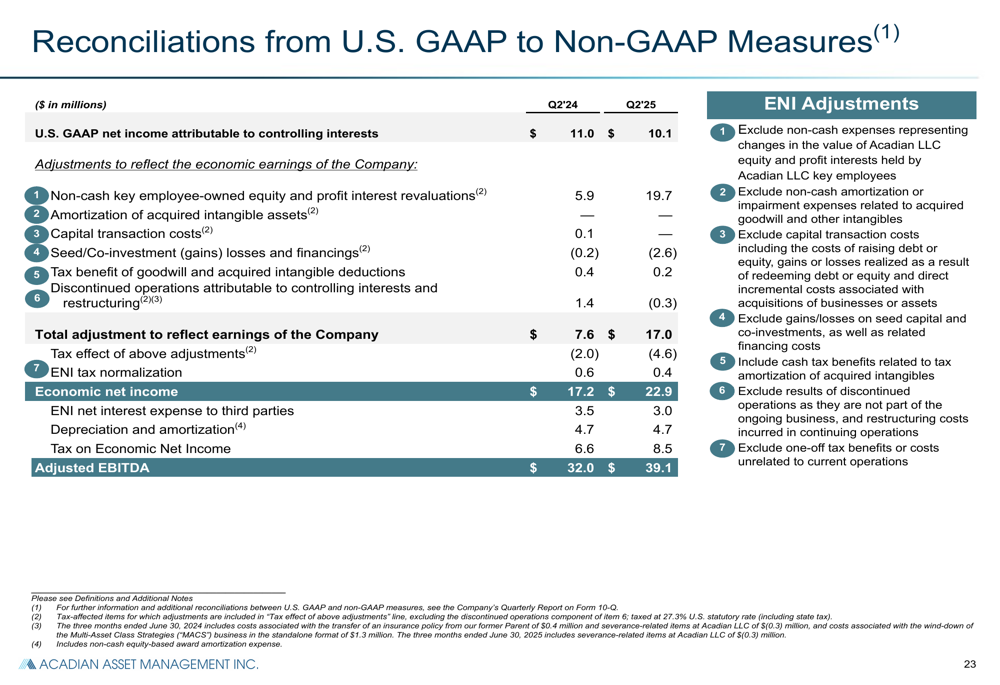
Acadian’s Q2 2025 results revealed a contrast between GAAP and non-GAAP metrics. While GAAP net income attributable to controlling interests decreased by 8% to $10.1 million and GAAP diluted EPS fell by 3.4% to $0.28, the company’s Economic Net Income ( ENI (BIT:ENI)) metrics showed substantial growth. ENI diluted EPS increased by 42.2% to $0.64, and Adjusted EBITDA rose by 22.2% to $39.1 million.
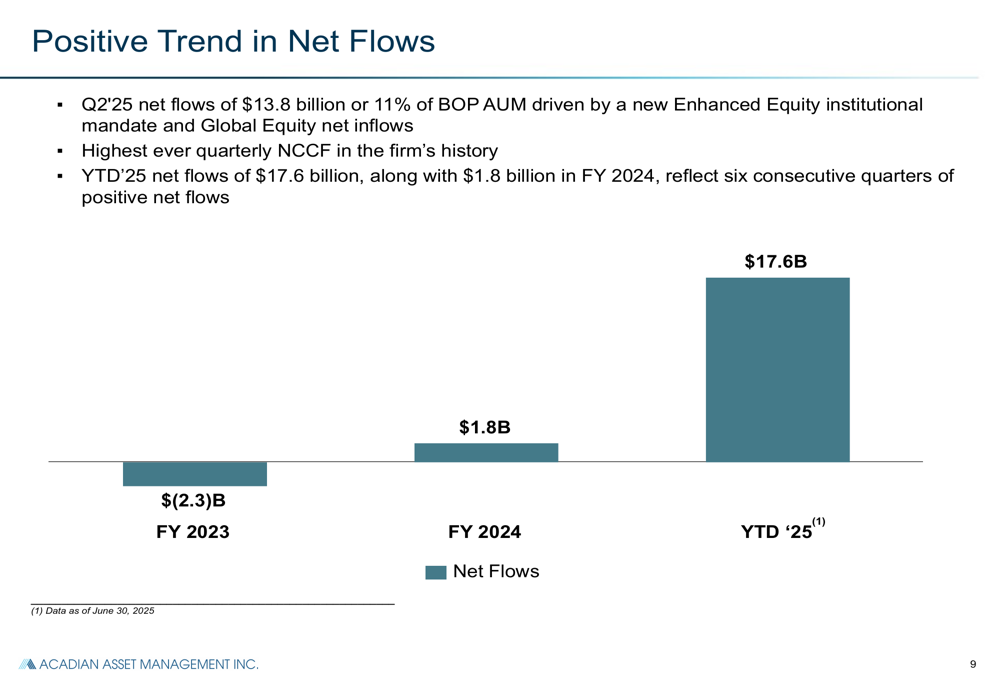
The most notable achievement was Acadian’s record-breaking net client cash flows (NCCF) of $13.8 billion, the highest quarterly NCCF in the firm’s history. This contributed to AUM reaching $151.1 billion, a 34% increase from Q2 2024 and the highest level in Acadian’s history.
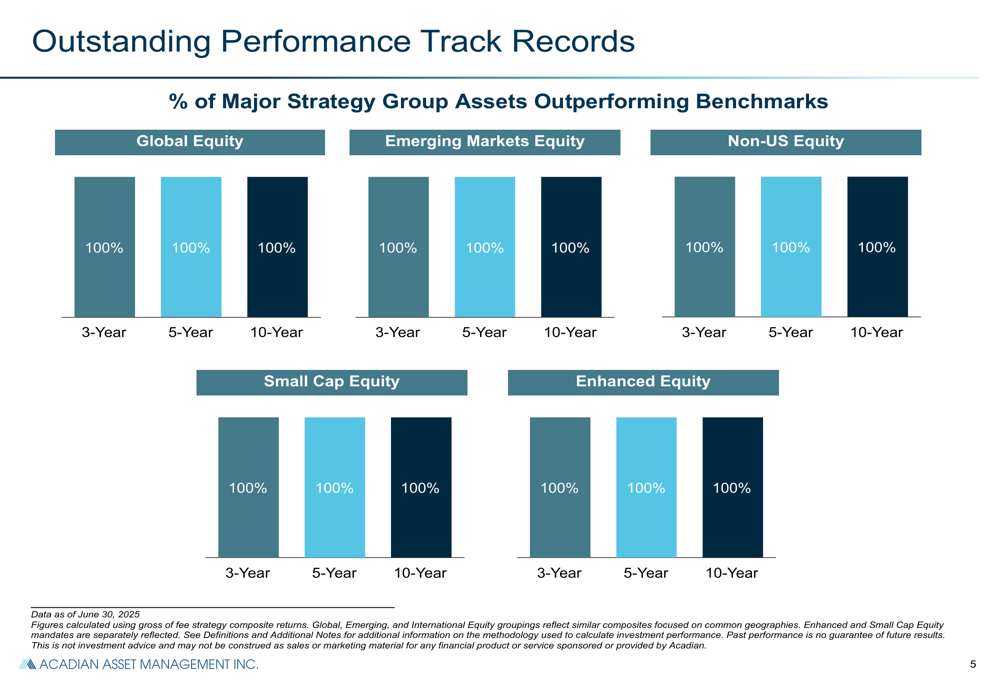
The company’s investment performance remained strong across all major strategy groups. According to the presentation, 100% of assets in Global Equity, Emerging Markets Equity, Non-US Equity, Small Cap Equity, and Enhanced Equity outperformed benchmarks over 3-year, 5-year, and 10-year periods.
This performance represents a significant acceleration from Q1 2025, when the company reported AUM of $121.9 billion and net flows of $3.8 billion. The substantial jump in both metrics indicates strong momentum in Acadian’s business.
Detailed Financial Analysis
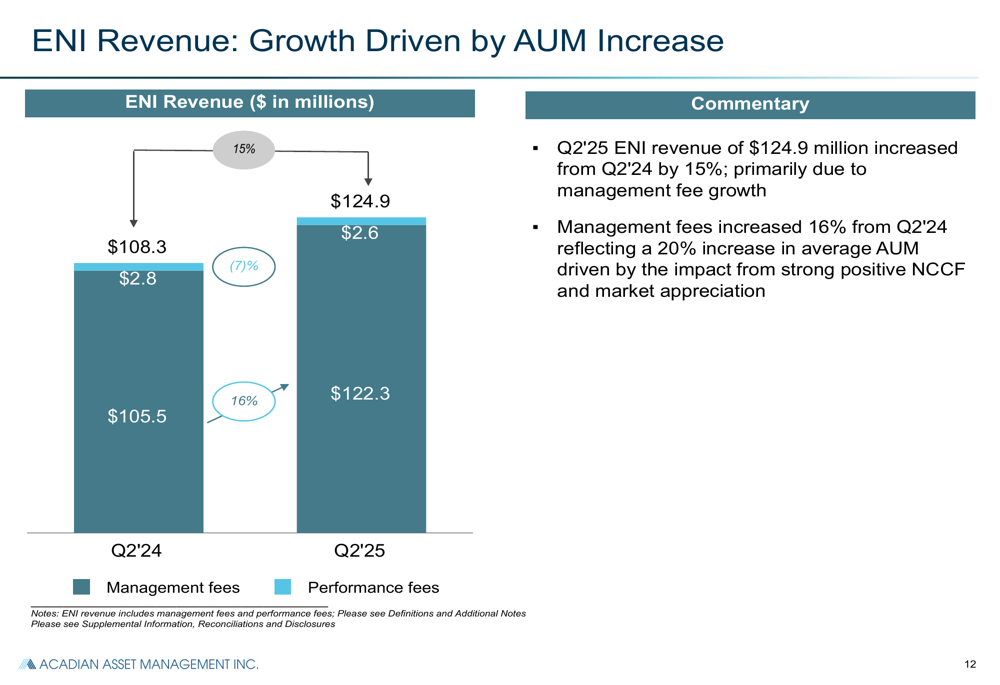
Acadian’s ENI revenue increased by 15% from Q2 2024 to $124.9 million, primarily driven by management fee growth of 16%. Performance fees remained relatively stable at $2.6 million compared to $2.8 million in the prior year period.
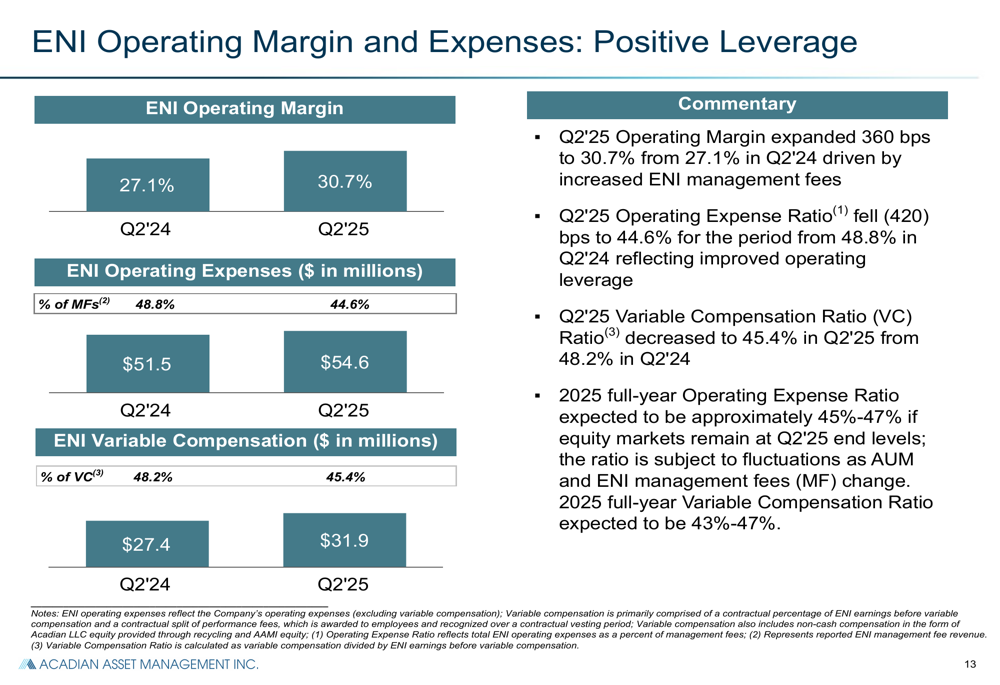
The company demonstrated improved operational efficiency, with the ENI operating margin increasing by 360 basis points to 30.7% in Q2 2025. This improvement was supported by a decrease in the ENI operating expense ratio to 44.6% from 48.8% in Q2 2024, and a reduction in the variable compensation ratio to 45.4% from 48.2%.
The reconciliation between GAAP and non-GAAP measures provides insight into the differences between the reported metrics. The company’s adjusted EBITDA of $39.1 million represents a significant increase from $32 million in Q2 2024, highlighting the underlying strength of the business despite the decline in GAAP earnings.
Strategic Initiatives & Outlook
Acadian’s global distribution platform has been a key driver of growth, with gross sales reaching $28 billion year-to-date in 2025, compared to $21 billion for the full year 2024. The company maintains a strong institutional client base, with 6 clients among the top 20 global asset owners and 26 clients among the top 50 U.S. retirement plans.
The company has now achieved six consecutive quarters of positive net flows, a significant improvement from the negative $2.3 billion in net flows for fiscal year 2023. Year-to-date net flows for 2025 stand at $17.6 billion, substantially higher than the $1.8 billion for the entire fiscal year 2024.
Looking forward, Acadian highlighted its position as a compelling investment opportunity, citing its strong performance record, record NCCF and AUM, and ENI EPS growth of 42% from Q2 2024. The company indicated it is positioned to drive further growth through targeted initiatives, though specific details were not provided in the presentation.
Capital Allocation
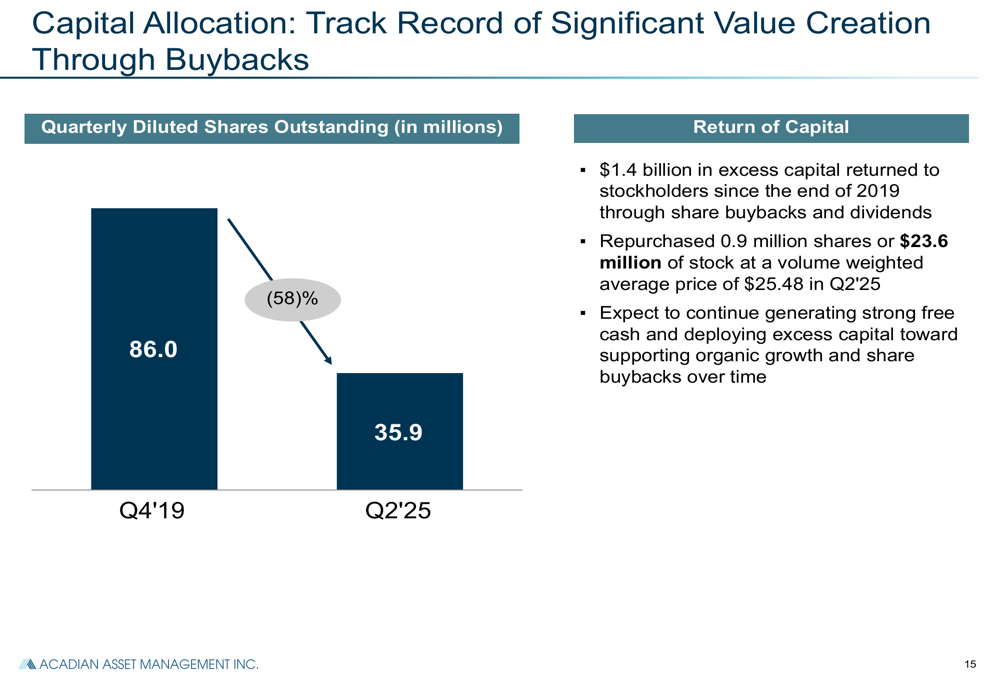
Acadian’s capital management strategy continues to focus on returning capital to shareholders. Since the end of 2019, the company has returned $1.4 billion in excess capital through share buybacks and dividends. In Q2 2025 alone, Acadian repurchased 0.9 million shares for $23.6 million at an average price of $25.48.
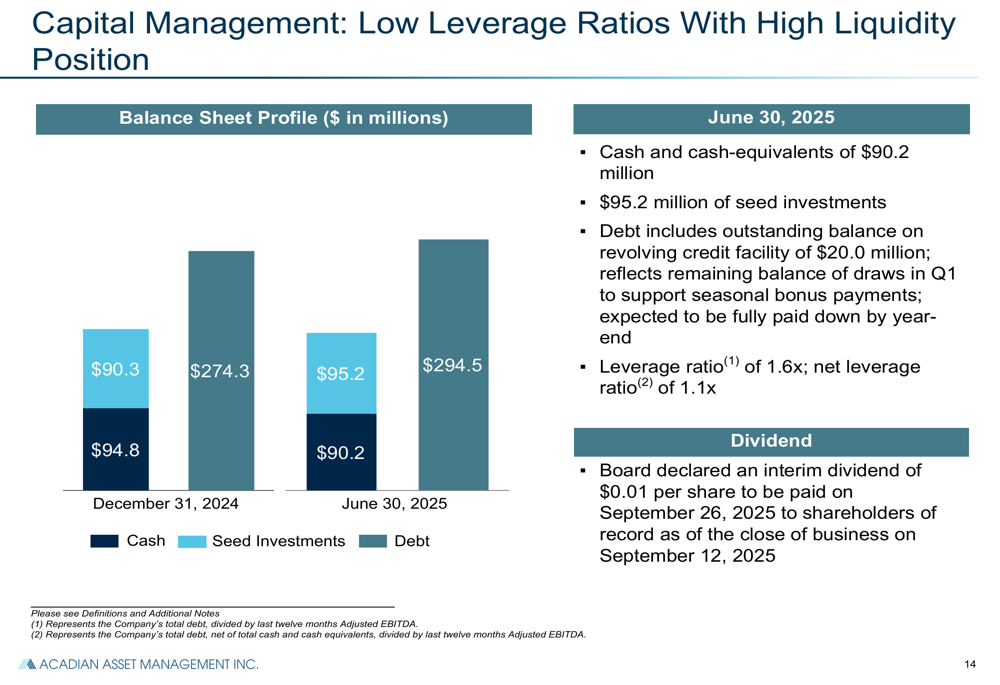
The company’s balance sheet remains strong, with cash and cash-equivalents of $90.2 million and seed investments of $95.2 million as of June 30, 2025. Acadian’s outstanding debt balance stands at $20.0 million, with a leverage ratio of 1.6x and a net leverage ratio of 1.1x. The board declared an interim dividend of $0.01 per share to be paid.
Overall, Acadian Asset Management’s Q2 2025 results demonstrate the company’s ability to attract significant client assets and generate strong non-GAAP earnings growth despite challenges in GAAP metrics. With record AUM, impressive net flows, and a consistent track record of outperformance, Acadian appears well-positioned to continue its growth trajectory in the systematic investment management space.
Full presentation:
This article was generated with the support of AI and reviewed by an editor. For more information see our T&C.