Bitcoin price today: dips to $92k as Fed cut doubts spark risk-off mood

Introduction & Market Context
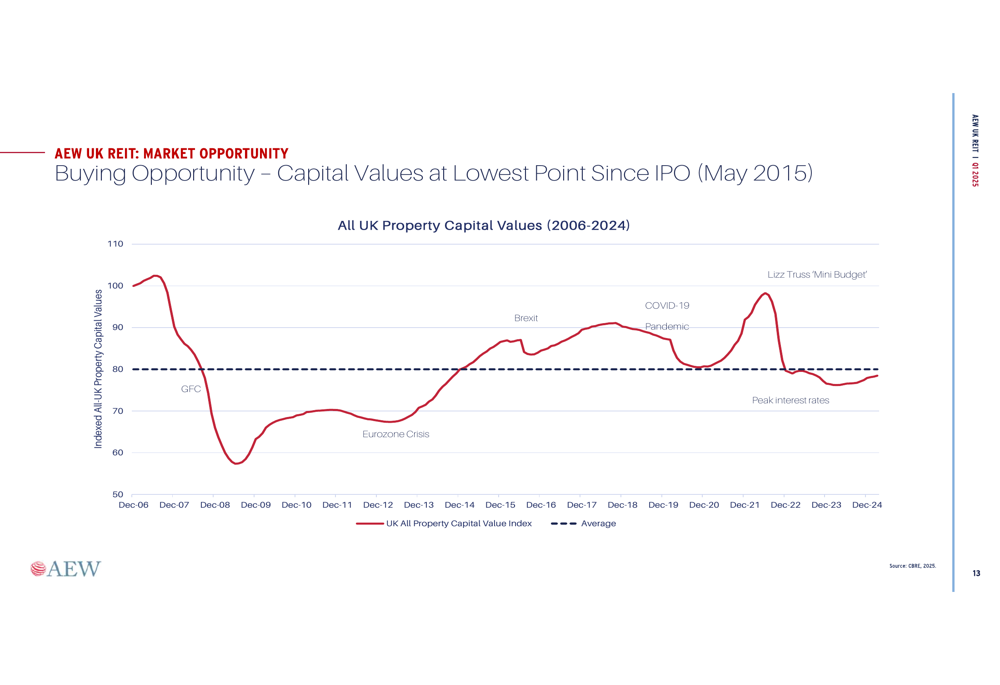
AEW UK REIT (LON:AEWU) presented its Q1 2025 update in May, highlighting the company’s continued outperformance against benchmarks and peer groups while maintaining its consistent dividend policy. The UK-focused REIT emphasized that current market conditions present significant buying opportunities, with UK commercial property capital values at their lowest point since the company’s IPO in 2015.
The REIT continues to implement its value investment strategy, focusing on mispriced assets across various sectors of the UK commercial property market. With a portfolio valued at £204.5 million spread across 33 properties and 124 tenants, AEW UK REIT maintains a diversified approach while targeting high-yielding assets.
Portfolio Performance Highlights
As of March 31, 2025, AEW UK REIT reported a net asset value (NAV) of £174.44 million, equivalent to 110.1 pence per share. The company’s shares were trading at 101.4 pence, representing a 7.9% discount to NAV. The REIT has maintained its quarterly dividend of 2 pence per share (8 pence annually, representing approximately an 8% yield) for 38 consecutive quarters since Q1 2016.
The portfolio’s performance metrics remain strong, with a net initial yield of 7.97% and a reversionary yield of 8.76%, indicating potential for income growth. The vacancy rate stands at 7.50%, with a weighted average unexpired lease term (WAULT) of 4.1 years to break and 5.7 years to expiry.
As shown in the following key portfolio statistics:
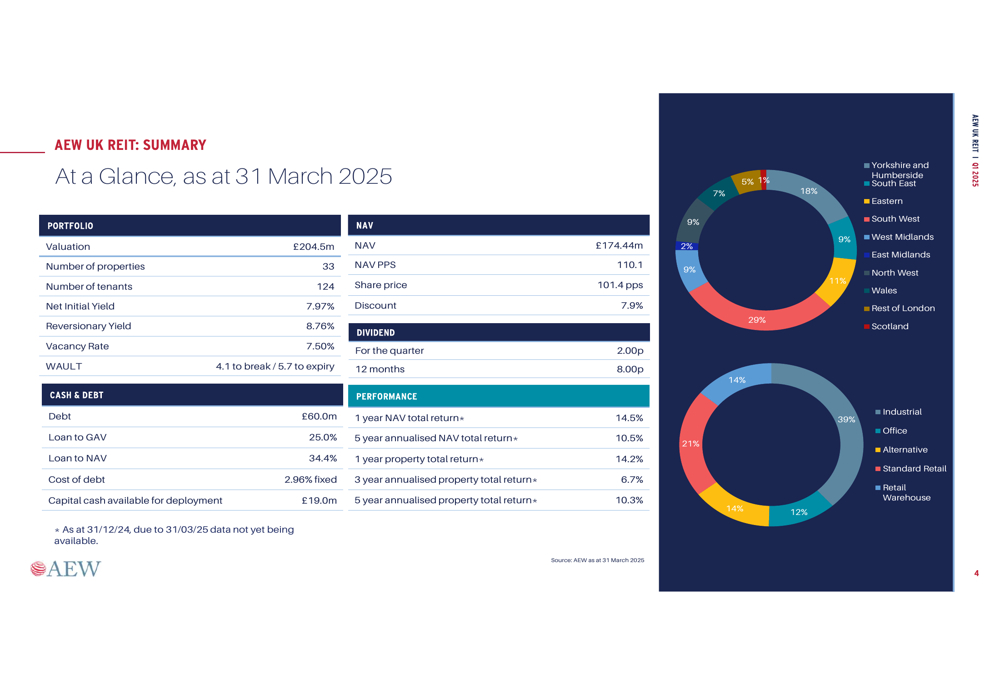
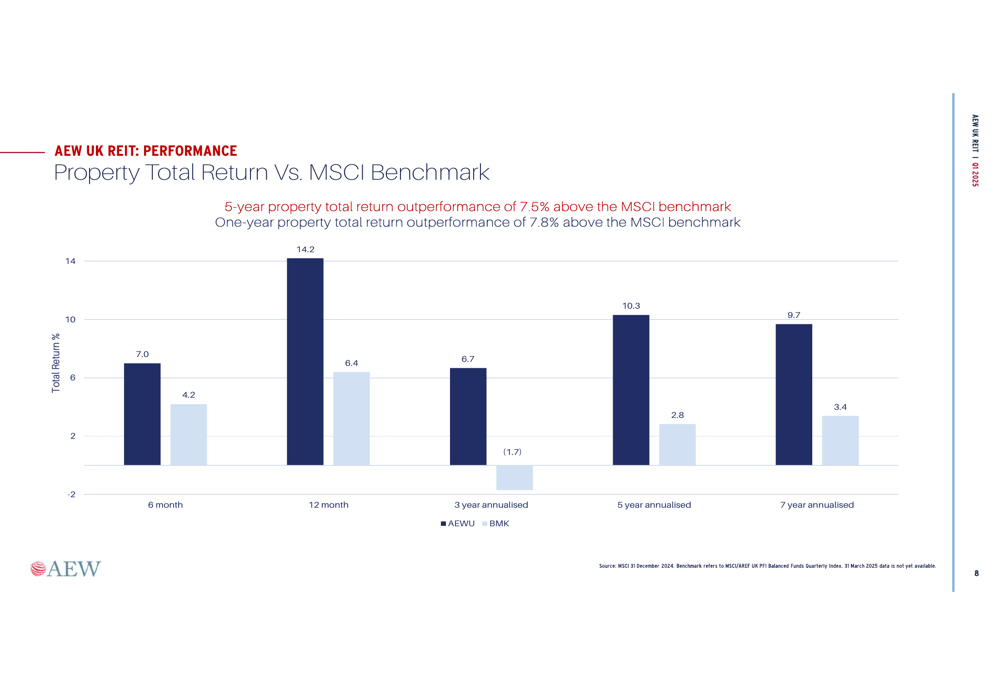
The REIT’s total returns have been impressive, with a one-year NAV total return of 14.5% and a five-year annualized NAV total return of 10.5% (as of December 31, 2024). The property portfolio has delivered a one-year total return of 14.2% and a five-year annualized total return of 10.3%.
Particularly noteworthy is AEW UK REIT’s outperformance against its benchmark, with the five-year property total return exceeding the MSCI benchmark by 7.5% and the one-year property total return outperforming by 7.8%.
This outperformance is clearly illustrated in the following chart:
The REIT’s sector allocation is weighted toward industrial properties (39%), followed by offices (21%), alternatives (12%), retail warehouses (9%), and standard retail (4%). Geographically, the portfolio is diversified across the UK, with the largest concentrations in the South East (18%), Rest of London (14%), and Scotland (14%).
Investment Strategy and Market Opportunity (SO:FTCE11B)
AEW UK REIT’s investment approach focuses on value principles to identify mispriced assets, followed by active asset management to maximize income and unlock capital upside. The company is sector agnostic, targeting UK core plus commercial property in strong locations with low supply. Their acquisition criteria typically seek net initial yields between 8-10%, low book values (portfolio average of £77 per sq. ft.), and low passing rents (portfolio average of £6.74 per sq. ft.).
The current market environment presents a significant buying opportunity, with UK commercial property capital values at their lowest point since the company’s IPO in May 2015, as illustrated in the following chart:
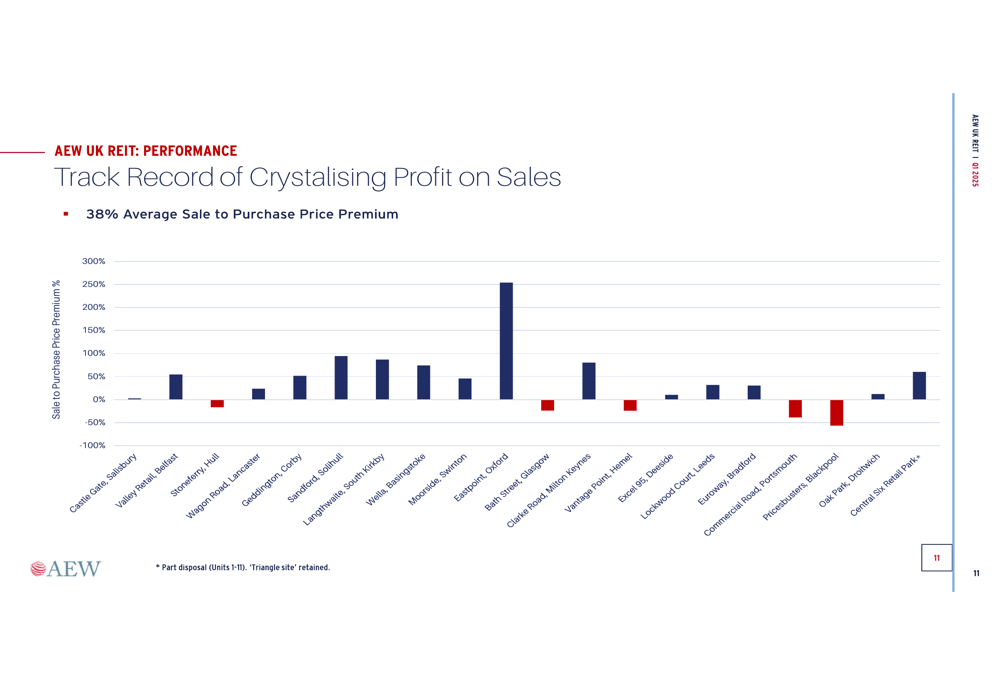
The REIT has demonstrated its ability to crystallize profits on property sales, achieving an average 38% premium on sale to purchase price across its disposal history. This track record is visualized below:
Acquisition Pipeline and Asset Management
AEW UK REIT recently acquired Bancroft, a high street retail property in Hitchin, for £10 million (representing a net initial yield of 8.3%). The property comprises 46,905 sq. ft. and is let to strong tenants including Marks & Spencer (OTC:MAKSY), Next Holdings, Vodafone (NASDAQ:VOD), Oliver Bonas, The White Company, and Holland & Barrett.
The company has identified several pipeline opportunities across the UK, including properties in Leeds (£10.1 million, 10.18% NIY), London (£15.29 million, 8.74% NIY), Kent (£16.2 million, 9.00% NIY), Northamptonshire (£8 million, 9.00% NIY), Scotland (£7.3 million, 10.00% NIY), and Lancashire (£4.75 million, 8.73% NIY).
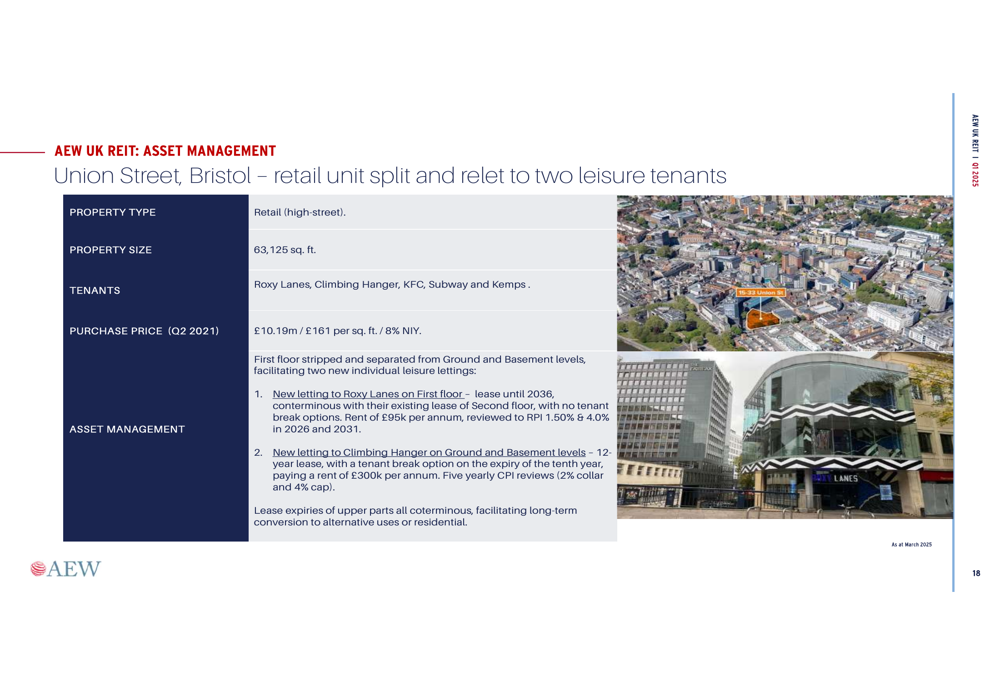
The REIT’s active asset management approach is demonstrated through several case studies presented, including:
1. Union Street, Bristol - A retail unit split and relet to two leisure tenants
2. Next (LON:NXT), Bromley - Securing a longer unexpired lease term with a strong retail covenant
3. Sarus Court, Runcorn - Refurbishment capturing strong rental growth
4. Knowles (NYSE:KN) Lane, Bradford - Lease renewal crystallizing further rental growth
These case studies highlight the company’s hands-on approach to maximizing value from its portfolio, as shown in this example:
Competitive Positioning and Outlook
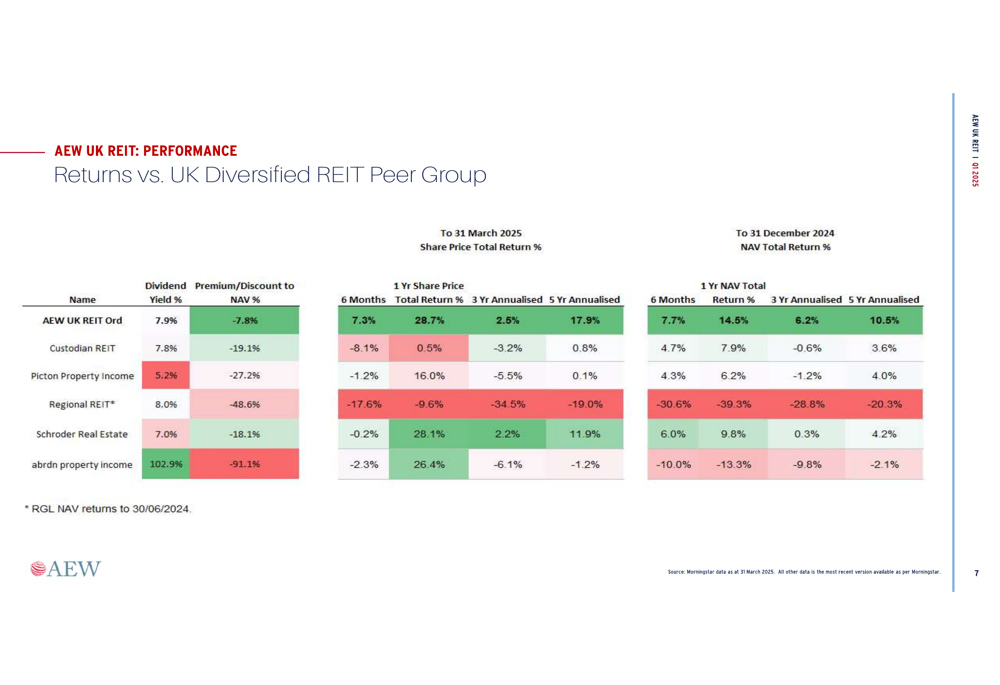
When compared to its UK Diversified REIT peer group, AEW UK REIT demonstrates strong performance across key metrics. The company’s dividend yield of 7.9% is competitive, while its NAV and share price returns over various time periods generally outperform peers.
This competitive positioning is illustrated in the following comparison table:
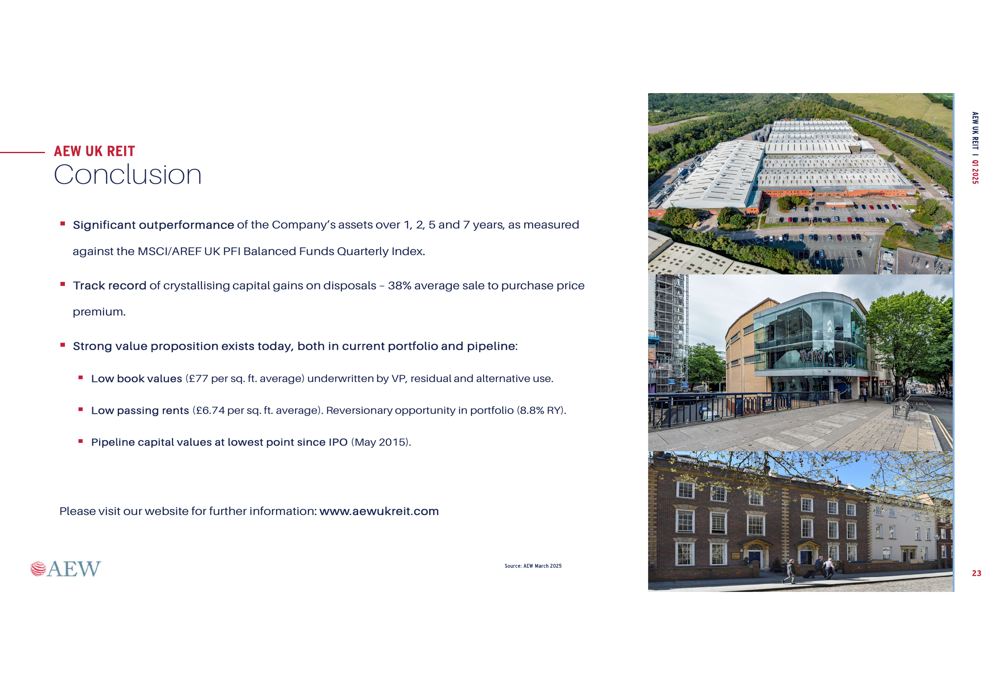
Looking forward, AEW UK REIT highlights three key value propositions:
1. Significant outperformance of assets over 1, 2, 5, and 7 years against the MSCI/AREF UK PFI Balanced Funds Quarterly Index
2. Track record of crystallizing capital gains on disposals (38% average sale to purchase price premium)
3. Strong value proposition in both the current portfolio and pipeline, with low book values, low passing rents, and reversionary opportunities
The company maintains a conservative financial position with debt of £60 million, representing a loan-to-gross asset value of 25.0% and a loan-to-NAV of 34.4%. The cost of debt is fixed at 2.96%, and the REIT has £19 million in capital cash available for deployment.
With capital values at their lowest point since IPO and a pipeline of high-yielding opportunities, AEW UK REIT appears well-positioned to continue its strategy of acquiring undervalued assets and actively managing them to deliver strong returns to shareholders.
Full presentation:
This article was generated with the support of AI and reviewed by an editor. For more information see our T&C.