These are top 10 stocks traded on the Robinhood UK platform in July

Introduction & Market Context
Aflac Inc . (NYSE:AFL) revealed a stark contrast between its GAAP and adjusted earnings in its first quarter 2025 presentation delivered on May 1. The supplemental insurance provider reported a dramatic 98.5% year-over-year decline in net earnings to just $29 million, while adjusted earnings remained relatively stable. This follows the company’s Q4 2024 performance, which saw Aflac miss earnings expectations despite strong revenue.
The insurer’s stock, which dropped 4.52% following its Q4 2024 earnings release, closed at $108.68 on April 30, 2025, and was down 1.56% in premarket trading following the Q1 results.
Quarterly Performance Highlights
Aflac’s first quarter results showed a stark divergence between GAAP and adjusted metrics. Net earnings per diluted share plummeted 98.5% to $0.05 in Q1 2025 from $3.25 in the same period last year. However, adjusted earnings per diluted share remained flat at $1.66 year-over-year.
As shown in the following chart of Aflac’s return on equity metrics:
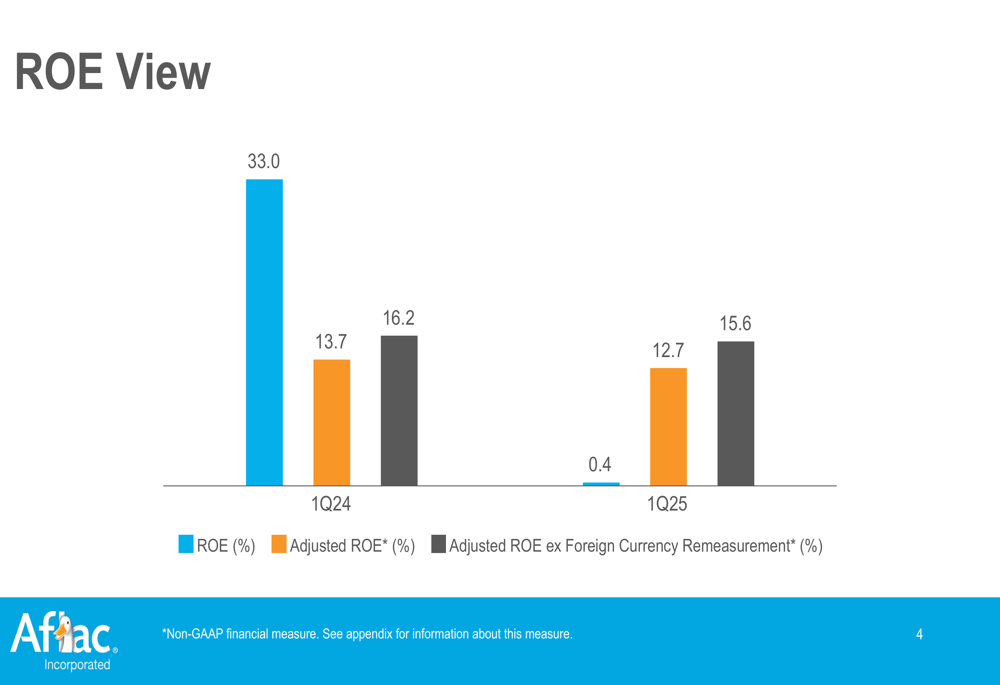
The company’s GAAP ROE fell dramatically to 0.4% in Q1 2025 from 33.0% in Q1 2024. Adjusted ROE showed a more modest decline to 12.7% from 13.7%, while adjusted ROE excluding foreign currency remeasurement was 15.6%, down from 16.2%.
Total (EPA:TTEF) net earnings for the quarter were just $29 million, compared to $1.88 billion in Q1 2024, representing a 98.5% decrease. Adjusted earnings declined 5.7% to $906 million from $961 million in the prior year period.
Segment Performance: Japan
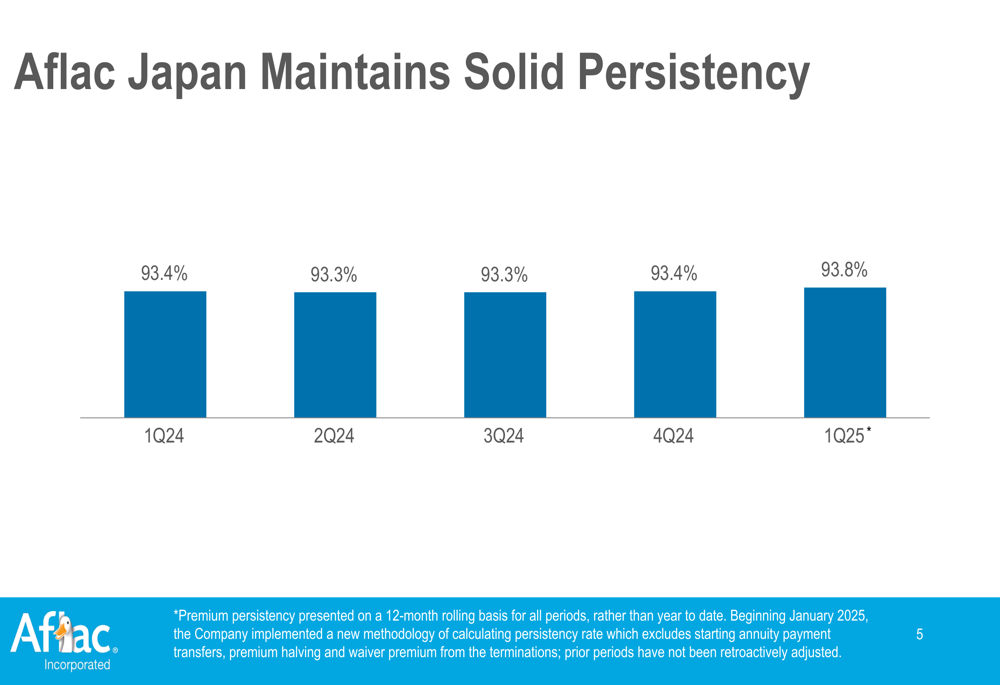
Aflac Japan, which accounts for approximately 70% of the company’s pretax adjusted earnings according to previous disclosures, showed improved persistency rates in Q1 2025. The premium persistency rate increased to 93.8% from 93.4% a year earlier, indicating strong customer retention.
As illustrated in the following chart tracking Aflac Japan’s persistency:
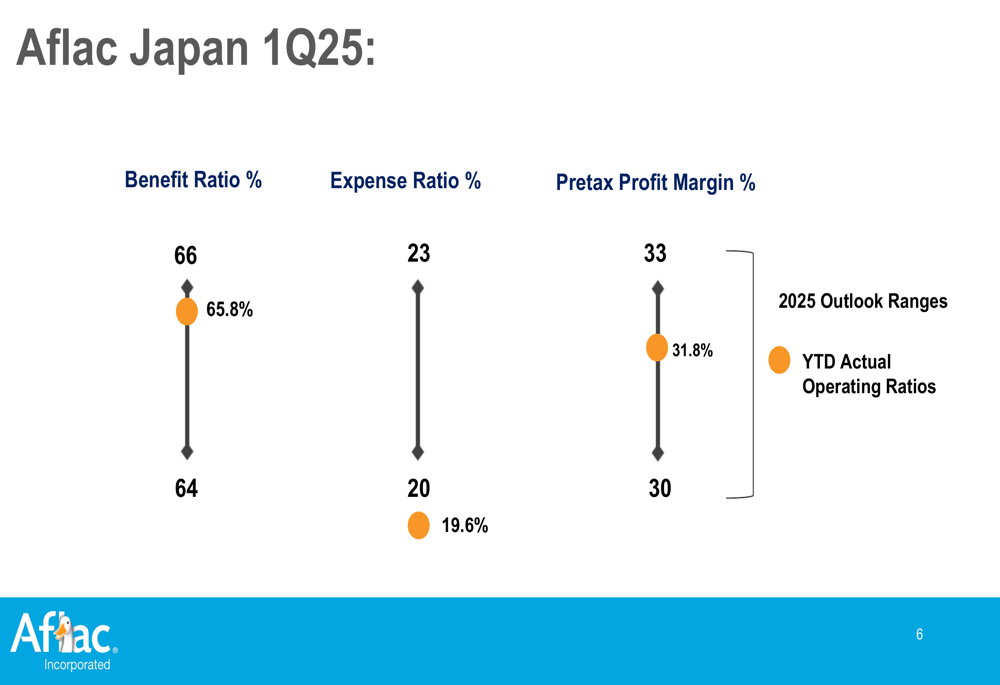
The company’s Japan segment performed within expected ranges for most operating metrics. The benefit ratio was 65.8%, within the 2025 outlook range of 64% to 66%. The expense ratio came in at 19.6%, slightly below the projected range of 20% to 23%, demonstrating effective cost control. The pretax profit margin was 31.8%, solidly within the 30% to 33% outlook range.
The following chart shows Aflac Japan’s Q1 2025 operating ratios compared to outlook ranges:
Segment Performance: U.S.
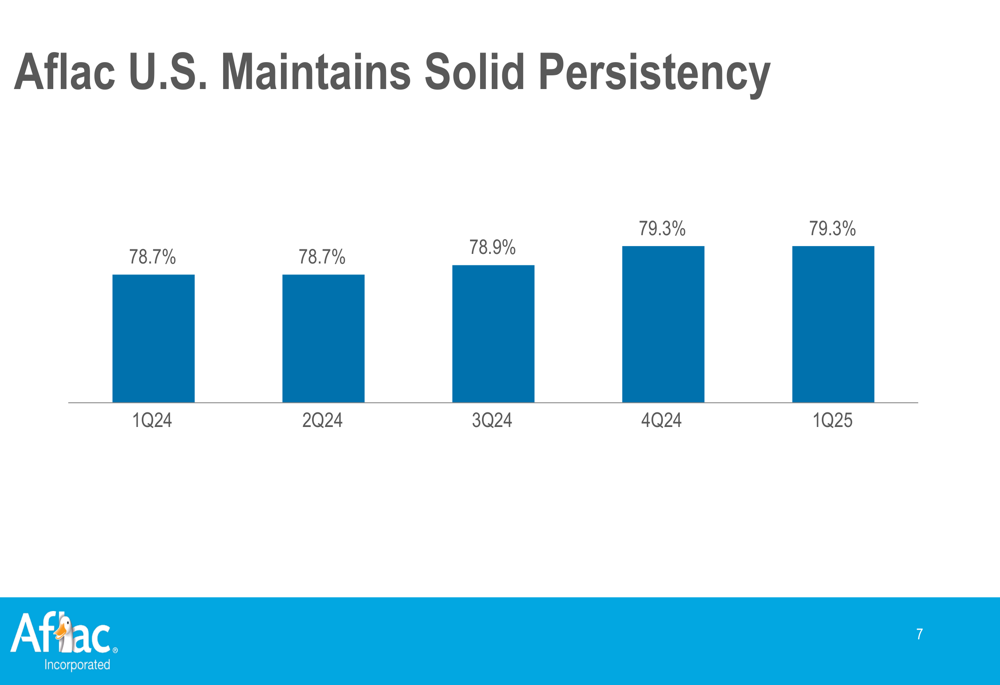
Aflac’s U.S. operations showed stable persistency at 79.3% in Q1 2025, maintaining the improvement seen in Q4 2024 and up from 78.7% in Q1 2024. This improvement aligns with the 70 basis point increase in premium persistency mentioned in the Q4 2024 earnings report.
The following chart shows the trend in Aflac U.S. persistency:
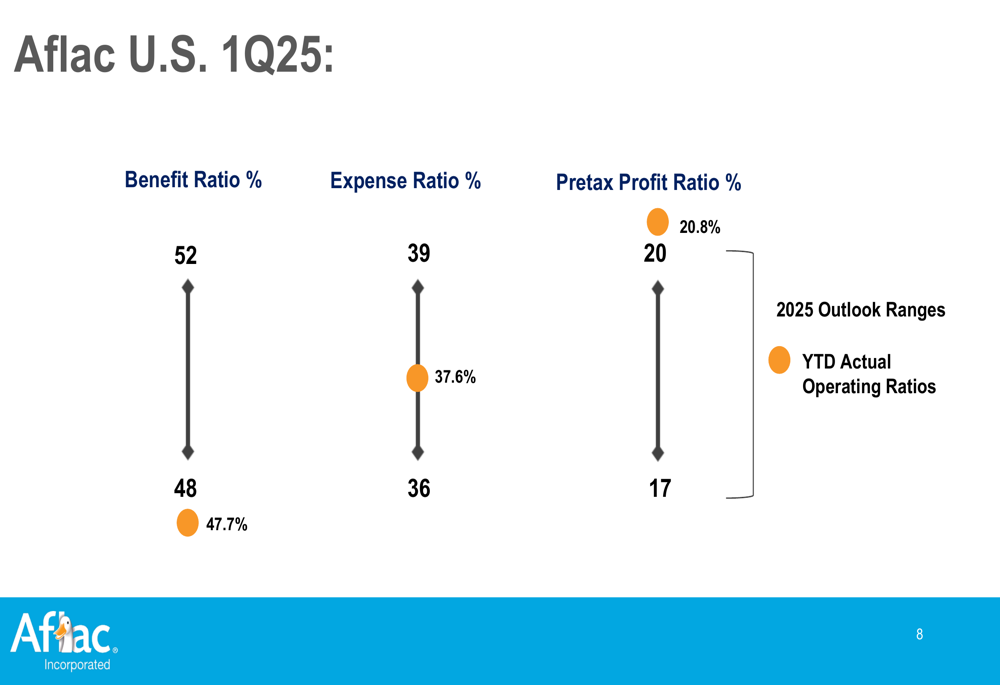
The U.S. segment’s operating metrics showed strong performance, with the benefit ratio at 47.7%, slightly below the 2025 outlook range of 48% to 52%. The expense ratio was 37.6%, well within the projected 36% to 39% range. Most notably, the pretax profit ratio exceeded expectations at 20.8%, above the outlook range of 17% to 20%.
The following chart details Aflac U.S.’s Q1 2025 operating ratios:
Capital Management and Financial Position
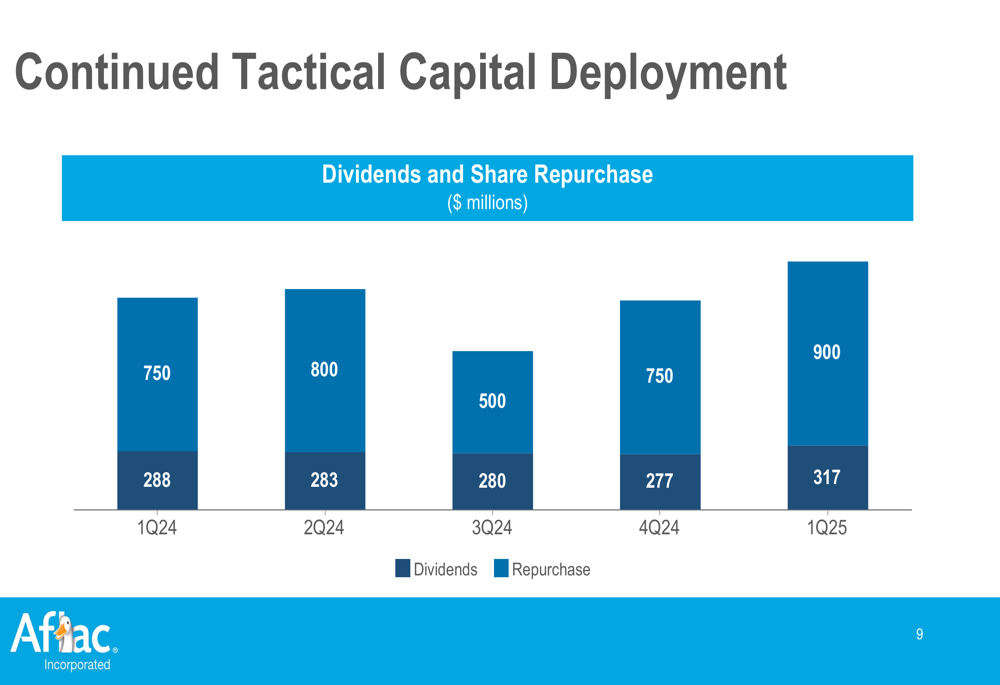
Despite the significant drop in GAAP earnings, Aflac maintained robust capital deployment in Q1 2025, returning a total of $1.22 billion to shareholders. This included $900 million in dividends, up from $750 million in Q1 2024, and $317 million in share repurchases, an increase from $288 million in the prior year period.
The following chart illustrates Aflac’s capital deployment strategy over the past five quarters:
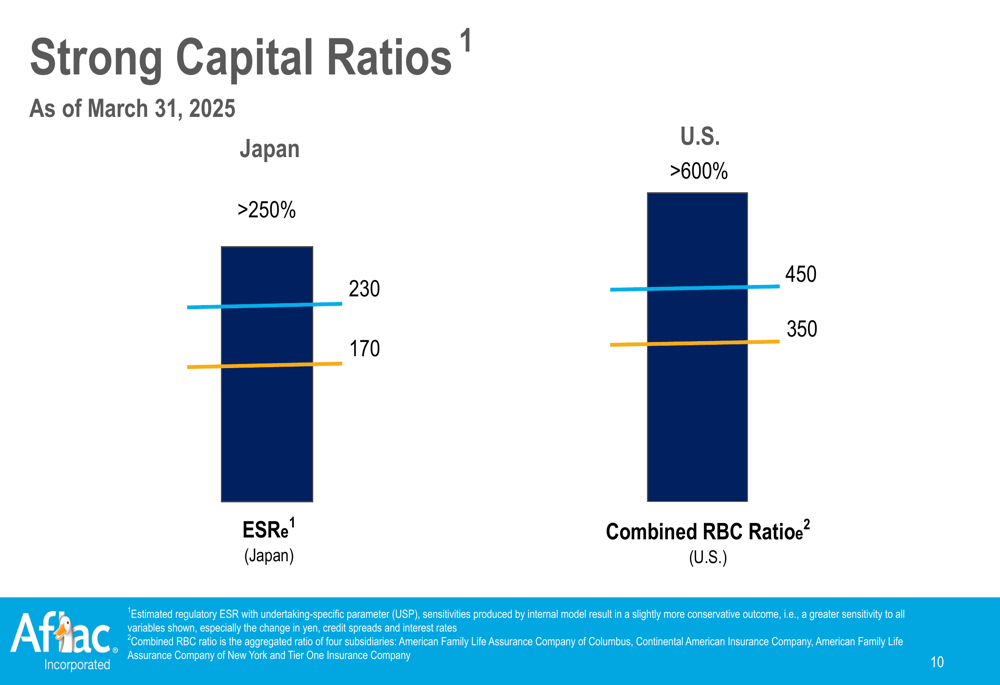
The company continues to maintain strong capital positions in both its Japan and U.S. operations. The Japan estimated solvency ratio (ESR) exceeded 250%, while the U.S. combined risk-based capital (RBC) ratio was above 600%, both well above regulatory requirements.
As shown in the following capital ratios chart:
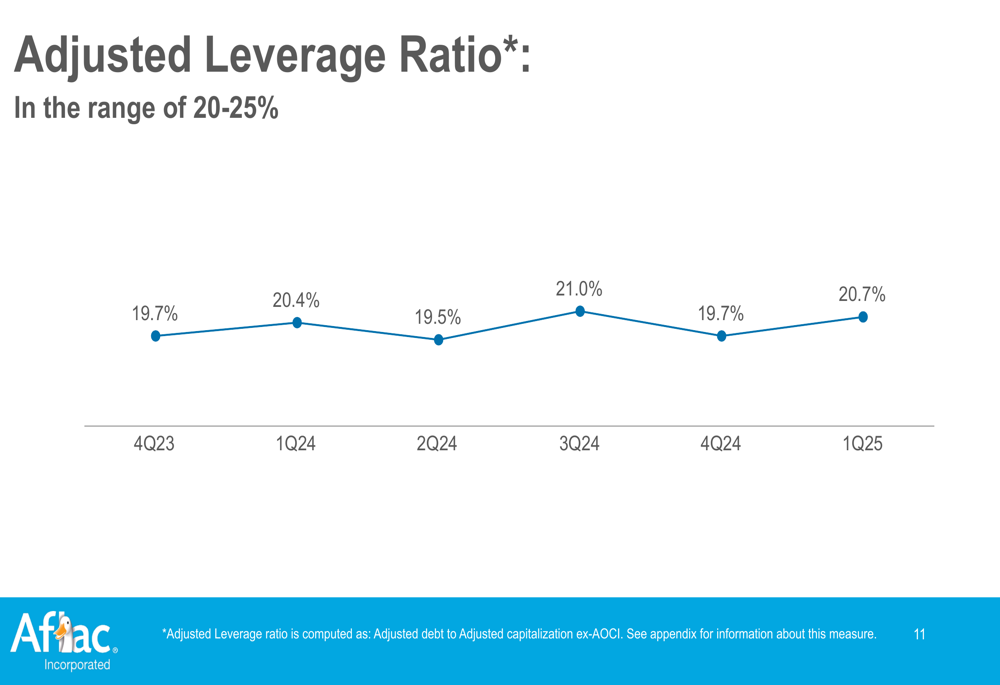
Aflac’s adjusted leverage ratio stood at 20.7% as of Q1 2025, up slightly from 19.7% in Q4 2024 but still within the company’s target range of 20-25%.
The following chart tracks Aflac’s adjusted leverage ratio over recent quarters:
Forward-Looking Statements
Based on the Q1 2025 results and previous guidance, Aflac expects its Japan segment’s pretax profit margin to be at the lower end of the 30-33% range for 2025, consistent with the current quarter’s 31.8%. The U.S. segment is projected to reach the upper end of its 17-20% pretax profit range, supported by the strong 20.8% achieved in Q1.
The company remains committed to its capital deployment strategy, with continued share repurchases and dividend payments planned for the remainder of 2025. New product launches in Japan, previously scheduled for March to April 2025, should begin contributing to results in upcoming quarters.
While the dramatic drop in GAAP earnings raises concerns, the stability in adjusted earnings suggests that one-time factors rather than operational issues are primarily responsible for the decline. Investors will likely focus on the company’s ability to maintain its adjusted earnings performance and strong capital position while navigating the challenges that impacted its GAAP results.
Full presentation:
This article was generated with the support of AI and reviewed by an editor. For more information see our T&C.