U.S. futures dip; Black Friday spending surge - what’s moving markets

Introduction & Market Context
Agilent Technologies Inc (NYSE:A) presented its second-quarter fiscal year 2025 financial results on May 28, showcasing solid performance with revenue growth across most segments and regions. The life sciences and diagnostics company reported a 6% increase in revenue, driven particularly by strong performance in Asia Pacific markets and several key industry verticals.
The presentation comes as Agilent continues to navigate a complex global economic environment while maintaining its focus on innovation and operational efficiency. The company’s stock responded positively to the results, rising 6.11% in aftermarket trading to $117.65, suggesting investor confidence in the company’s trajectory despite some mixed segment performance.
Quarterly Performance Highlights
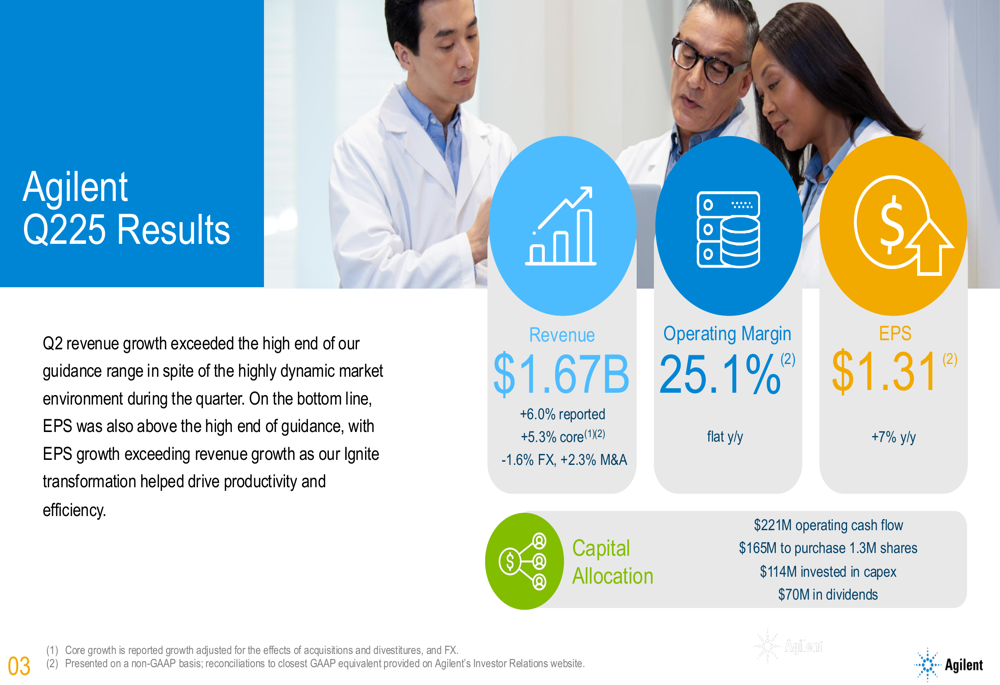
Agilent reported Q2 2025 revenue of $1.67 billion, representing a 6.0% increase on a reported basis and 5.3% growth on a core basis when adjusted for currency effects and acquisitions. Earnings per share reached $1.31, up 7% year-over-year, while operating margin remained flat at 25.1%.
The company generated $221 million in operating cash flow during the quarter, allocating $165 million to repurchase 1.3 million shares, $114 million to capital expenditures, and $70 million to dividends.
As shown in the following financial overview from the presentation:
Segment and Geographic Analysis
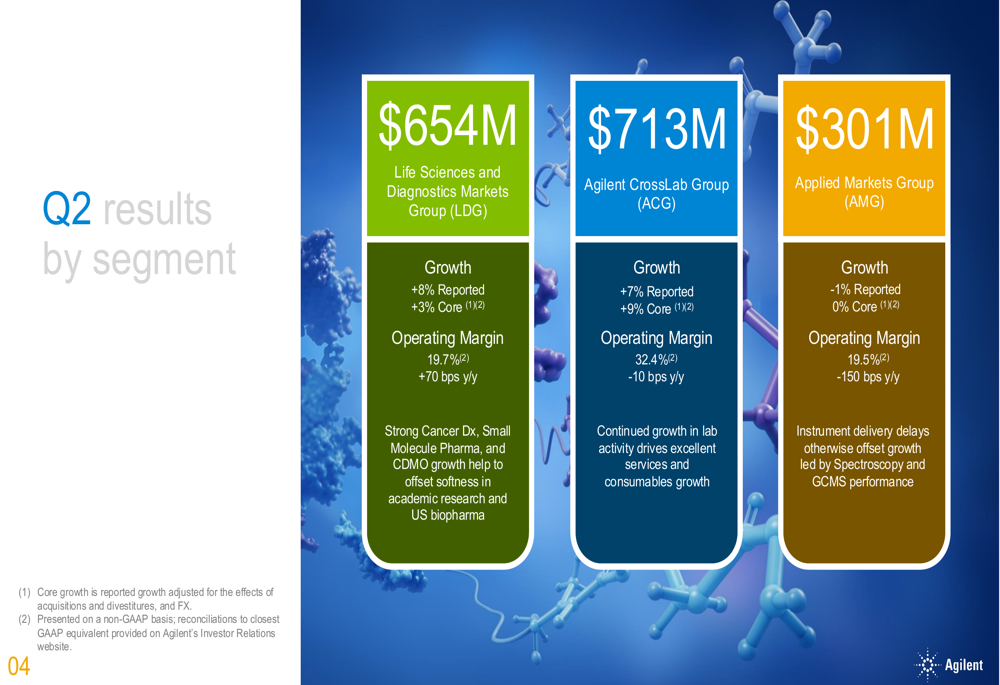
Agilent’s performance varied across its three business segments. The Life Sciences and Diagnostics Markets Group (LDG) delivered $654 million in revenue, growing 8% on a reported basis and 3% on a core basis, with operating margins improving by 70 basis points to 19.7%. The Agilent CrossLab Group (ACG), which focuses on consumables and services, was the standout performer with $713 million in revenue, representing 7% reported growth and 9% core growth, though operating margins declined slightly by 10 basis points to 32.4%. The Applied Markets Group (AMG) showed the weakest performance with $301 million in revenue, representing a 1% decline on a reported basis and flat core growth, while operating margins fell 150 basis points to 19.5%.
The segment breakdown illustrates these performance differences:
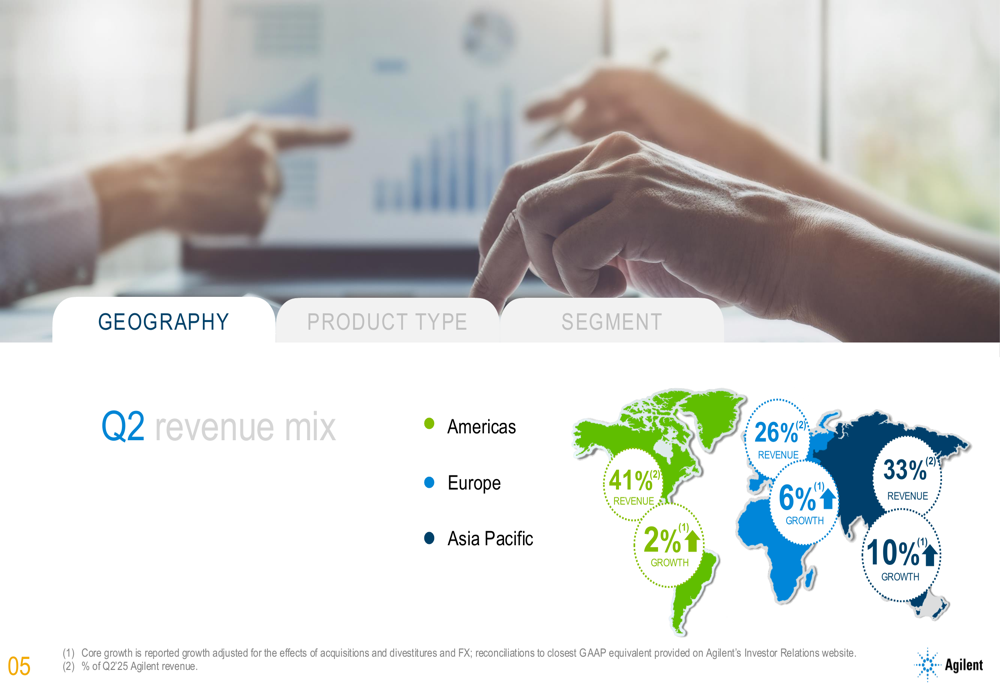
Geographically, Asia Pacific emerged as the growth leader with 10% expansion, accounting for 33% of total revenue. Europe showed solid performance with 6% growth, representing 26% of revenue, while the Americas grew more modestly at 2% and constituted 41% of total revenue.
The following geographic breakdown highlights these regional differences:
End Market Performance
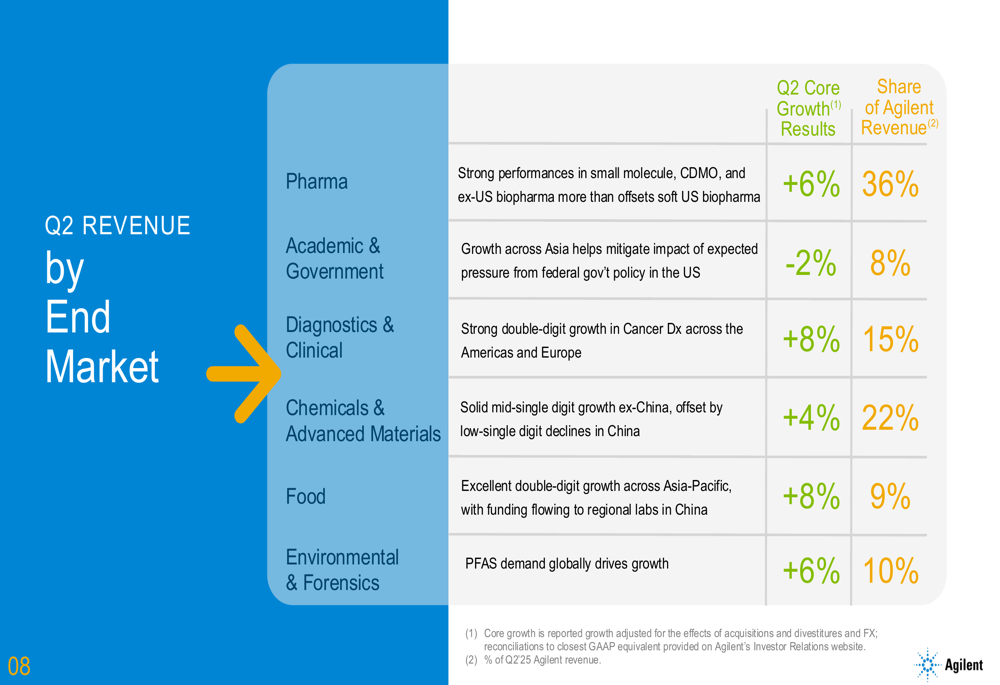
Agilent’s revenue growth was driven by strong performance across several key end markets. The Diagnostics & Clinical and Food sectors both grew 8%, while the Pharmaceutical (TADAWUL:2070) sector, which represents Agilent’s largest market at 36% of revenue, grew 6%. Environmental & Forensics also showed robust growth at 6%, while Chemicals & Advanced Materials increased by 4%. The only declining sector was Academic & Government, which fell 2% and represents 8% of revenue.
This comprehensive breakdown of end market performance demonstrates the company’s diverse revenue streams:
From a product perspective, Consumables, Services & Informatics continued to dominate Agilent’s revenue mix, accounting for 67% of total revenue, with Instruments making up the remaining 33%. This recurring revenue focus helps provide stability to Agilent’s business model amid fluctuating capital expenditure environments.
Innovation Initiatives
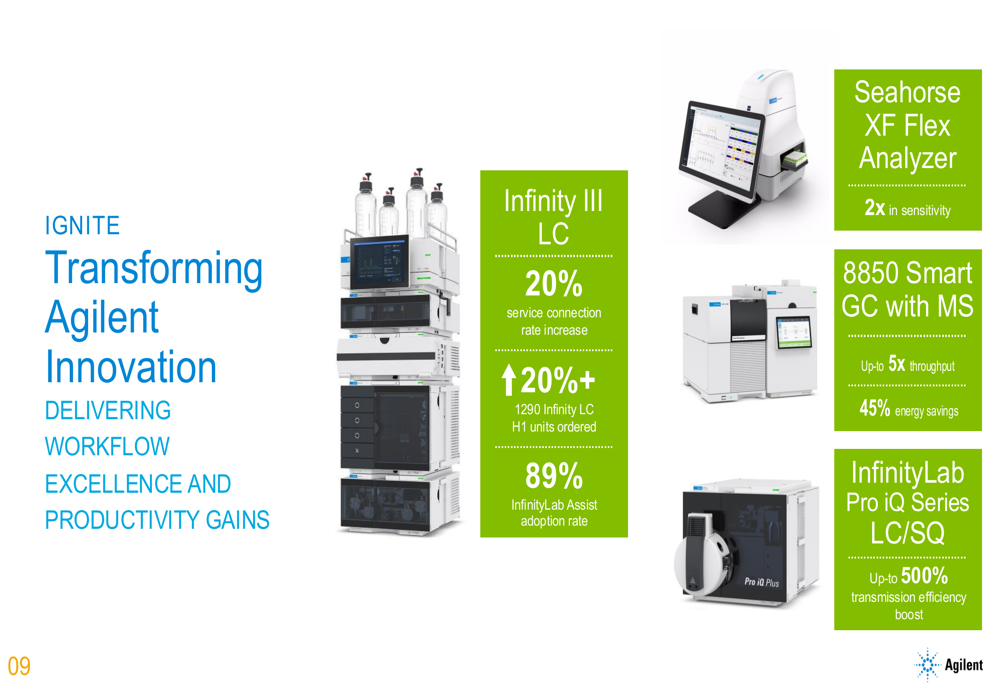
Agilent highlighted several innovation achievements during the presentation, emphasizing improvements in efficiency, sensitivity, and throughput across its product portfolio. The company reported a 20% increase in service connection rates for its LC systems, while the Seahorse XF Flex (NASDAQ:FLEX) Analyzer achieved twice the sensitivity of previous models. The 8850 Smart GC with MS delivers up to five times greater throughput with 45% energy savings, and the Lab Pro iQ Series LC/SQ boasts up to 500% transmission efficiency improvements.
These innovations reflect Agilent’s ongoing commitment to technological advancement, as illustrated in the following slide:
Forward Guidance
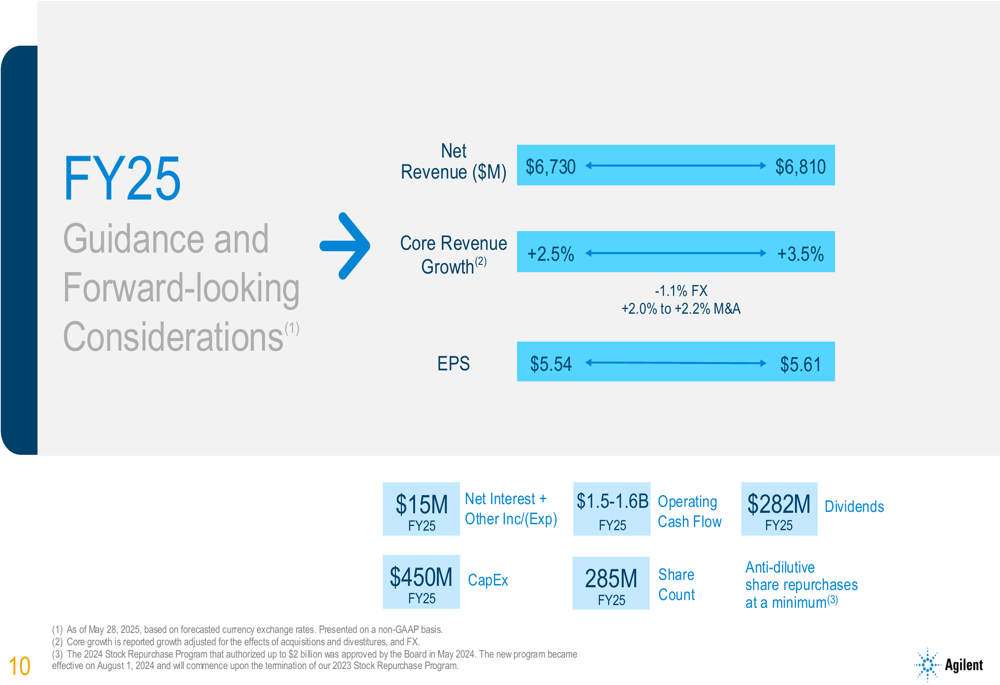
Looking ahead, Agilent maintained its full-year fiscal 2025 guidance, projecting net revenue between $6.73 billion and $6.81 billion, representing core revenue growth of 2.5% to 3.5%. The company expects earnings per share between $5.54 and $5.61 for the full year.
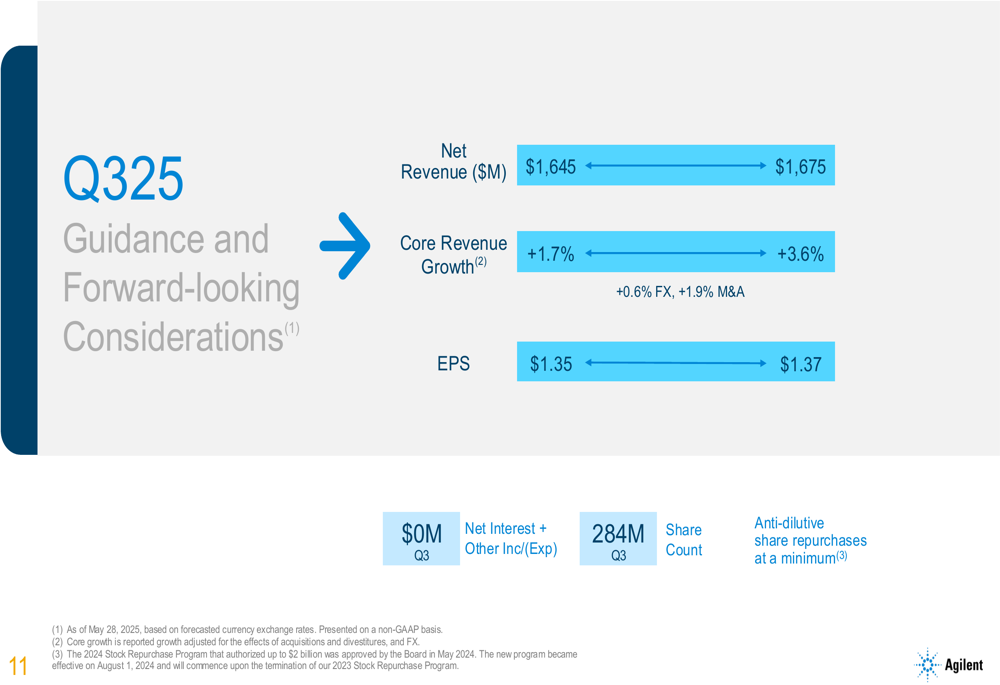
For the upcoming third quarter, Agilent forecasts net revenue between $1.645 billion and $1.675 billion, with core revenue growth of 1.7% to 3.6% and earnings per share between $1.35 and $1.37.
The company’s financial outlook is detailed in the following guidance slide:
For the third quarter specifically, Agilent provided this guidance:
Market Reaction and Conclusion
Investors responded positively to Agilent’s Q2 results, with the stock rising 6.11% in aftermarket trading to $117.65. This favorable reaction suggests confidence in the company’s ability to navigate current market challenges while maintaining growth momentum.
The Q2 results demonstrate Agilent’s resilience in a complex global environment, with particular strength in Asia Pacific markets and recurring revenue streams. While the company faces challenges in certain segments, particularly AMG and the Academic & Government sector, its diversified business model and focus on innovation continue to drive overall growth.
As Agilent moves into the second half of fiscal 2025, the company appears well-positioned to achieve its full-year targets, supported by strong performance in key growth markets and ongoing operational efficiency initiatives. The consistent dividend payments and share repurchase program further reflect management’s confidence in the company’s financial health and future prospects.
Full presentation:
This article was generated with the support of AI and reviewed by an editor. For more information see our T&C.