These are top 10 stocks traded on the Robinhood UK platform in July

Introduction & Market Context
Aker BP (NYSE:BP) ASA (OB:AKRBP) presented its first quarter 2025 results on May 7, showing strong operational and financial performance despite a slight year-over-year production decrease. The Norwegian oil and gas producer maintained its position as a low-cost, low-emission operator while delivering robust cash flow and increasing shareholder returns.
The company’s share price closed at 221.9 NOK on May 6, 2025, and has traded between 200.5 NOK and 280.4 NOK over the past 52 weeks. The presentation comes as the company continues to execute its growth strategy while maintaining financial discipline.
Quarterly Performance Highlights
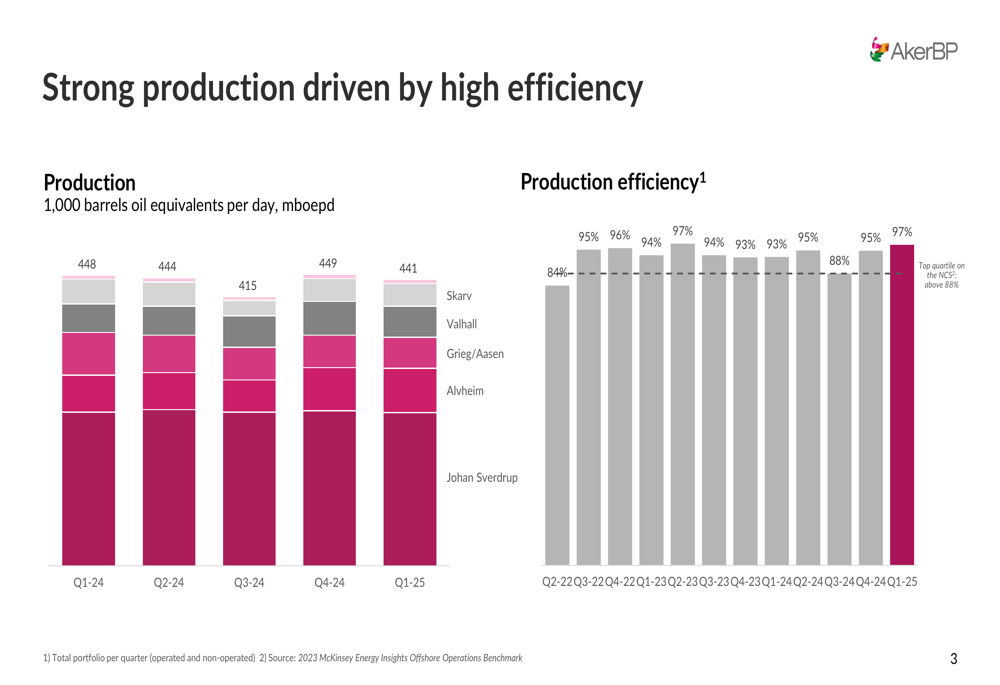
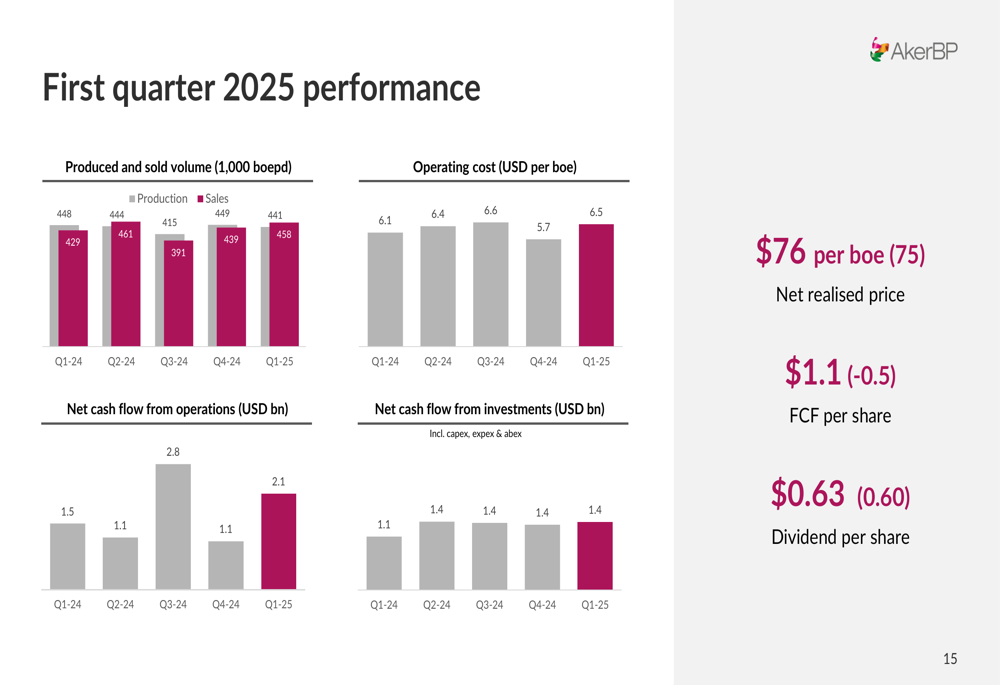
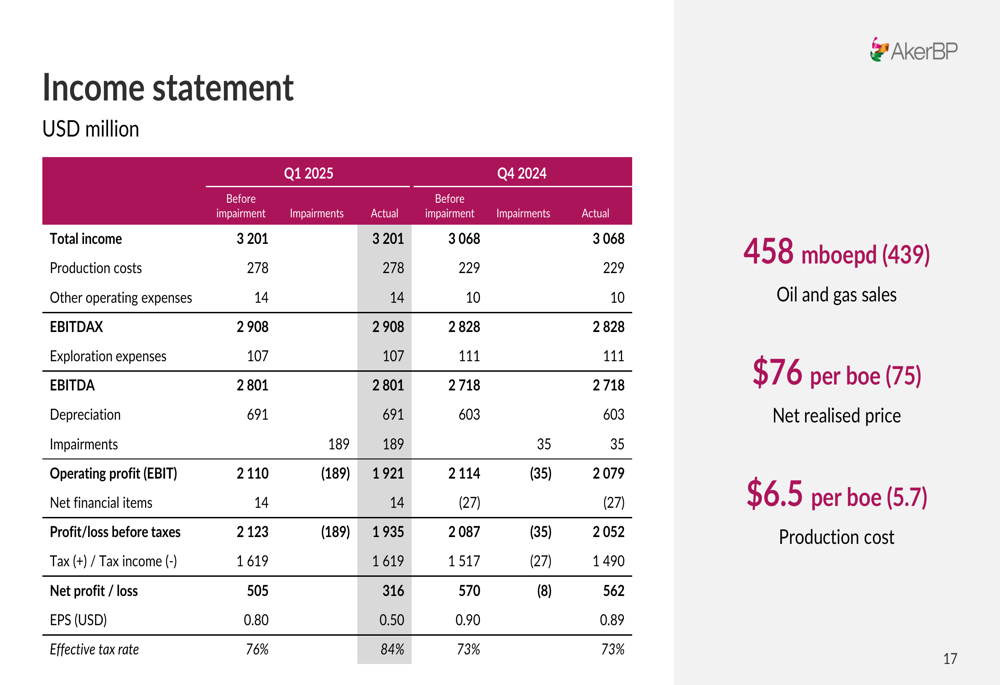
Aker BP reported production of 441,000 barrels of oil equivalent per day (boepd) in Q1 2025, slightly down from 448,000 boepd in Q1 2024 but supported by exceptional production efficiency of 97%. The company achieved total income of $3.2 billion, up from $3.07 billion in the previous quarter, with a net realized price of $76 per barrel of oil equivalent.
As shown in the following chart, the company has maintained relatively stable production across its asset portfolio over the past five quarters:
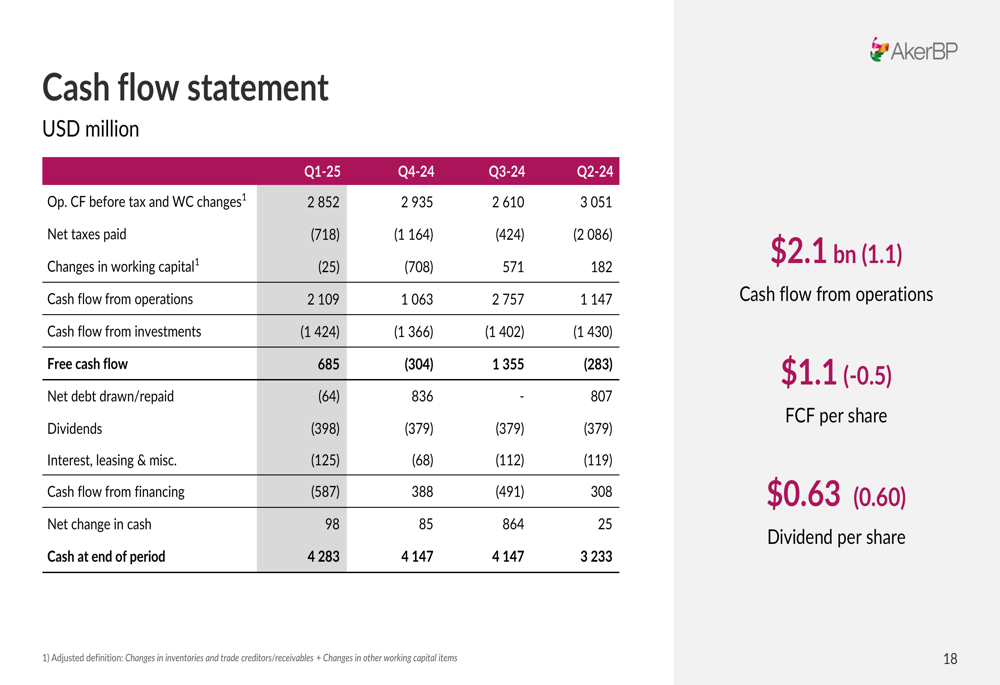
Free cash flow reached $1.1 per share, a significant improvement from negative $0.5 per share in the comparative period. This strong cash generation supported a quarterly dividend of $0.63 per share, up from $0.60 previously, reflecting the company’s commitment to growing shareholder returns by at least 5% annually.
The following chart illustrates Aker BP’s first quarter 2025 performance across key metrics:
Operational Excellence
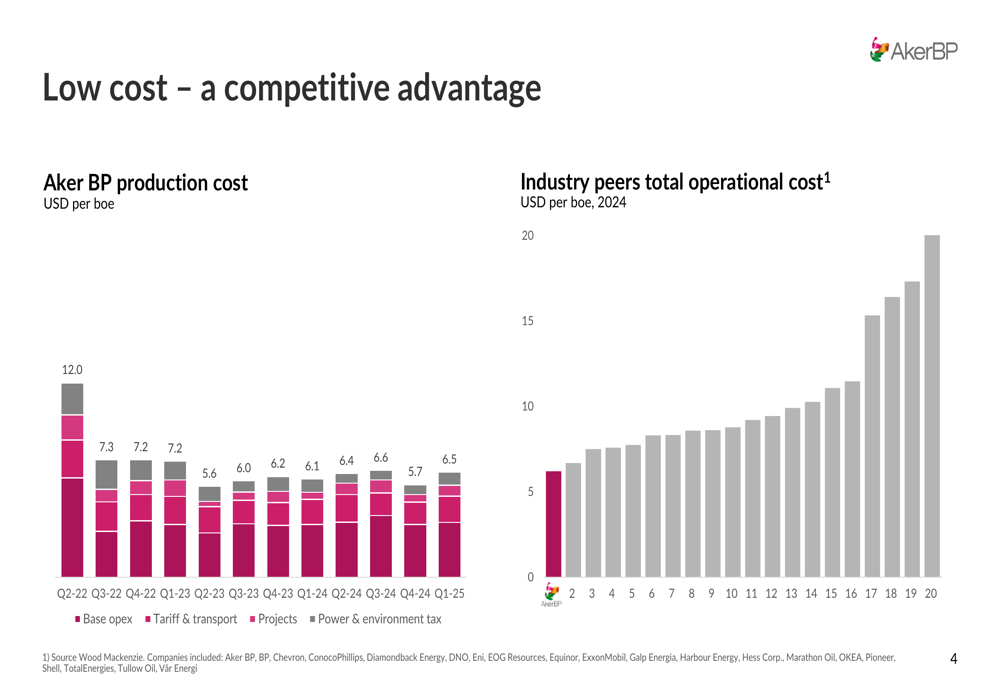
Aker BP continues to demonstrate industry-leading operational performance. The company reported operating costs of $6.5 per barrel of oil equivalent in Q1 2025, positioning it as one of the lowest-cost producers among its peers. This cost advantage provides resilience in varying price environments and supports consistent cash flow generation.
The following chart highlights Aker BP’s cost advantage compared to industry peers:
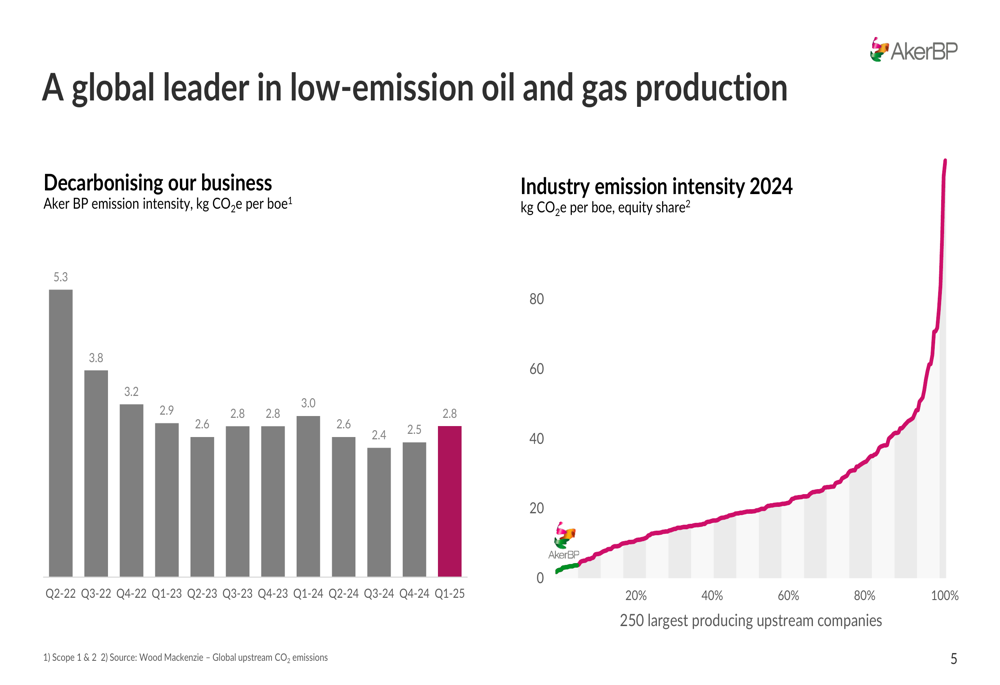
Environmental performance remains another area of competitive advantage for Aker BP. The company reported greenhouse gas intensity of 2.8 kg CO2e per barrel of oil equivalent in Q1 2025, maintaining its position as a global leader in low-emission oil and gas production.
This emissions performance is illustrated in the following chart, showing Aker BP’s position relative to other producers:
Strategic Growth Initiatives
Aker BP continues to progress its portfolio of development projects, which are expected to drive production growth in the coming years. The company is targeting production above 500,000 boepd into the 2030s, supported by ongoing field developments with a net volume of approximately 800 million barrels of oil equivalent.
The company’s long-term production outlook is illustrated in this chart:
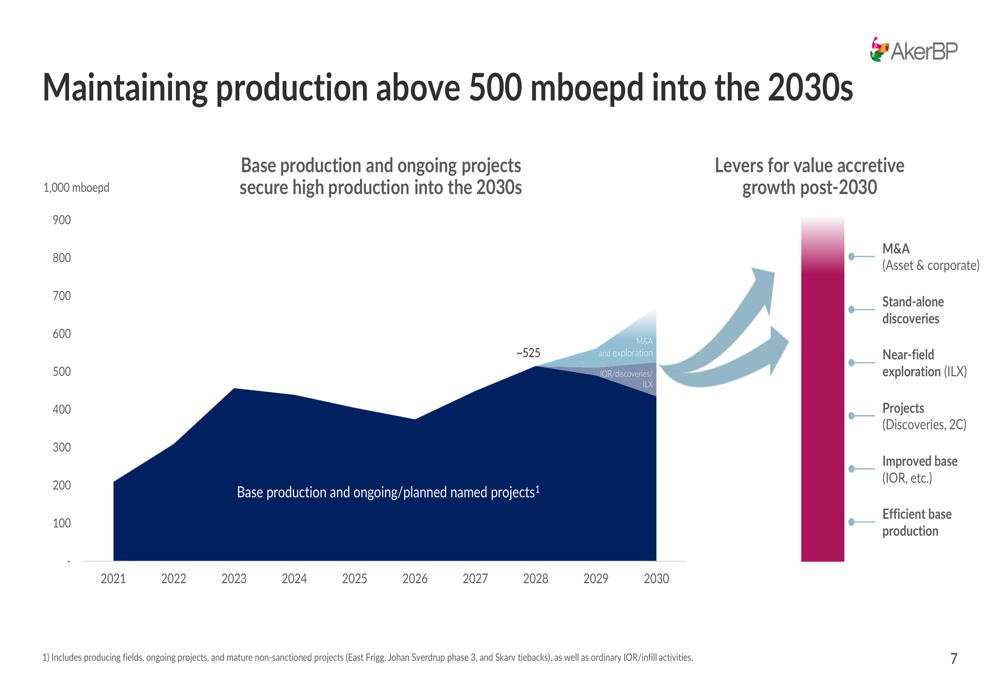
Key projects include Yggdrasil with net volume of approximately 450 million barrels of oil equivalent, Valhall PWP/Fenris with net volume of approximately 190 million barrels, and various tie-back projects at Alvheim, Skarv, and Grieg Aasen with combined net volume of approximately 170 million barrels.
The Johan Sverdrup field continues to perform well, with four retrofit multi-lateral wells planned for drilling this year. The company expects to sanction Phase 3 of the Johan Sverdrup development in the second quarter of 2025, along with the East Frigg development.
Exploration success remains a key part of Aker BP’s growth strategy, with two commercial discoveries announced in the quarter. The company has an active exploration program planned for 2025, including five prospects in the Yggdrasil area to be drilled in a single campaign in Q2-Q3 with pre-drill estimates of 40-135 million barrels of oil equivalent.
Financial Position and Outlook
Aker BP maintains a strong financial position with total available liquidity of $7.7 billion, up from $7.5 billion previously. The company’s leverage ratio improved to 0.29 from 0.30, well below its target of 1.5, providing significant financial flexibility for future investments and shareholder returns.
The company’s income statement shows strong profitability with EBITDA of $2.8 billion in Q1 2025, up from $2.7 billion in Q4 2024:
Cash flow from operations reached $2.1 billion, a significant increase from $1.1 billion in the comparative period:
Aker BP maintained its 2025 guidance, projecting production of 390,000-420,000 boepd, operating expenses of approximately $7.0 per barrel, and capital expenditures of $5.5-6.0 billion. The company’s portfolio breakeven is estimated at $35-40 per barrel, providing resilience in various price scenarios.
The company remains committed to its dividend policy, with plans to grow dividends by at least 5% in 2025. This is supported by low-cost production and strong cash flow generation through market cycles.
In concluding remarks, Aker BP highlighted its strong operational performance, progress on development projects, upcoming investment decisions for Johan Sverdrup Phase 3 and East Frigg, recent exploration successes, and robust financial position supporting resilient dividends.
Full presentation:
This article was generated with the support of AI and reviewed by an editor. For more information see our T&C.