Lucid files for 1-for-10 reverse stock split requiring shareholder approval

Introduction & Market Context
Allison Transmission Holdings Inc (NYSE:ALSN) released its first quarter 2025 earnings presentation on May 1, showing improved profitability metrics despite a slight decline in overall revenue. The transmission manufacturer’s stock responded positively in after-hours trading, climbing 3.06% to $96.25, signaling investor confidence in the company’s performance.
The Q1 results reflect Allison’s continued strength in its core North American on-highway market and defense sector, which helped offset significant weakness in global off-highway applications. This performance follows the company’s strong showing in the previous quarter, where it had reported record sales driven by robust demand in the Class 8 vocational vehicle market.
Quarterly Performance Highlights
Allison reported Q1 2025 net sales of $766 million, representing a 3% decrease compared to the same period last year. Despite this revenue dip, the company achieved notable improvements in profitability, with net income rising 14% to $192 million and diluted earnings per share increasing 17% to $2.23.
The company’s Q1 performance summary highlights these key metrics, showing how improved margins helped drive bottom-line growth despite top-line pressure:
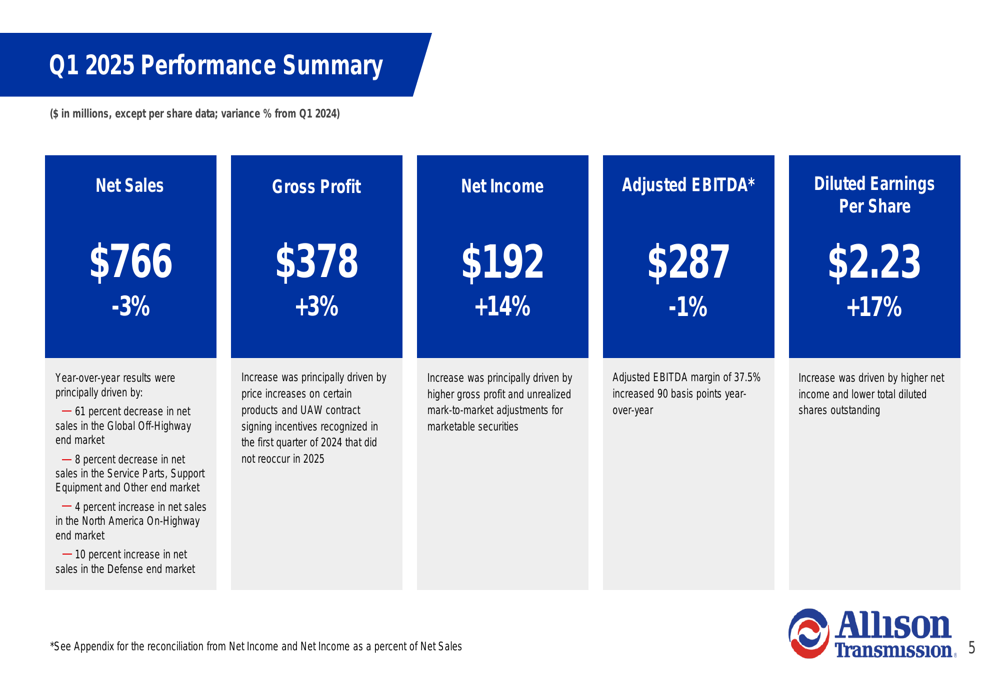
Gross profit increased 3% year-over-year to $378 million, while Adjusted EBITDA remained relatively stable at $287 million, just 1% below the prior year. Notably, Adjusted EBITDA margin expanded by 90 basis points to 37.5%, demonstrating the company’s ability to enhance operational efficiency amid challenging market conditions.
The revenue decline was primarily attributed to significantly lower sales in the Global Off-Highway segment, which fell 61% year-over-year to just $18 million. This weakness was partially offset by growth in North America On-Highway (+4%) and Defense (+10%) segments.
Detailed Financial Analysis
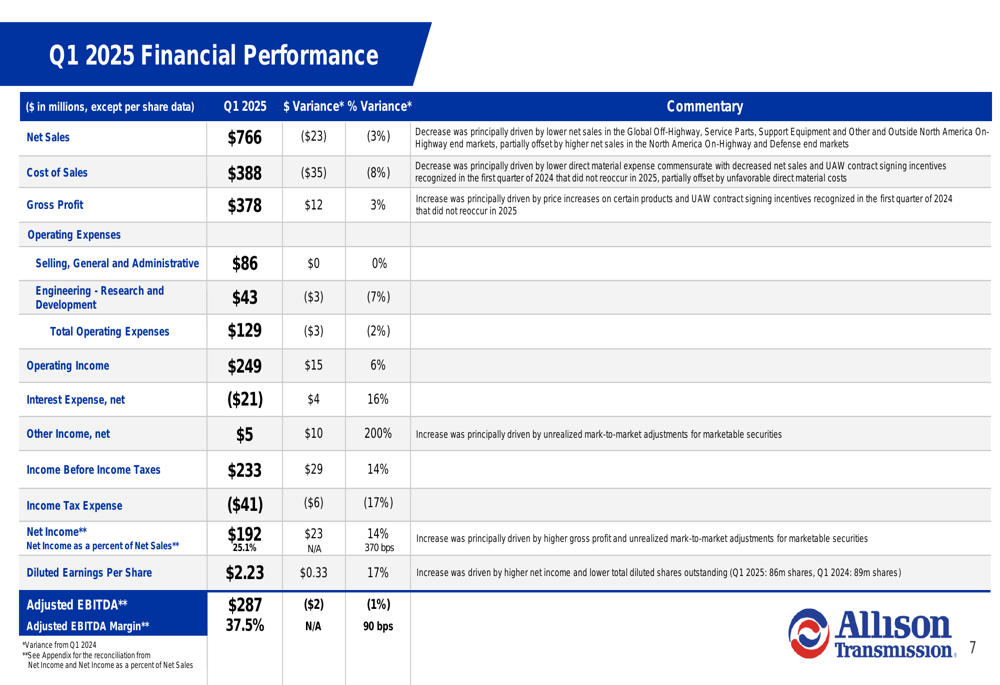
A closer examination of Allison’s financial performance reveals several positive trends. The company’s cost of sales decreased by 8% year-over-year to $388 million, outpacing the 3% decline in revenue. This cost efficiency helped drive the improvement in gross profit and overall margins.
Operating expenses also decreased by 2% to $129 million, contributing to a 6% increase in operating income, which reached $249 million. These factors, combined with other financial improvements, resulted in the 14% increase in net income.
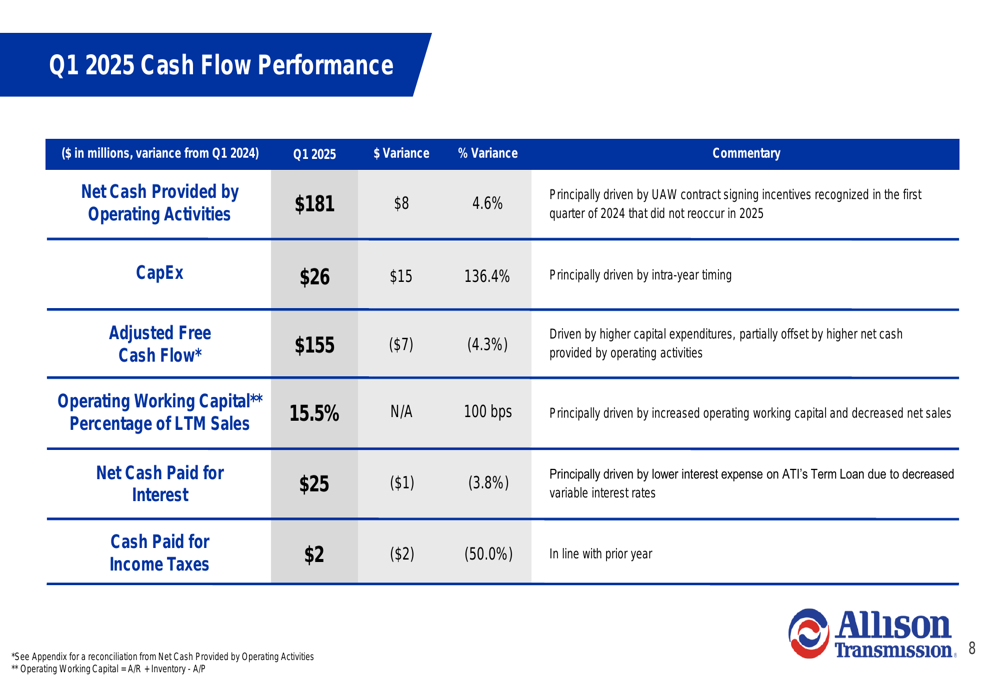
Cash flow metrics showed mixed results, with net cash provided by operating activities increasing 4.6% to $181 million, while adjusted free cash flow declined 4.3% to $155 million. The decrease in free cash flow was primarily due to significantly higher capital expenditures, which more than doubled year-over-year to $26 million (+136.4%).
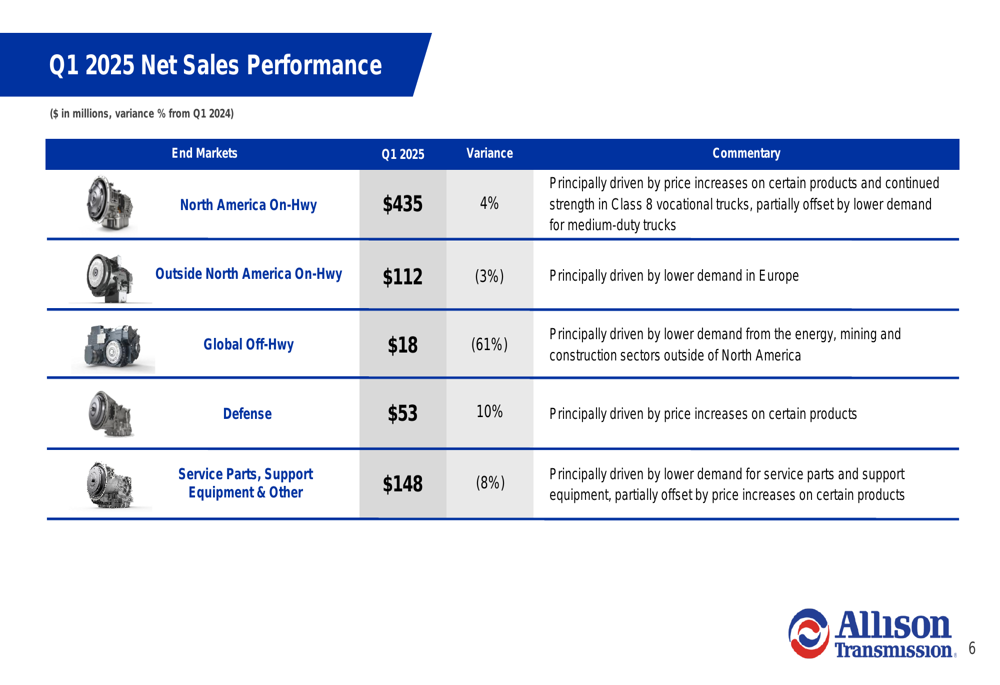
The company’s end market performance reveals divergent trends. The North America On-Highway segment, Allison’s largest market, continued to show strength with 4% growth to $435 million, driven by price increases and continued robust demand for Class 8 vocational trucks, partially offset by lower demand for medium-duty trucks.
The Defense segment also performed well, growing 10% to $53 million, primarily due to price increases on certain products. However, the Global Off-Highway segment experienced a severe contraction, with sales plummeting 61% to $18 million due to lower demand from energy, mining, and construction sectors outside North America. The Outside North America On-Highway segment declined 3% to $112 million, primarily due to weakness in Europe.
Forward-Looking Statements
Allison reaffirmed its full-year 2025 guidance, projecting net sales between $3,200 million and $3,300 million, which would represent another record revenue year. The company expects net income to range from $735 million to $785 million and adjusted EBITDA between $1,170 million and $1,230 million.
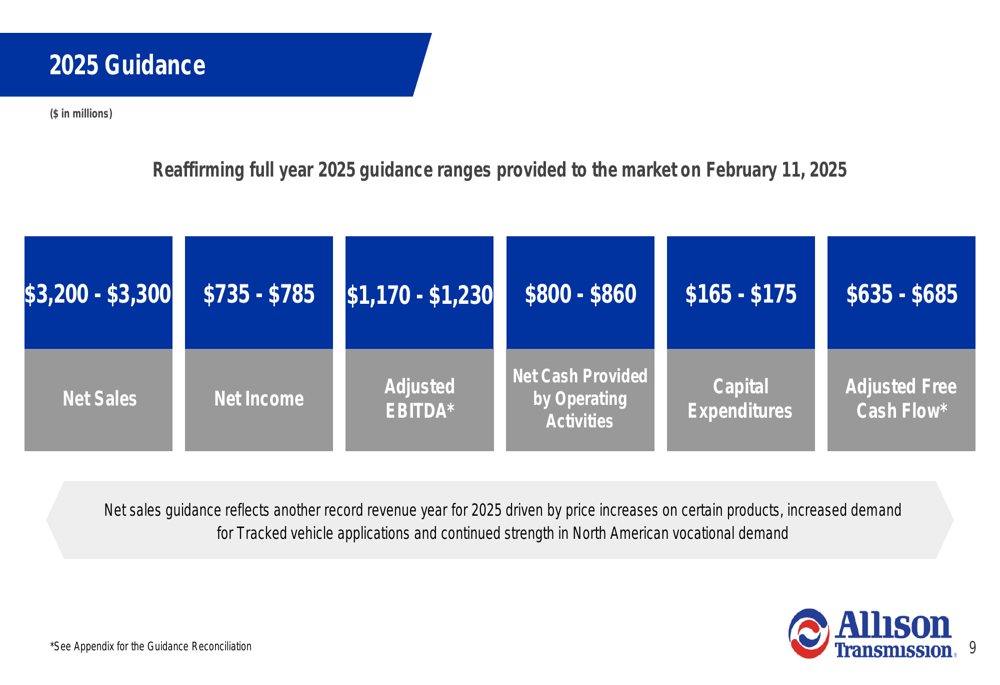
The guidance reflects management’s confidence in continued strong performance driven by price increases, increased demand for tracked vehicle applications, and sustained strength in North American vocational demand. This outlook aligns with the company’s previous statements about robust demand in the Class 8 vocational vehicle market, supported by infrastructure spending.
For investors focused on cash generation, Allison projects net cash provided by operating activities of $800-$860 million and adjusted free cash flow of $635-$685 million for the full year, after accounting for capital expenditures of $165-$175 million.
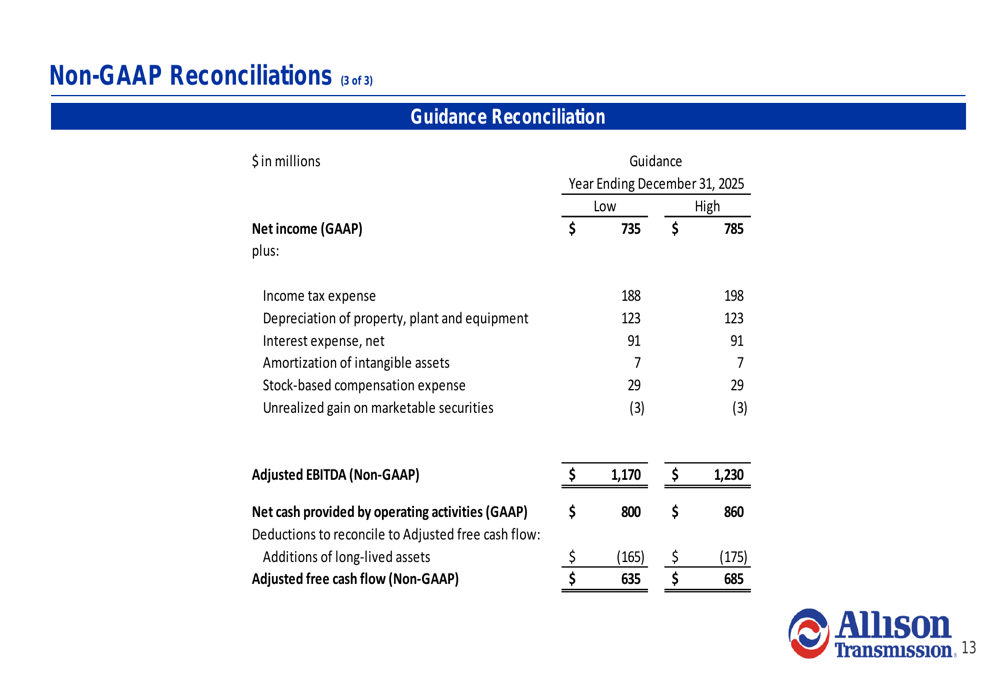
The company provided a detailed reconciliation of its non-GAAP financial measures, showing the components that bridge from GAAP net income to adjusted EBITDA, as well as from operating cash flow to adjusted free cash flow:
Allison’s Q1 2025 results demonstrate the company’s resilience in navigating market challenges through operational efficiency and strategic focus on high-margin segments. With reaffirmed guidance and continued strength in key markets, the company appears well-positioned to maintain its profitability momentum throughout 2025, despite ongoing weakness in certain global segments.
Full presentation:
This article was generated with the support of AI and reviewed by an editor. For more information see our T&C.