Microvast Holdings announces departure of chief financial officer

Introduction & Market Context
Alphabet (NASDAQ:GOOGL) Inc. (NASDAQ:GOOG) presented its Q2 2025 earnings results on July 23, 2025, revealing strong revenue growth across most business segments while significantly ramping up capital investments. The technology giant reported a 14% year-over-year revenue increase to $96.43 billion, with net income rising 19% to $28.2 billion.
The company’s stock closed at $192.11 on the day of the announcement and moved slightly higher in after-hours trading, up 0.19% to $192.47, suggesting investors responded positively to the results.
Quarterly Performance Highlights
Alphabet delivered solid financial performance in the second quarter of 2025, maintaining consistent operating margins while growing its top and bottom lines. Revenue reached $96.43 billion, up 14% from $84.74 billion in the same quarter last year. Net income grew at an even faster pace, increasing 19% year-over-year to $28.2 billion, resulting in diluted earnings per share of $2.31, a 22% improvement from Q2 2024.
As shown in the following income statement from the presentation:
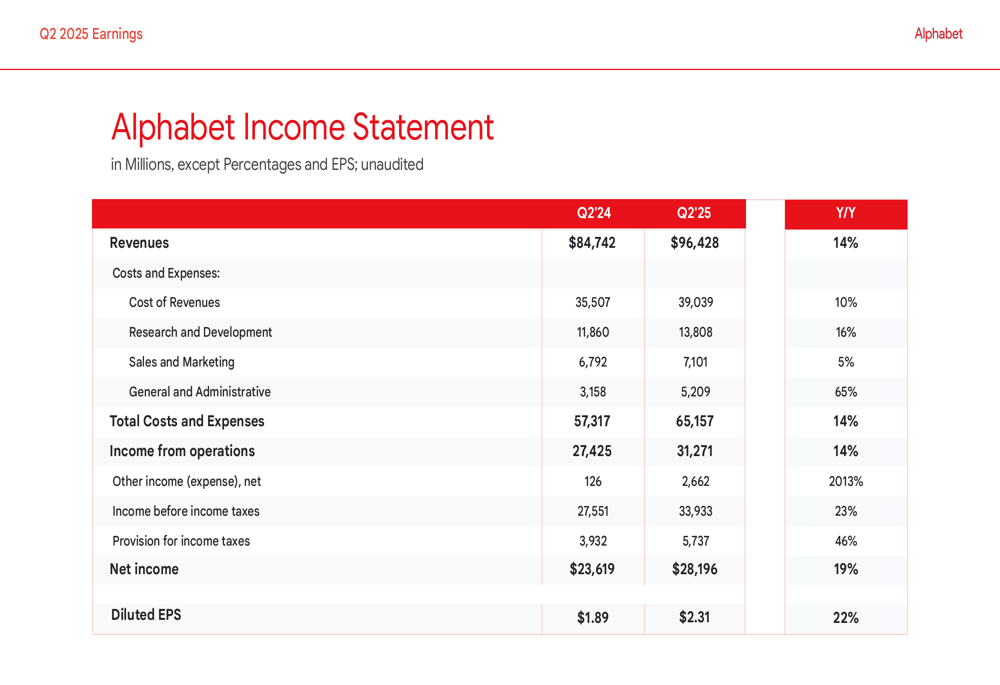
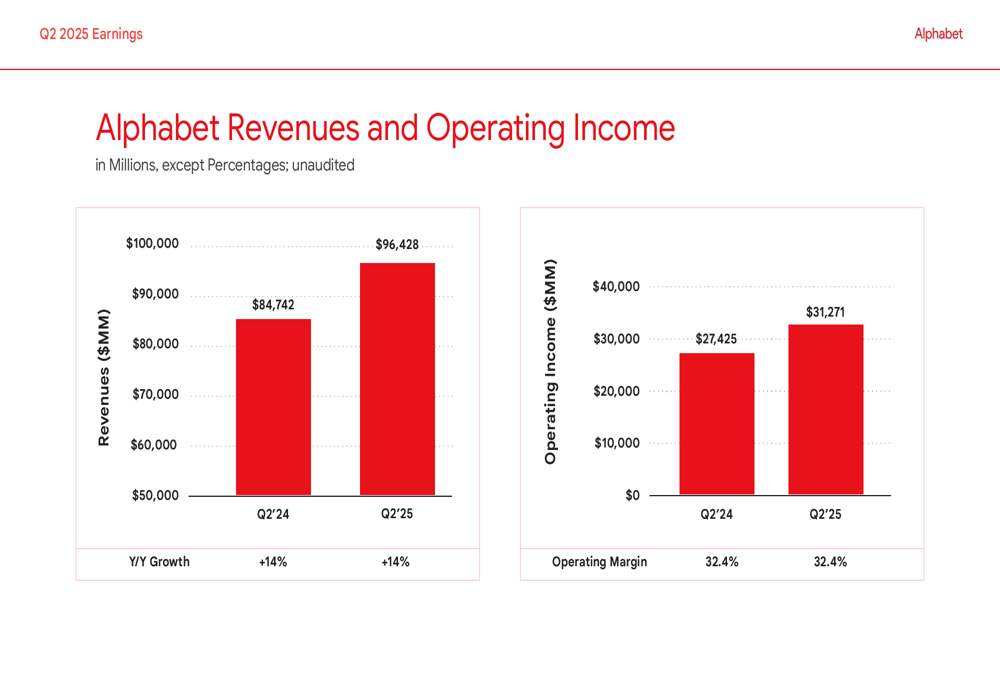
Operating income rose to $31.27 billion, representing a 14% year-over-year increase, while maintaining a stable operating margin of 32.4%. This consistency in margin despite significant investments in research and development (up 16%) and a substantial 65% increase in general and administrative expenses demonstrates Alphabet’s ability to balance growth with profitability.
The revenue and operating income growth are clearly illustrated in this chart:
Detailed Financial Analysis
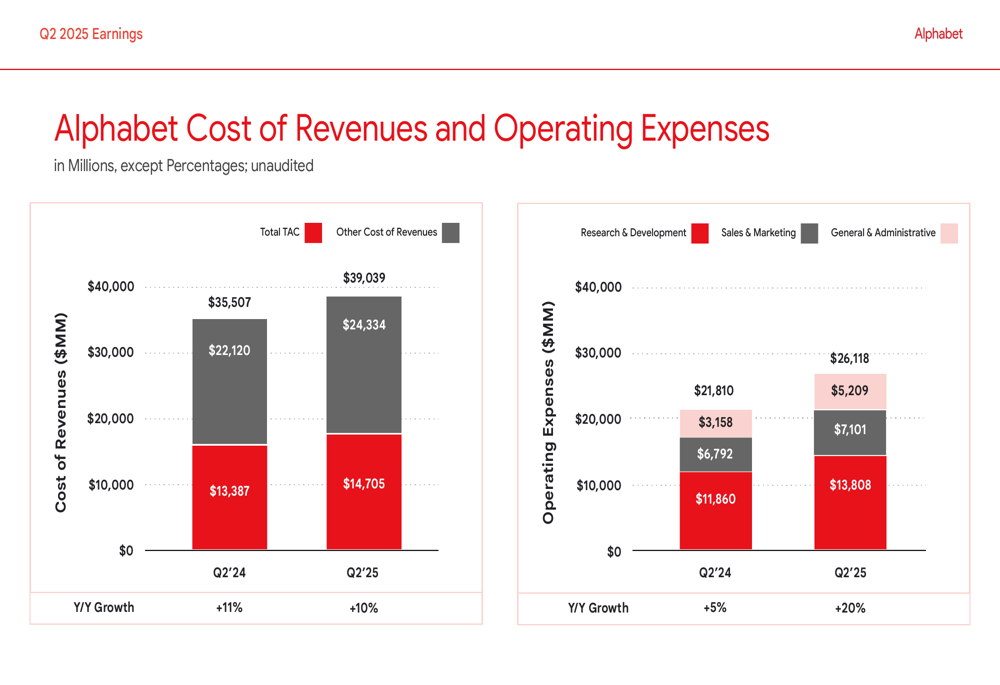
Breaking down Alphabet’s cost structure reveals that while the company increased spending across all categories, it managed to keep cost growth in check relative to revenue expansion. Cost of revenues grew by 10% year-over-year to $39.04 billion, with traffic acquisition costs (TAC) increasing by 11% to $14.71 billion.
The company’s operating expenses saw varied growth rates, with research and development expenses increasing 16% to $13.81 billion, reflecting continued investment in innovation. Sales and marketing expenses grew more modestly at 5% to $7.10 billion, while general and administrative expenses surged 65% to $5.21 billion.
The following chart details these expense categories:
Google Services Performance
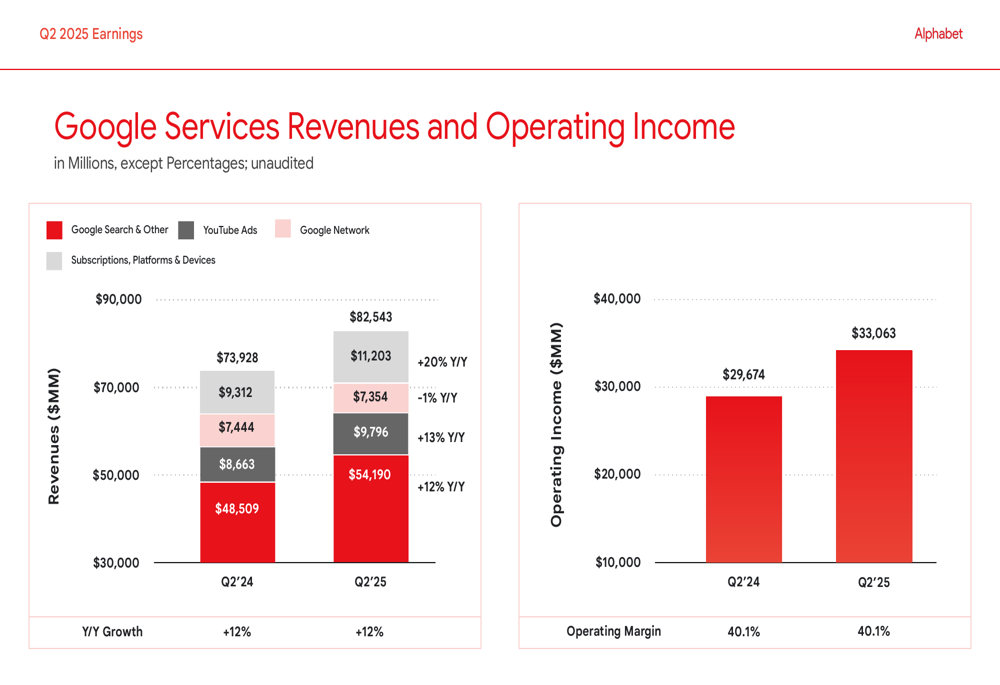
Google Services, which includes the company’s core advertising business, subscriptions, and devices, continued to deliver strong results. Google Search & Other revenue grew to $54.19 billion, up from $48.51 billion in Q2 2024. YouTube advertising revenue increased to $9.80 billion from $8.66 billion a year earlier, representing a 13% growth.
The Subscriptions, Platforms & Devices segment showed particularly strong momentum, with revenue growing to $11.20 billion from $9.31 billion, a 20% increase. However, Google Network revenue slightly declined to $7.35 billion from $7.44 billion in the prior year.
Despite the varied performance across segments, Google Services maintained a consistent operating margin of 40.1%, generating $33.06 billion in operating income, as shown in this breakdown:
Google Cloud’s Impressive Growth
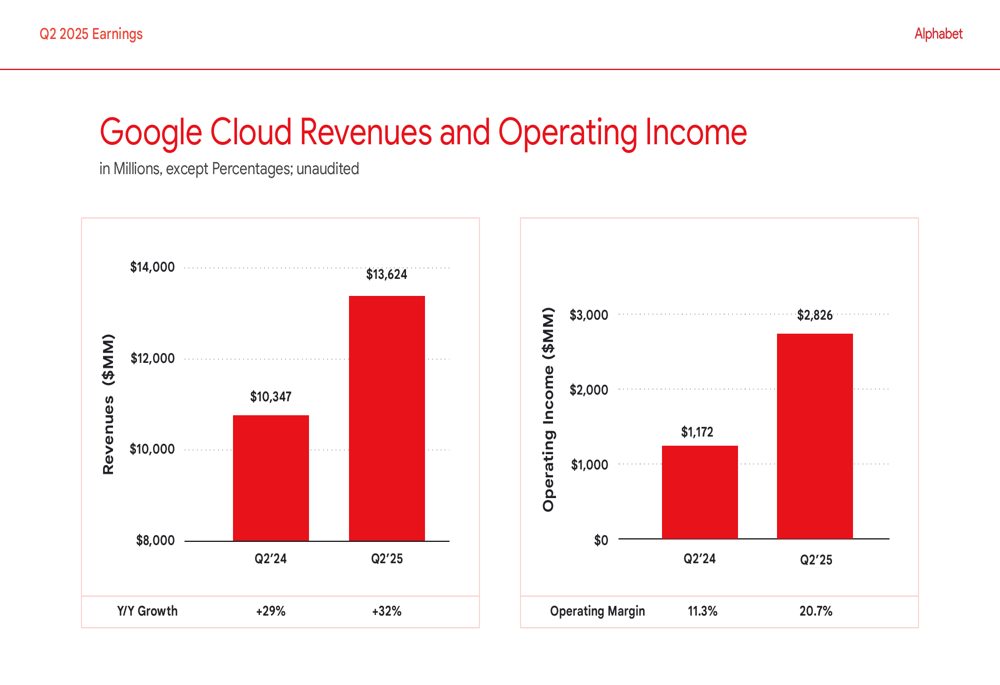
Google Cloud emerged as a standout performer in Q2 2025, with revenue surging 32% year-over-year to $13.62 billion. Even more impressive was the segment’s profitability improvement, with operating income more than doubling to $2.83 billion from $1.17 billion a year earlier. This translated to an operating margin of 20.7%, up significantly from 11.3% in Q2 2024.
This dramatic improvement in Google Cloud’s profitability suggests the segment is achieving greater scale and operational efficiency, potentially positioning it as a more formidable competitor to market leaders AWS and Microsoft (NASDAQ:MSFT) Azure. The following chart illustrates Google Cloud’s impressive growth trajectory:
Capital Expenditure and Cash Flow Analysis
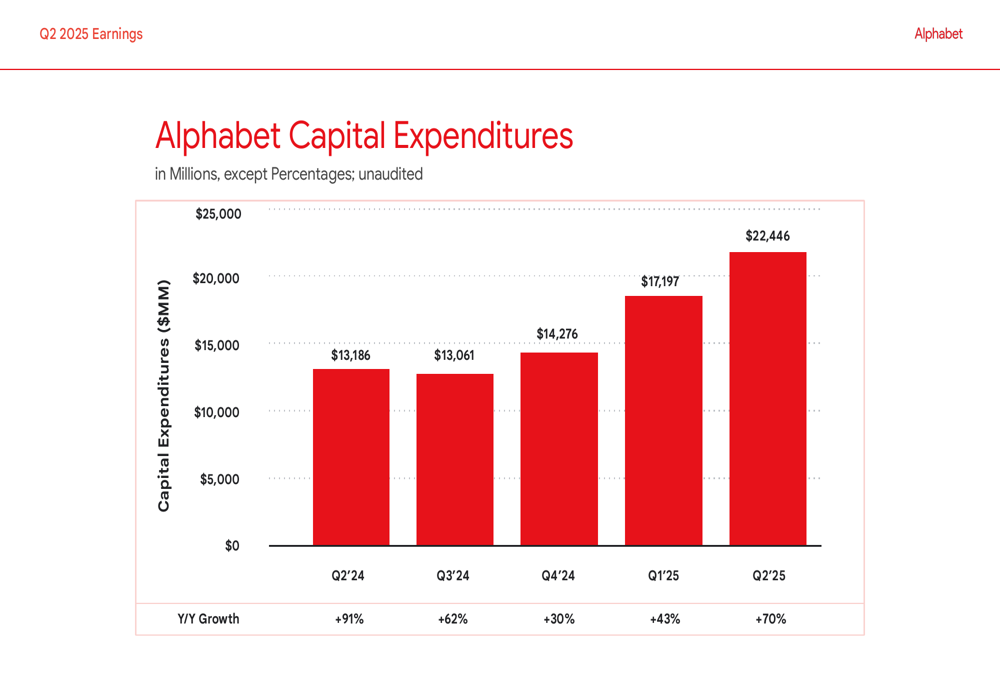
Perhaps the most striking aspect of Alphabet’s Q2 2025 results was the dramatic increase in capital expenditures, which surged 70% year-over-year to $22.45 billion. This represents a significant acceleration from previous quarters and suggests the company is making substantial investments in infrastructure, likely to support AI initiatives and cloud services expansion.
The quarterly progression of capital expenditures shows a clear upward trajectory:
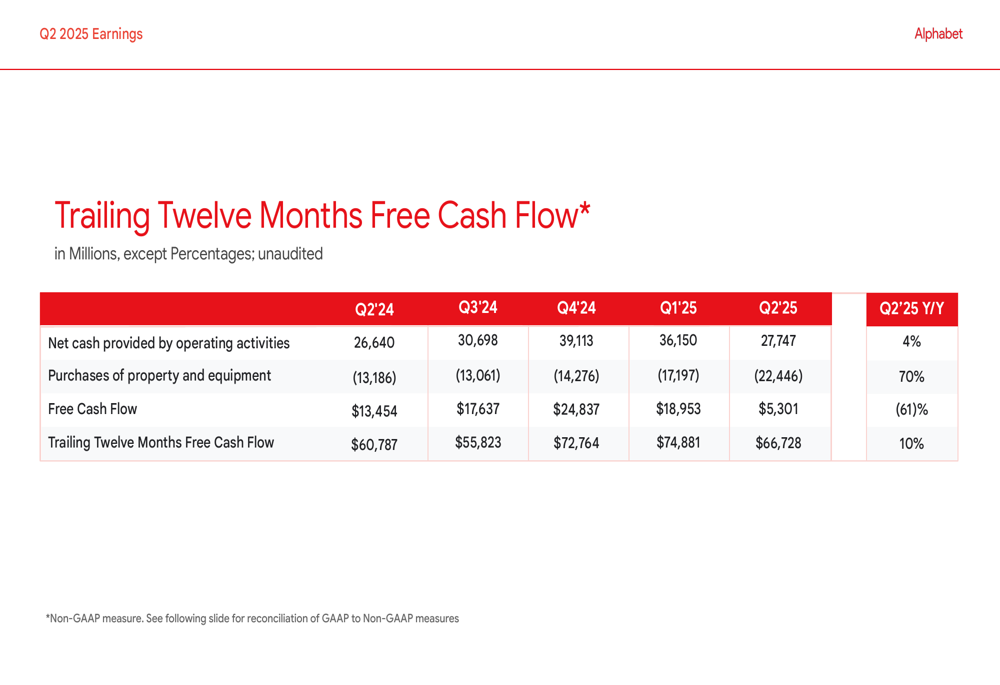
This aggressive investment strategy has had a notable impact on Alphabet’s free cash flow, which declined 61% year-over-year to $5.30 billion in Q2 2025. However, on a trailing twelve-month basis, free cash flow increased 10% to $66.73 billion, indicating that the company’s long-term cash generation capabilities remain strong despite the short-term impact of increased investments.
The following chart details the components of Alphabet’s free cash flow:
Forward-Looking Implications
Alphabet’s Q2 2025 results paint a picture of a company investing heavily for future growth while maintaining strong current performance. The substantial increase in capital expenditures, combined with higher R&D spending, suggests Alphabet is positioning itself for the next wave of technological advancement, particularly in AI and cloud computing.
The impressive performance of Google Cloud, with its accelerating revenue growth and expanding profit margins, indicates that Alphabet’s diversification strategy is bearing fruit. As the cloud segment continues to scale, it could become an increasingly important contributor to the company’s overall profitability.
While the short-term impact on free cash flow bears watching, Alphabet’s consistent operating margins and strong revenue growth across most segments suggest the company remains in a strong competitive position. Investors will likely focus on whether these substantial investments will translate into sustained growth and market share gains in the coming quarters.
Full presentation:
This article was generated with the support of AI and reviewed by an editor. For more information see our T&C.