Can anything shut down the Gold rally?

Introduction & Market Context
Altus Group Limited (TSX:AIF) presented its first quarter 2025 financial results on May 8, 2025, highlighting improved profitability metrics despite modest revenue growth in a challenging commercial real estate market environment. The company’s shares closed at C$52.21 on the day of the earnings release, up 0.19% from the previous close.
The company’s strategic focus on recurring revenue streams and cloud-based solutions continues to yield results, with its Analytics segment showing resilience while the Appraisals & Development Advisory segment navigates through macro headwinds.
Quarterly Performance Highlights
Altus Group reported total revenue of $129.2 million for Q1 2025, representing a 1.5% increase at constant currency compared to Q1 2024. Despite the modest top-line growth, the company significantly improved its profitability metrics, with adjusted EBITDA rising 29.7% to $15.7 million and adjusted EBITDA margin expanding 280 basis points to 12.2%.
The company reduced its loss from continuing operations to $6.4 million, a 47.1% improvement from the $12.2 million loss in the same period last year. Adjusted earnings per share turned positive at $0.19, compared to a loss of $0.01 in Q1 2024.
As shown in the following comprehensive financial summary:
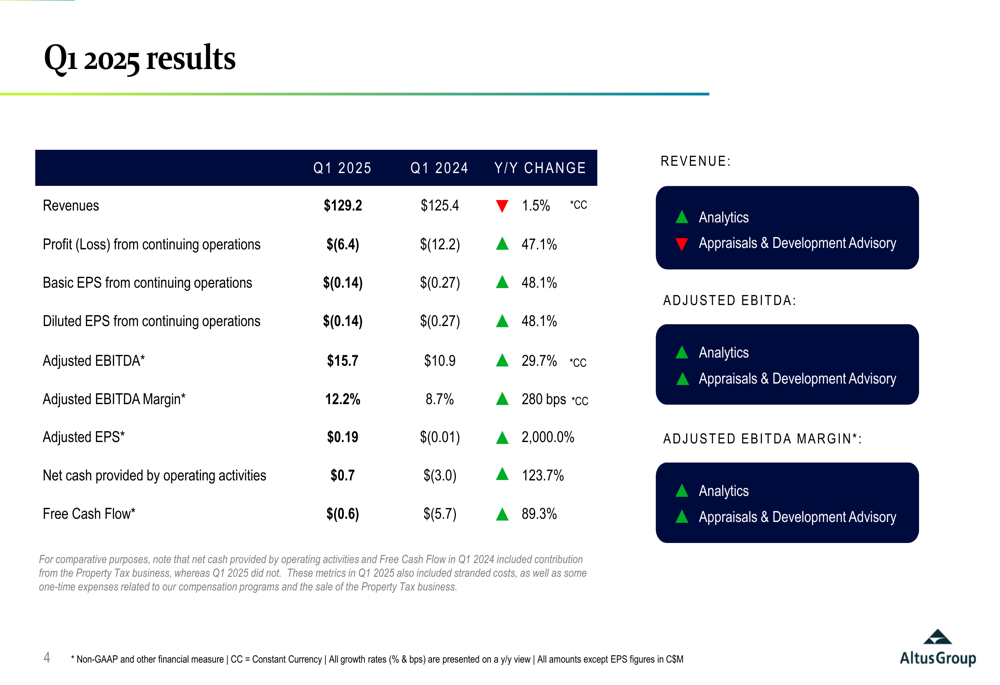
Free cash flow also improved significantly, with the negative $0.6 million representing an 89.3% improvement from the negative $5.7 million in Q1 2024. This improvement reflects the company’s focus on operational efficiency and working capital management.
Analytics Segment Performance
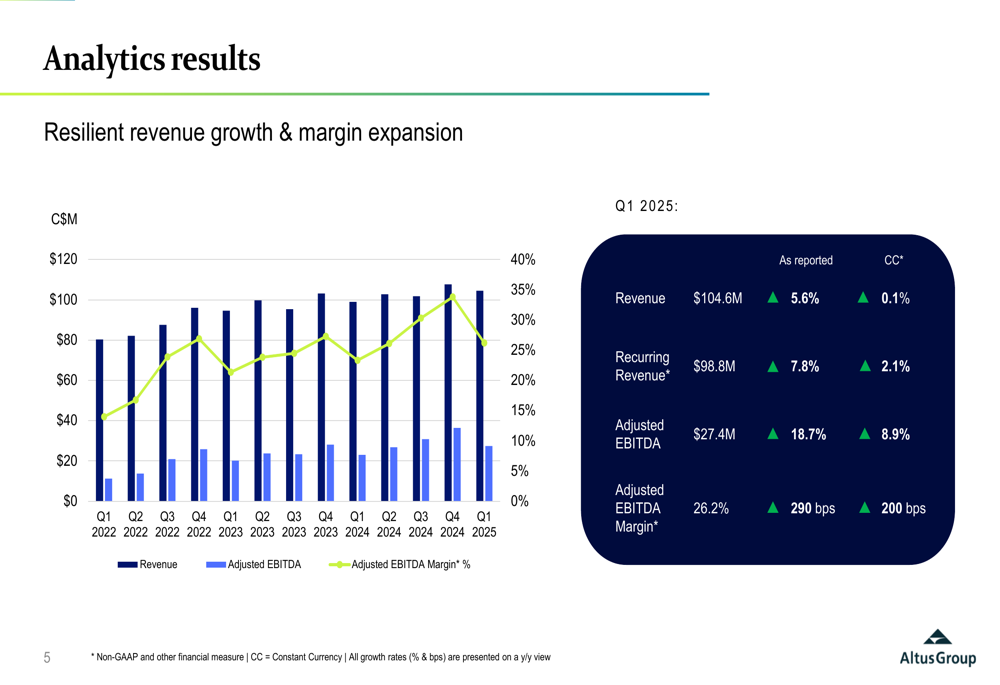
The Analytics segment, which represents approximately 81% of total revenue, continued to be the primary growth driver for Altus Group. The segment generated $104.6 million in revenue, up 5.6% (0.1% at constant currency) from Q1 2024, with recurring revenue growing 7.8% (2.1% at constant currency) to $98.8 million.
More importantly, the segment’s profitability improved substantially, with adjusted EBITDA increasing 18.7% to $27.4 million and adjusted EBITDA margin expanding 290 basis points to 26.2%.
The following chart illustrates the segment’s performance trends:
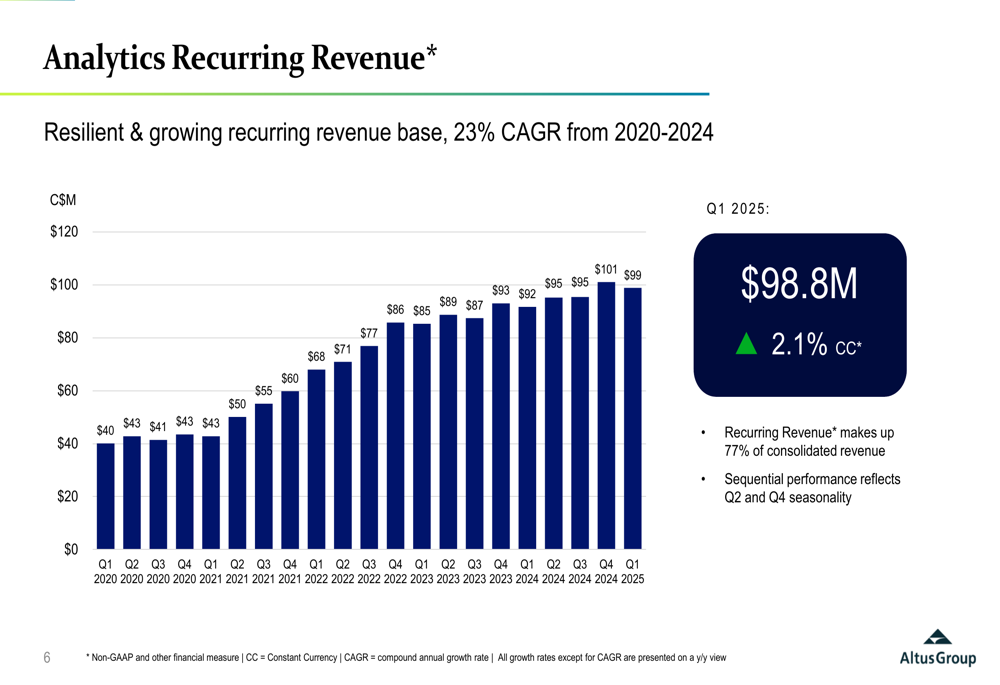
A key strength of the Analytics segment is its growing recurring revenue base, which has achieved a 23% CAGR from 2020 to 2024. Recurring revenue now accounts for 77% of consolidated revenue, providing stability and predictability to the company’s financial performance.
The trend of recurring revenue growth is clearly visible in this chart:
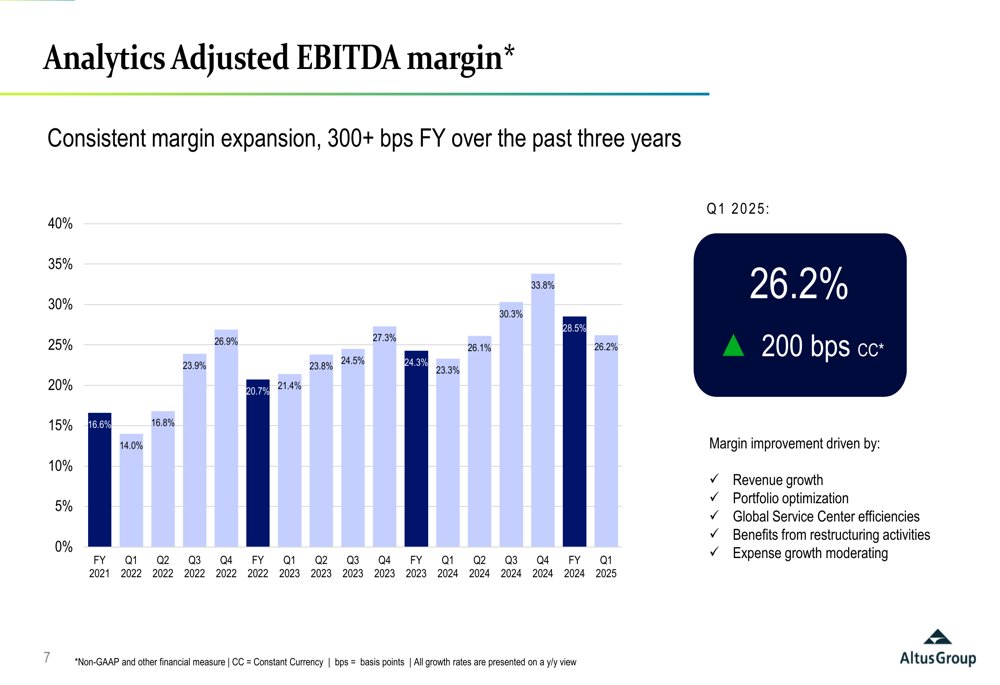
The segment has also demonstrated consistent margin expansion, with more than 300 basis points improvement annually over the past three years. This expansion is attributed to revenue growth, portfolio optimization, Global Service Center efficiencies, benefits from restructuring activities, and moderating expense growth.
As shown in the following margin trend chart:
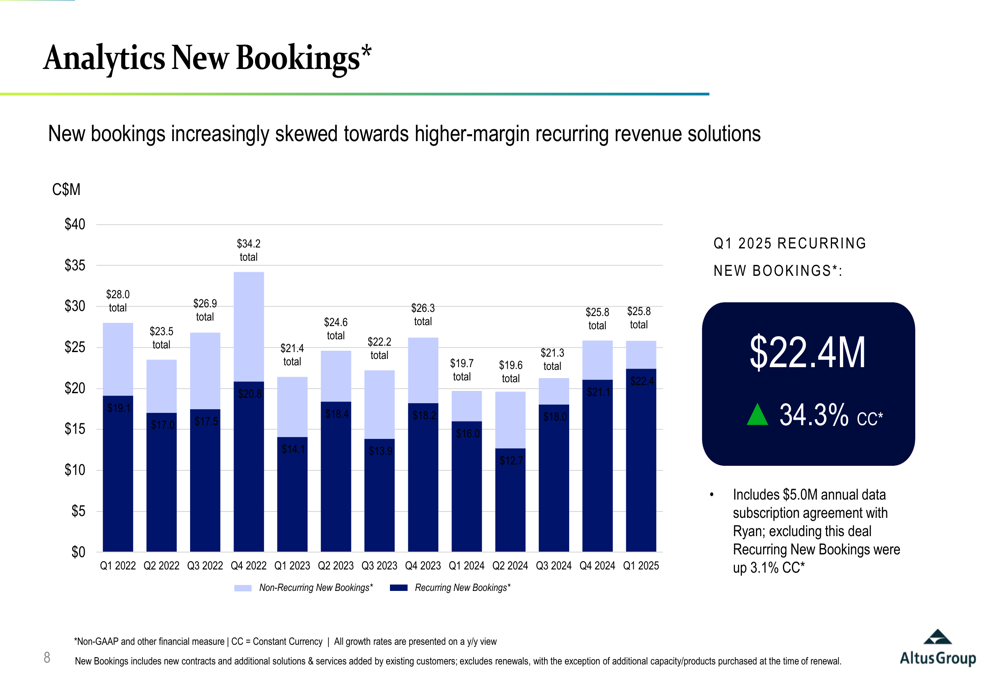
New bookings in the Analytics segment are increasingly skewed toward higher-margin recurring revenue solutions. In Q1 2025, recurring new bookings reached $22.4 million, up 34.3% at constant currency, including a $5.0 million annual data subscription agreement with Ryan. Even excluding this deal, recurring new bookings were up 3.1% at constant currency.
The shift toward recurring revenue is illustrated in this booking trend:
Appraisals & Development Advisory Segment
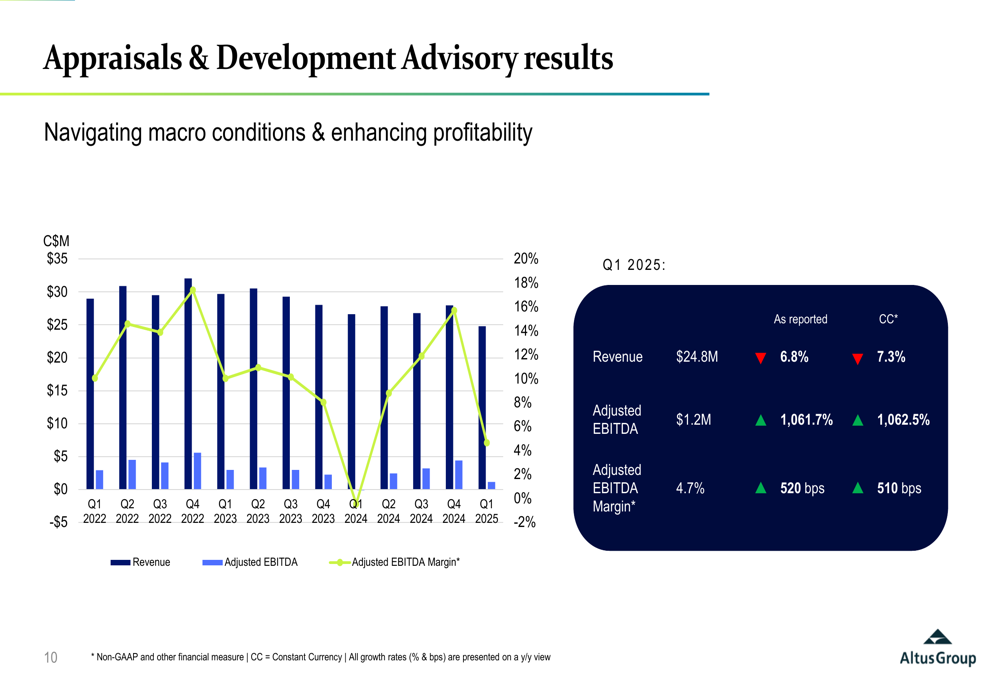
The Appraisals & Development Advisory segment faced more challenging conditions, with revenue declining 6.8% (7.3% at constant currency) to $24.8 million. However, the segment significantly improved its profitability, with adjusted EBITDA increasing to $1.2 million from a small loss in the prior year, and adjusted EBITDA margin expanding 520 basis points to 4.7%.
The following chart shows the segment’s performance:
Balance Sheet and Capital Allocation
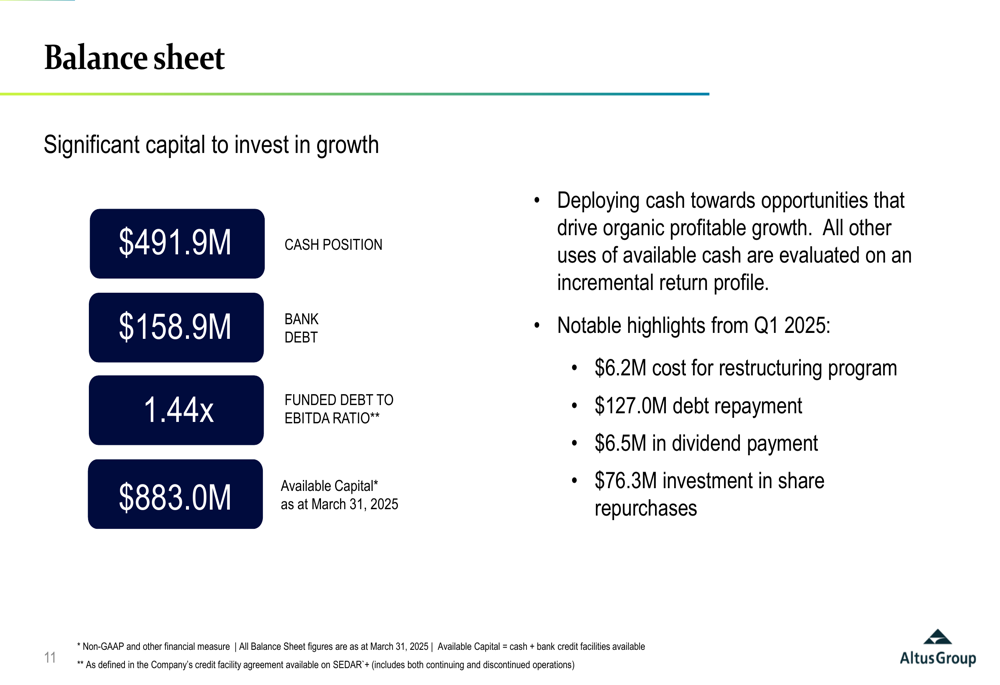
Altus Group maintained a strong balance sheet, with a cash position of $491.9 million as of March 31, 2025, and bank debt of $158.9 million. The funded debt to EBITDA ratio improved to 1.44x, and the company had $883.0 million in available capital.
During Q1 2025, the company deployed capital strategically, with $76.3 million invested in share repurchases, $127.0 million in debt repayment, and $6.5 million in dividend payments. The company also incurred $6.2 million in costs for its restructuring program, primarily related to the Property Tax business sale.
The following slide details the company’s balance sheet strength and capital allocation:
Product Innovation and Strategic Initiatives
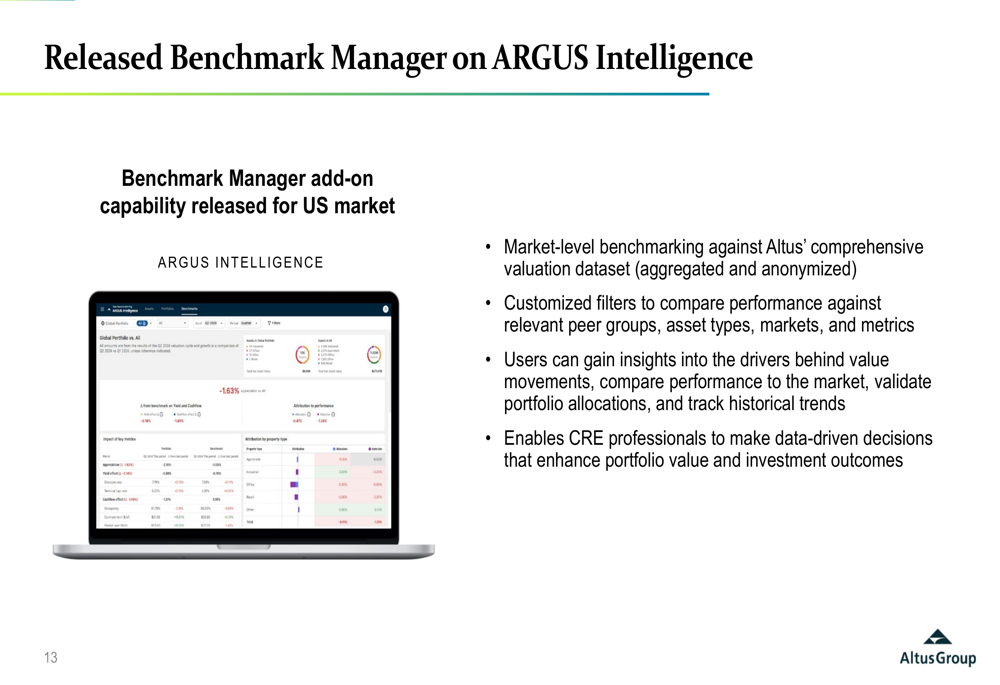
A significant development in Q1 2025 was the release of the Benchmark Manager functionality on the ARGUS Intelligence platform. This new feature allows for market-level benchmarking against Altus’ comprehensive valuation dataset, with customized filters to compare performance against relevant peer groups, asset types, markets, and metrics.
The Benchmark Manager enables commercial real estate professionals to gain insights into value movements, compare performance to the market, validate portfolio allocations, and track historical trends, facilitating data-driven decisions that enhance portfolio value and investment outcomes.
The interface of ARGUS Intelligence with the new Benchmark Manager is shown below:
The company has also made significant progress in its cloud transition strategy, with the cloud adoption rate reaching 90% in Q1 2025, up from just 6% in Q1 2020. This successful transition to cloud-based subscription revenue provides a more stable and scalable business model.
Other notable product developments include the integration of Forbury with the ARGUS calculation engine for the multi-family asset class in the US, expanding the company’s capabilities in this growing segment.
2025 Business Outlook
Looking ahead, Altus Group provided a positive outlook for 2025, projecting 3-5% consolidated revenue growth and 300-400 basis points of adjusted EBITDA margin expansion for the full year at constant currency.
For the Analytics segment, the company expects 4-7% total revenue growth and 6-9% recurring revenue growth, with 250-350 basis points of adjusted EBITDA margin expansion for the full year. The Appraisals & Development Advisory segment is expected to deliver low single-digit revenue growth with continued margin expansion.
For Q2 2025 specifically, the company projects 1-3% consolidated revenue growth and 200-300 basis points of adjusted EBITDA margin expansion at constant currency.
The company also announced its upcoming Investor Day, scheduled for September 9, 2025, in New York City, where it will likely provide more details on its long-term strategic initiatives and financial targets.
In conclusion, Altus Group’s Q1 2025 results demonstrate the company’s ability to improve profitability and cash flow generation despite modest revenue growth, driven by its focus on recurring revenue, cloud transition, and operational efficiency. The strong balance sheet provides flexibility for both strategic investments and returning capital to shareholders, positioning the company well for sustainable growth.
Full presentation:
This article was generated with the support of AI and reviewed by an editor. For more information see our T&C.