Asahi shares mark weekly slide after cyberattack halts production

Introduction & Market Context
Apollo Global Management, Inc. (NYSE:APO) released its second quarter 2025 financial results on August 5, 2025, reporting solid growth across key metrics despite facing some market headwinds. The company’s stock was trading down 3.01% in premarket at $137.74, suggesting investors may have had higher expectations following a challenging first quarter when the company missed earnings estimates.
The asset management giant reported GAAP Net Income of $605 million, or $1.00 per share, while Adjusted Net Income reached $1.2 billion, or $1.92 per share. These results come against the backdrop of continued market volatility and shifting interest rate expectations.
Quarterly Performance Highlights
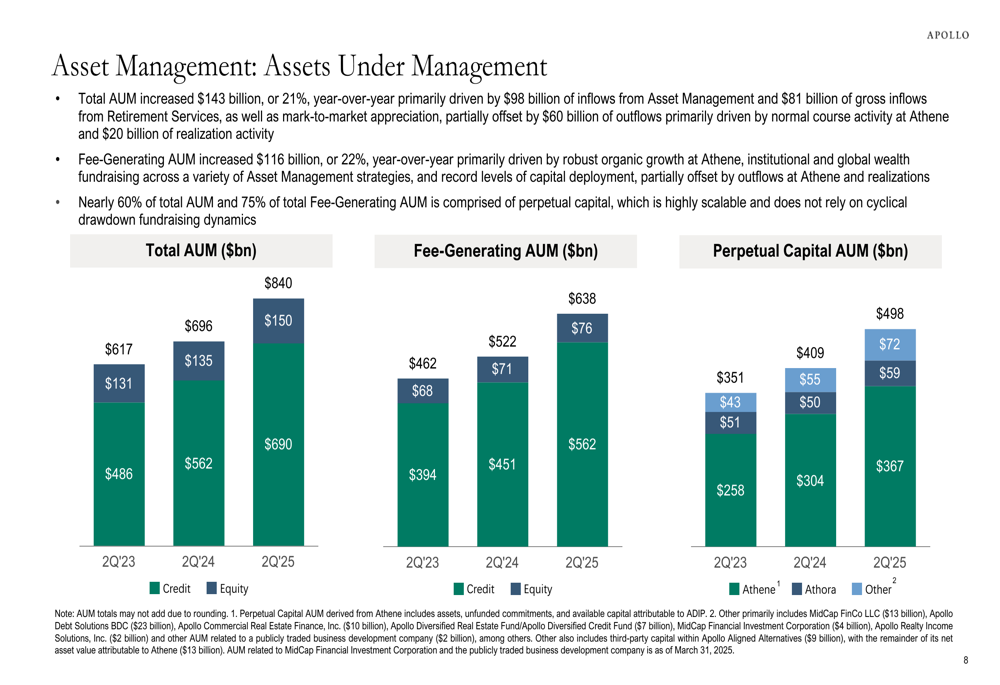
Apollo demonstrated strong performance across its key financial metrics in Q2 2025. Total Assets Under Management (AUM) increased by 21% year-over-year to $840 billion, while Fee-Generating AUM grew by 22% to $638 billion.
As shown in the following comprehensive financial overview from the company’s presentation:
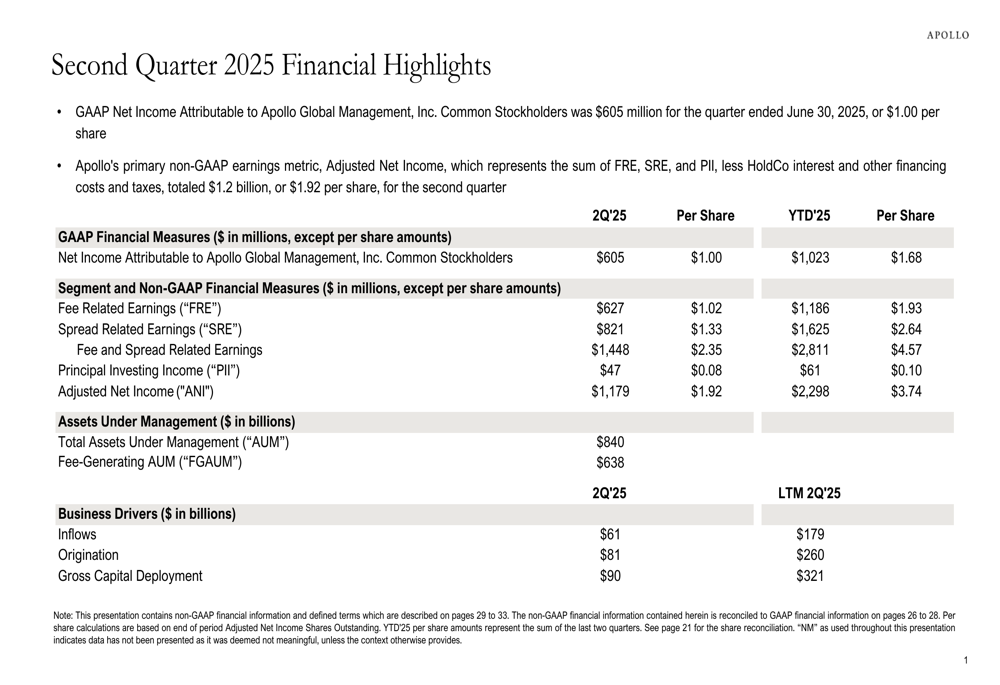
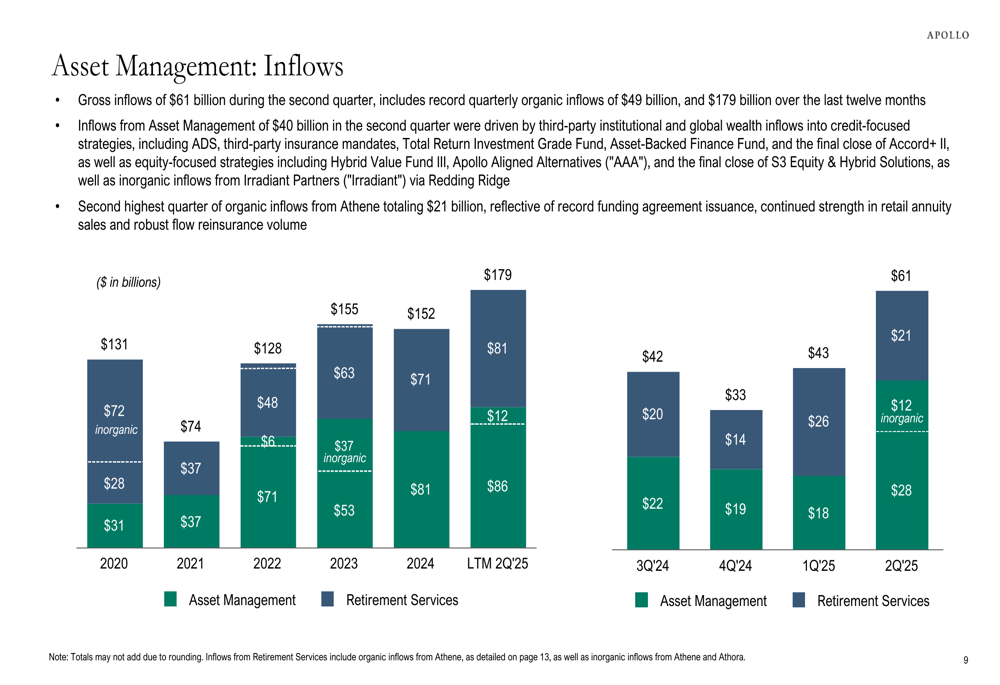
The firm reported robust inflows of $61 billion during the quarter, bringing the last twelve months’ total to $179 billion. This strong capital raising was accompanied by origination of $81 billion in Q2 and $260 billion over the last twelve months, demonstrating Apollo’s continued ability to deploy capital effectively.
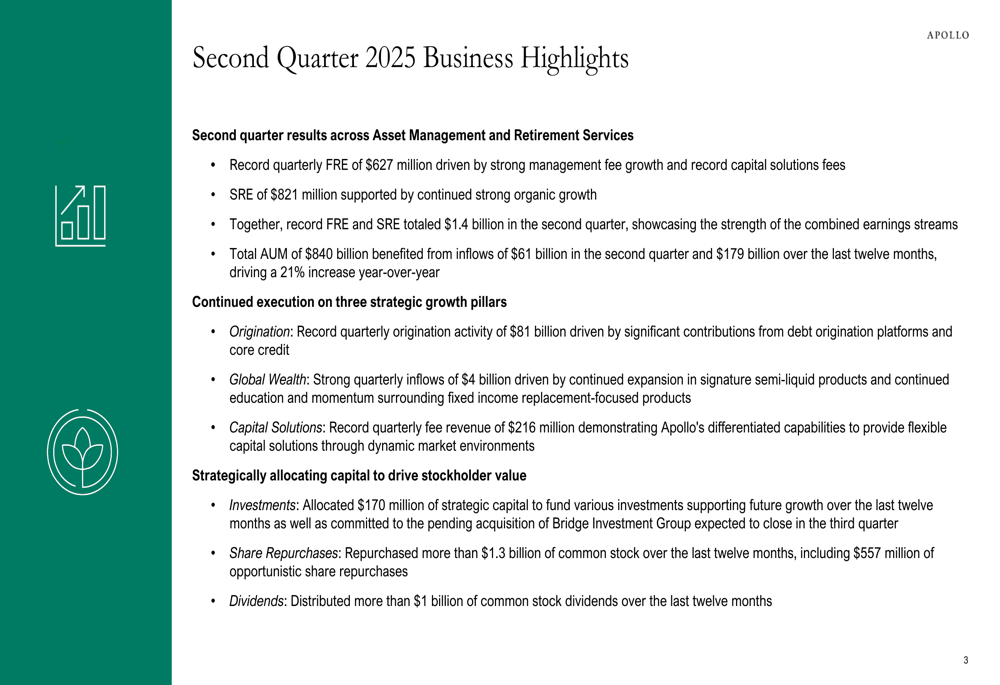
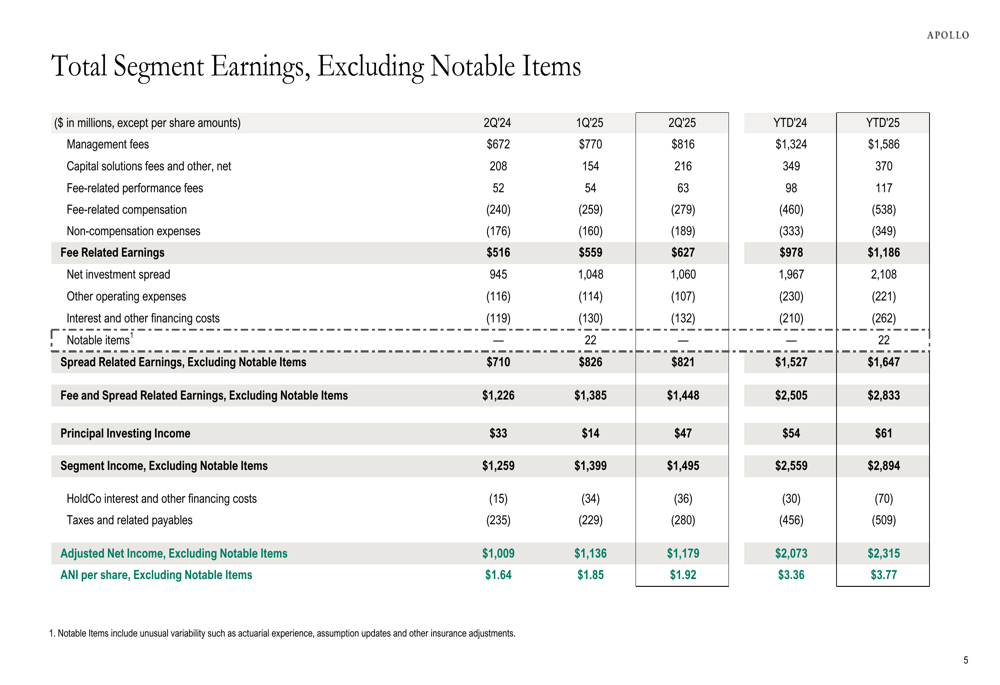
Fee Related Earnings (FRE) reached a record $627 million, representing a 21.5% increase year-over-year, while Spread Related Earnings (SRE) contributed $821 million. Together, FRE and SRE totaled $1.4 billion for the quarter, highlighting the strength of Apollo’s diversified business model.
The company’s business highlights for the quarter are summarized in the following slide:
Segment Analysis
Asset Management
Apollo’s Asset Management segment continued to show strong momentum, with management fees increasing by 21% year-over-year. Fee-related performance fees also grew by 21% compared to the same period last year, contributing to the segment’s overall robust performance.
The following slide details the Asset Management segment’s financial performance:
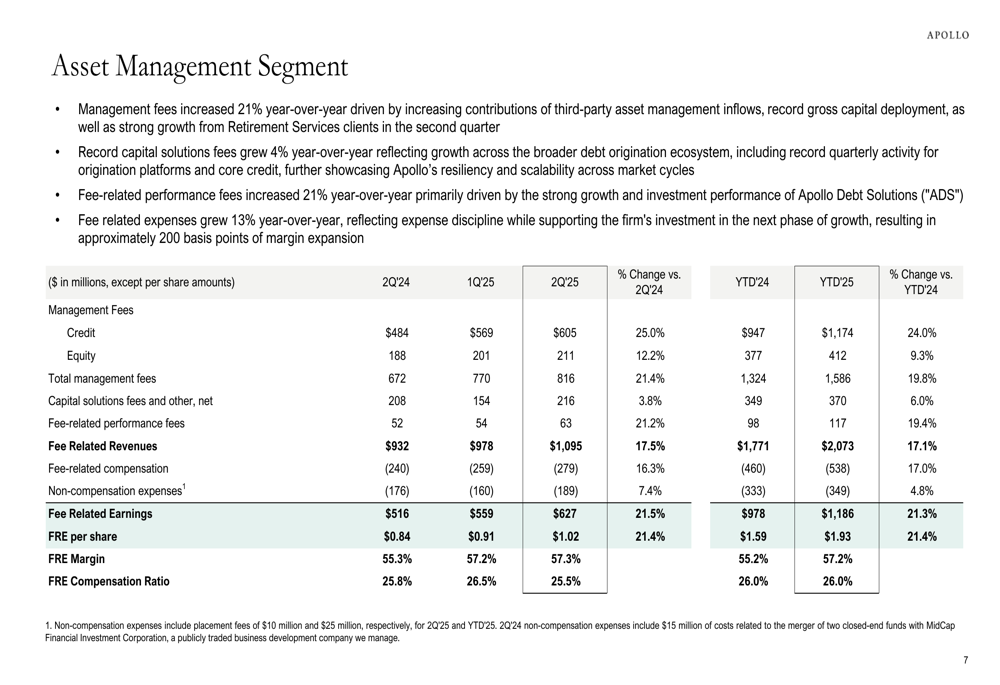
The segment maintained a healthy FRE margin of 57.3%, reflecting operational efficiency and scale benefits. The company’s inflow trends remained strong, with gross inflows of $61 billion during the second quarter, including record quarterly organic inflows of $49 billion.
The breakdown of these inflows is illustrated in the following chart:
Retirement Services
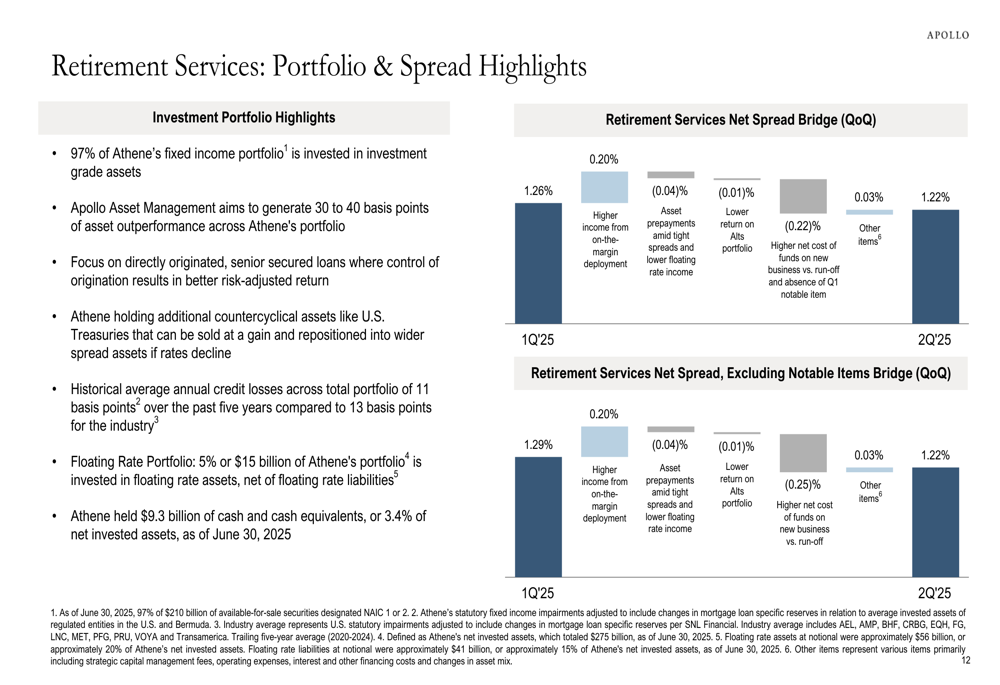
Apollo’s Retirement Services segment, primarily through Athene, continued to demonstrate strong growth. The company highlighted that 97% of Athene’s fixed income portfolio is invested in investment-grade assets, emphasizing the quality and stability of its investments.
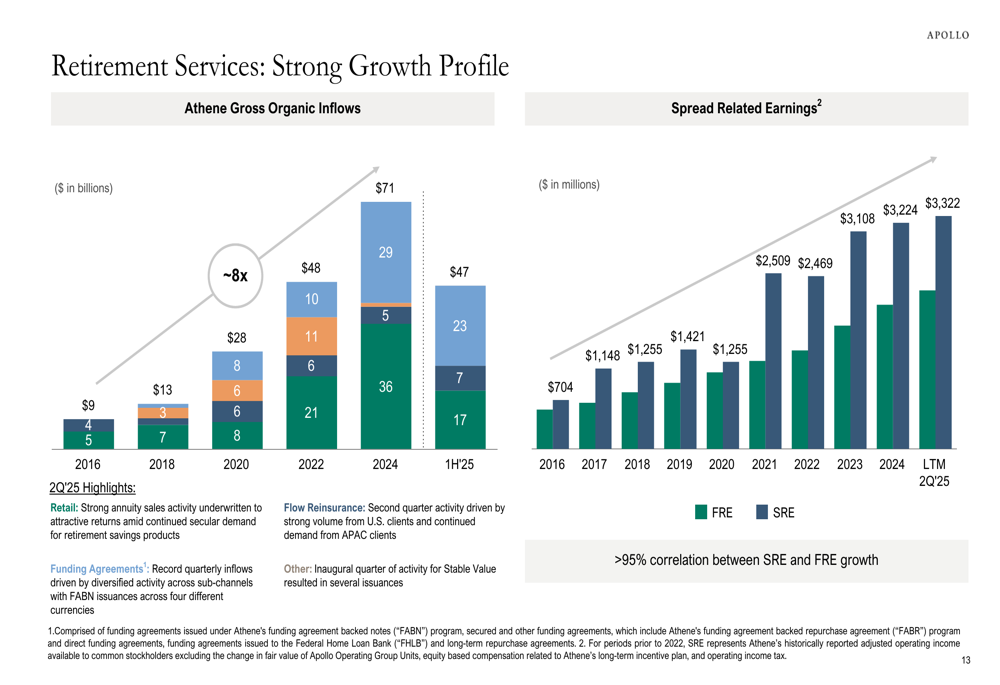
The following slide illustrates the strong growth profile of the Retirement Services segment:
Spread Related Earnings reached $3,322 million, showing a strong correlation (>95%) with FRE growth. This alignment between segments underscores the synergistic nature of Apollo’s business model, which combines asset management expertise with retirement solutions.
The company’s portfolio and spread highlights are detailed in this slide:
Principal Investing
The Principal Investing segment also delivered solid results, with realized performance fees in Q2 2025 reaching $219 million, up 25% year-over-year. Principal Investing Income was $47 million for the quarter, compared to $33 million in Q2 2024.
Investment Performance & Capital Allocation
Apollo’s investment performance remained strong across various strategies. Credit Direct Origination returned 3.2% in Q2 and 12.0% over the last twelve months, while Hybrid Value delivered 3.1% and 17.4% over the same periods, respectively.
The company’s investment performance across strategies is detailed in the following slide:
Apollo continued to demonstrate financial strength and disciplined capital allocation. The company returned approximately $1.7 billion of capital to stockholders while allocating around $170 million to strategic investments for future growth. The firm maintained strong financial strength ratings of A2/A/A from Moody’s, S&P, and Fitch, respectively.
Forward-Looking Statements
Chairman and CEO Marc Rowan emphasized the strength of Apollo’s business model, noting that the second quarter results reflect the company’s focus on "long-term growth themes including retirement, wealth, industrial renaissance, and the public-private convergence."
The company announced a cash dividend of $0.51 per share of common stock, payable on August 29, 2025, to holders of record as of August 18, 2025. Additionally, Apollo declared a dividend of $0.8438 per share of Mandatory Convertible Preferred Stock, payable on October 31, 2025.
Apollo’s performance in Q2 2025 builds on its long-term growth trajectory, though investors will be watching closely to see if the company can maintain this momentum in the face of evolving market conditions. The slight premarket decline suggests that despite strong headline numbers, some aspects of the results may have fallen short of market expectations, potentially continuing the trend seen in Q1 when the company missed EPS estimates.
With $72 billion in dry powder and a diversified business model spanning asset management and retirement services, Apollo appears well-positioned to navigate market volatility while pursuing strategic growth opportunities.
Full presentation:
This article was generated with the support of AI and reviewed by an editor. For more information see our T&C.