Dell falls as soft current quarter guide offsets Q2 beat, full-year outlook lift

Ardent Health Partners LLC (ARDT) reported strong second-quarter results on August 6, 2025, showcasing significant acceleration in both revenue and profitability metrics compared to the previous quarter. The healthcare provider’s stock, which has struggled this year, responded positively with a 2.72% gain in after-hours trading following the announcement.
Quarterly Performance Highlights
Ardent Health delivered impressive financial results for Q2 2025, with total revenue reaching $1.645 billion, representing an 11.9% year-over-year increase. This marks a substantial acceleration from the 4% revenue growth reported in Q1. The company’s adjusted EBITDA surged 38.9% to $170 million, compared to $122.3 million in the same period last year.
As shown in the following chart of quarterly financial performance:
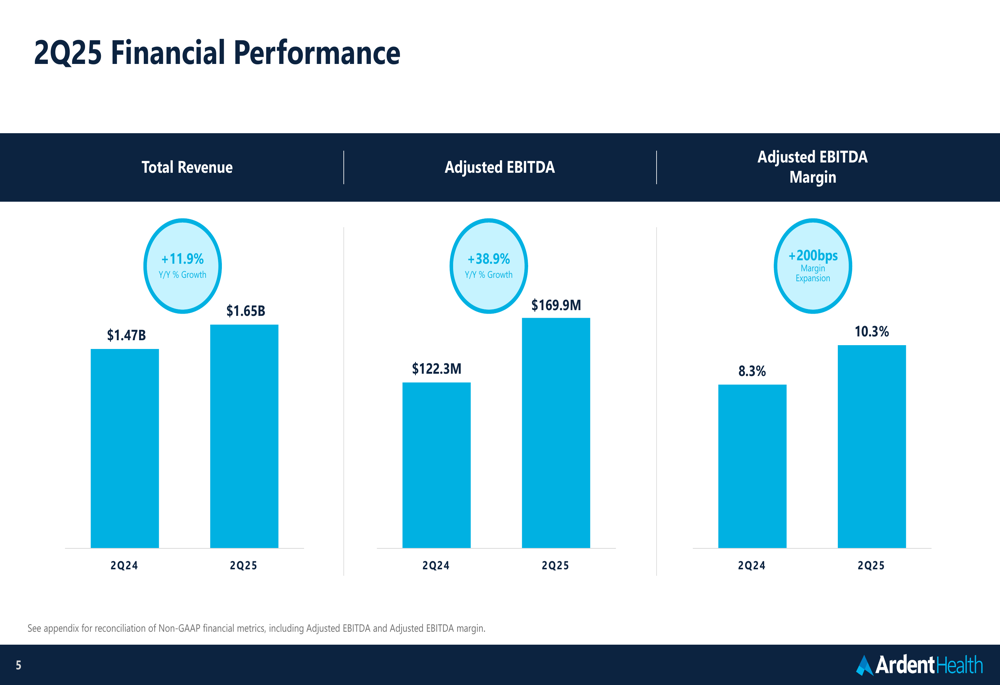
The company’s profitability metrics showed notable improvement, with adjusted EBITDA margin expanding 200 basis points year-over-year to reach 10.3% in Q2 2025. This margin expansion reflects Ardent’s ability to effectively manage costs while growing revenue.
For the first half of 2025, Ardent reported total revenue of $3.143 billion, up 8.0% year-over-year, while adjusted EBITDA reached $268 million, representing a 22.9% increase compared to the same period in 2024.
Detailed Financial Analysis
Ardent’s operational metrics revealed mixed but generally positive trends. Admissions increased 6.6% year-over-year to 41,535, while adjusted admissions grew at a more modest 1.6% to 87,167. The company demonstrated strong pricing power, with net patient service revenue per adjusted admission increasing 10.2% to $18,581.
The following chart illustrates these key operational metrics:
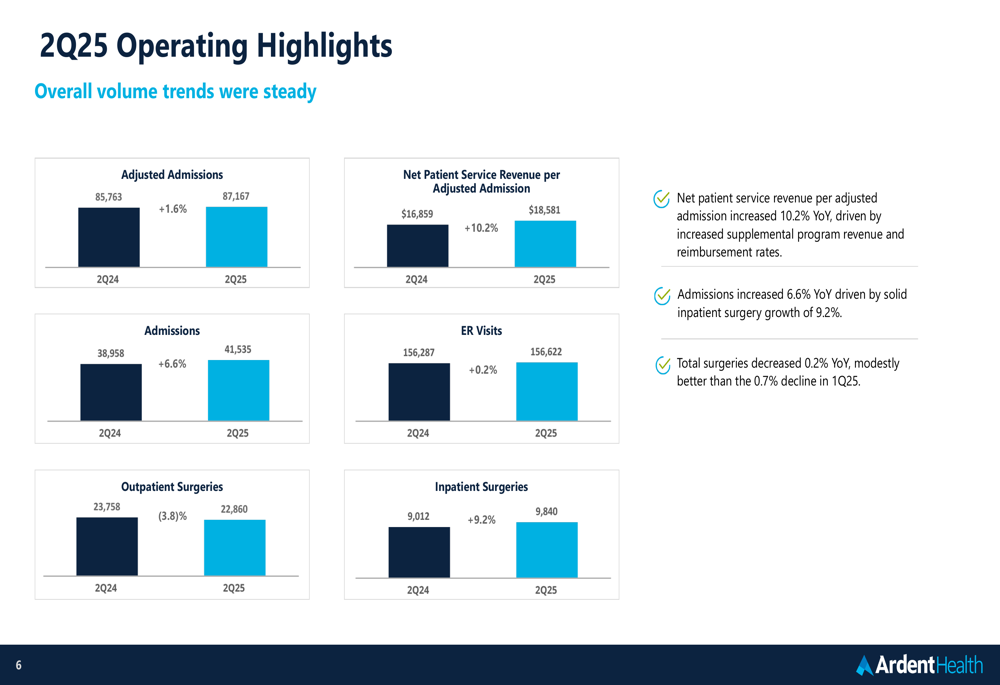
Inpatient surgeries showed robust growth of 9.2% year-over-year, reaching 9,840 procedures. However, outpatient surgeries declined by 3.8% to 22,860, though management noted this represented an improvement from the previous quarter’s trend. Emergency room visits remained essentially flat with a minimal 0.2% increase.
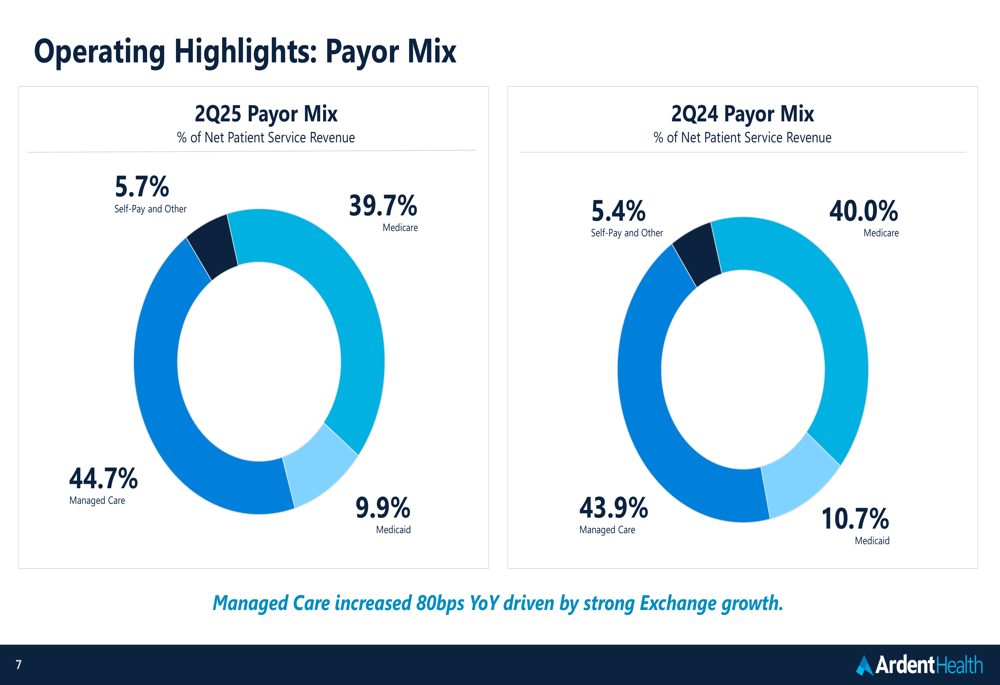
Ardent’s payor mix showed a favorable shift toward managed care, which increased by 80 basis points year-over-year to represent 44.7% of net patient service revenue. This growth was primarily driven by strong performance in Exchange plans. Medicare remained the second-largest payor category at 39.7%, a slight decrease from 40.0% in the prior year.
The company’s payor mix is illustrated in the following chart:
Strategic Initiatives & Balance Sheet Strength
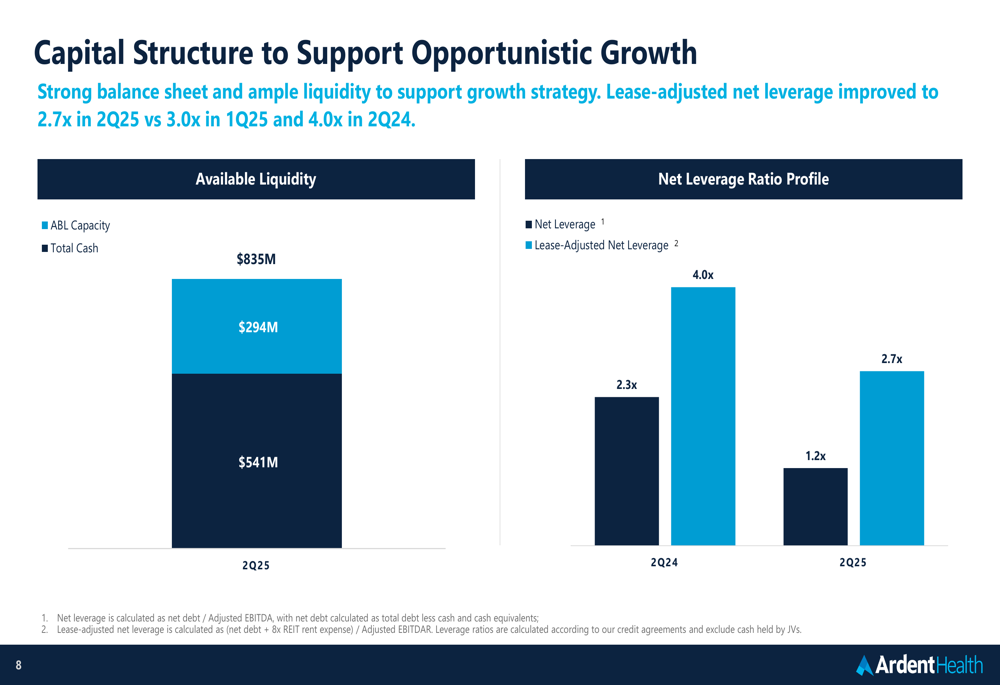
Ardent Health continues to strengthen its financial position, reporting total available liquidity of $835 million, consisting of $294 million in cash and $541 million in ABL capacity. The company has made significant progress in reducing leverage, with its net leverage ratio improving to 1.2x in Q2 2025 from 2.3x in Q2 2024. Similarly, the lease-adjusted net leverage ratio improved to 2.7x from 4.0x in the prior year.
This improvement continues the positive trend seen in Q1, when the company reported a net leverage ratio of 1.4x and lease-adjusted ratio of 3.0x. The strengthened balance sheet provides Ardent with greater financial flexibility to pursue growth opportunities.
The following chart details the company’s improved capital structure:
This financial strength follows S&P’s credit rating upgrade to B+ announced during the previous quarter, further validating the company’s improved financial health.
Forward-Looking Statements
Ardent Health reaffirmed its full-year 2025 guidance, projecting total revenue between $6.2 billion and $6.45 billion and adjusted EBITDA between $575 million and $615 million. At the midpoint, this guidance represents a 6% year-over-year revenue growth and 19% adjusted EBITDA growth, with implied adjusted EBITDAR margin expansion of 110 basis points.
The detailed guidance is presented in the following chart:
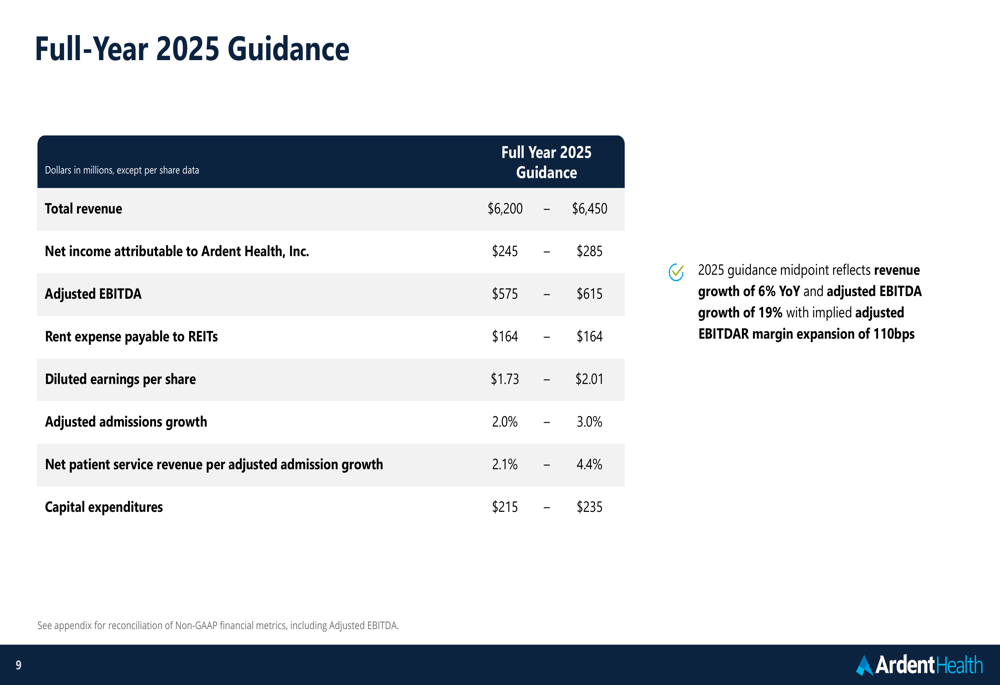
The company expects adjusted admissions growth of 2.0% to 3.0% for the full year, with net patient service revenue per adjusted admission projected to increase between 2.1% and 4.4%. Capital expenditures are expected to range from $215 million to $235 million.
Ardent’s strong Q2 performance positions the company well to achieve its full-year targets, with first-half results showing accelerating momentum. The reaffirmed guidance suggests management’s confidence in continued operational execution despite ongoing challenges in the healthcare sector.
While Ardent’s stock has struggled this year, trading well below its 52-week high of $20.72, the strong Q2 results and positive after-hours trading reaction suggest investors may be beginning to recognize the company’s improving fundamentals and growth trajectory.
Full presentation:
This article was generated with the support of AI and reviewed by an editor. For more information see our T&C.