Oklo stock tumbles as Financial Times scrutinizes valuation

Introduction & Market Context
Armstrong World Industries (NYSE:AWI) presented its second quarter 2025 results on July 29, showcasing strong performance across both business segments. The ceiling and wall solutions provider reported significant growth in revenue and earnings, leading management to raise its full-year guidance. The company’s stock closed at $195.85 on October 14, 2025, up 2.29% for the day and trading near its 52-week high of $201.72.
The results come amid what the company describes as challenging market conditions, with expectations for a softer second half of 2025. Despite these headwinds, Armstrong’s strategic initiatives and recent acquisitions have positioned it for continued growth.
Quarterly Performance Highlights
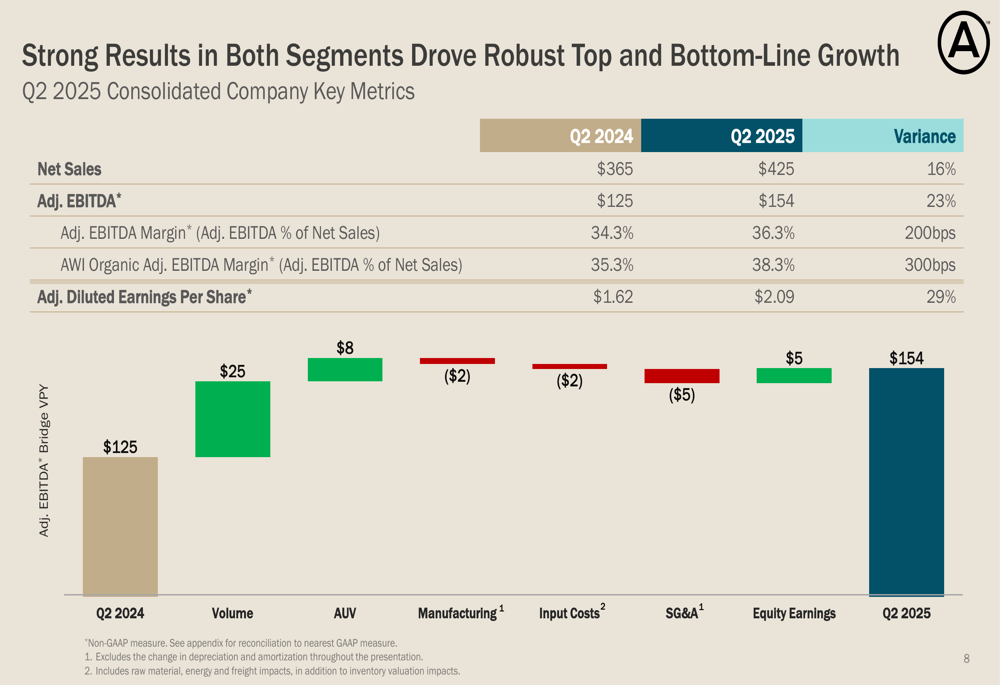
Armstrong reported impressive financial results for Q2 2025, with net sales reaching $424.6 million, a 16% increase compared to the same period last year. Adjusted EBITDA grew even faster at 23% year-over-year to $154 million, with margin expanding 200 basis points to 36.3%.
As shown in the following summary of key financial metrics, the company delivered strong growth across all major indicators:
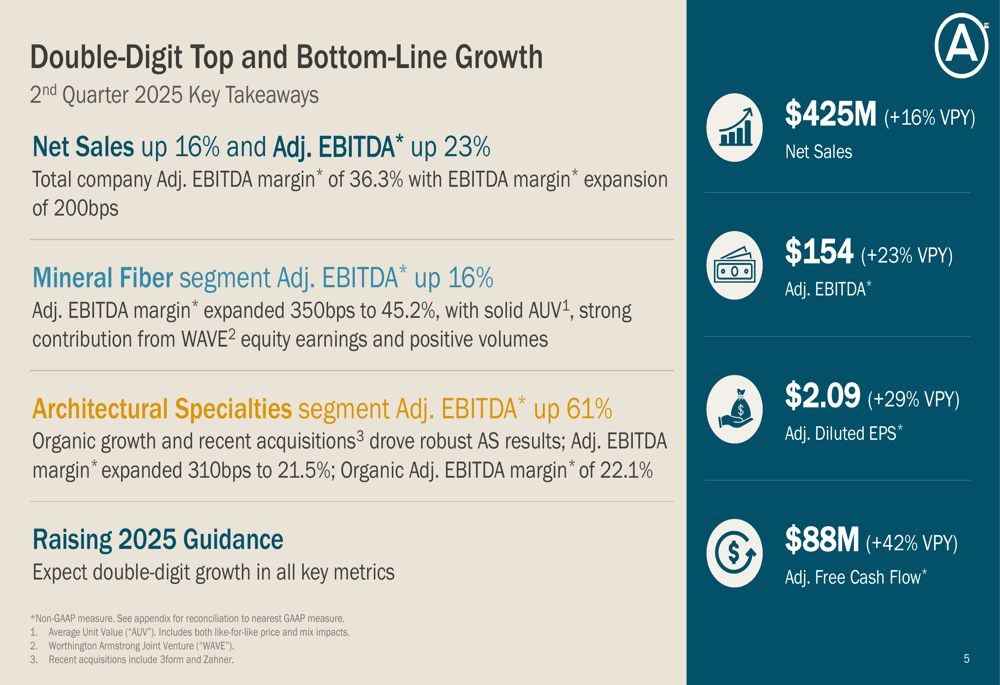
Adjusted diluted earnings per share increased 29% to $2.09, while adjusted free cash flow surged 42% to $88 million compared to Q2 2024. These results reflect Armstrong’s ability to drive both top-line growth and operational efficiency.
The company’s performance bridge analysis illustrates how volume growth, pricing power, and equity earnings contributed to the substantial EBITDA improvement:
Segment Analysis
Mineral Fiber Segment
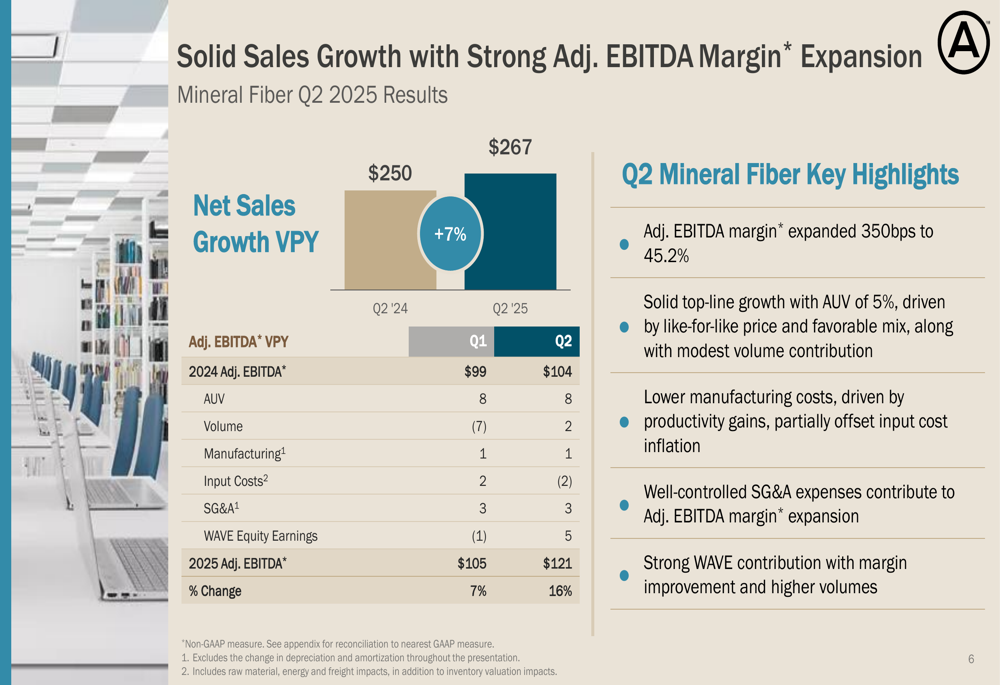
The Mineral Fiber segment, which represents approximately 63% of total sales, delivered solid results with net sales of $267 million, up 7% compared to Q2 2024. The segment’s adjusted EBITDA margin expanded significantly by 350 basis points to an impressive 45.2%.
This performance was driven by several factors, including:
- 5% increase in Average Unit Value (AUV), reflecting successful pricing strategies and favorable product mix
- Modest volume growth contribution
- Lower manufacturing costs from productivity gains
- Well-controlled SG&A expenses
- Strong contribution from WAVE joint venture equity earnings
The following chart illustrates the segment’s performance:
Architectural Specialties Segment
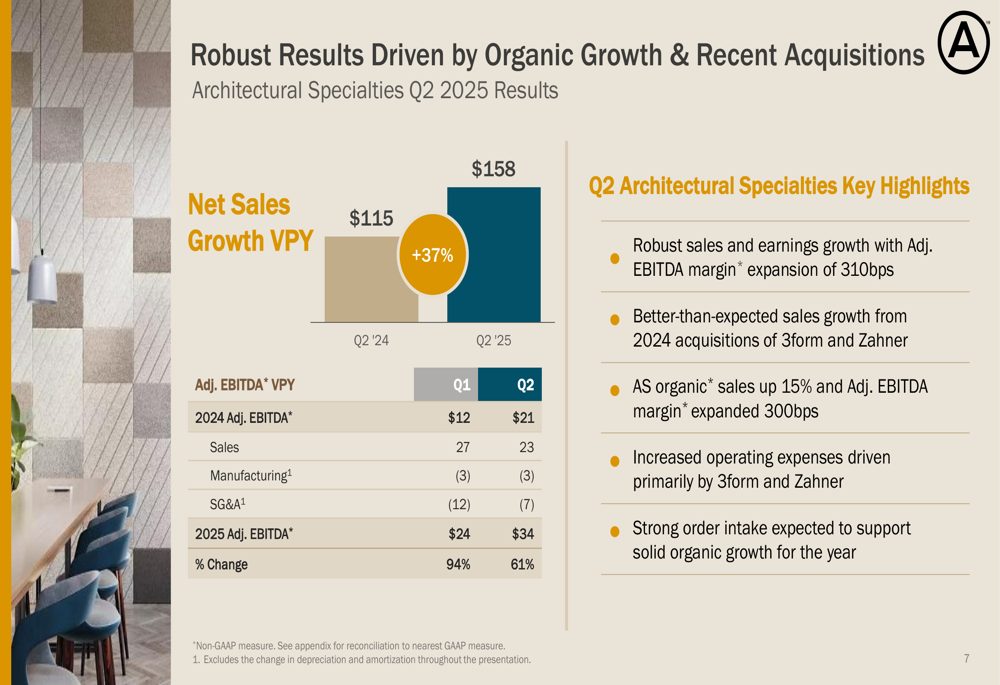
The Architectural Specialties segment demonstrated exceptional growth with net sales of $158 million, a 37% increase compared to Q2 2024. The segment’s adjusted EBITDA margin expanded by 310 basis points to 21.5%.
This robust performance was driven by:
- 15% organic sales growth
- Better-than-expected contribution from the 2024 acquisitions of 3form and Zahner
- Strong order intake supporting solid organic growth outlook
The following visualization highlights the segment’s impressive growth trajectory:
Raised Guidance and Outlook
Based on the strong first-half performance, Armstrong has raised its full-year 2025 guidance across all key metrics. The company now expects:
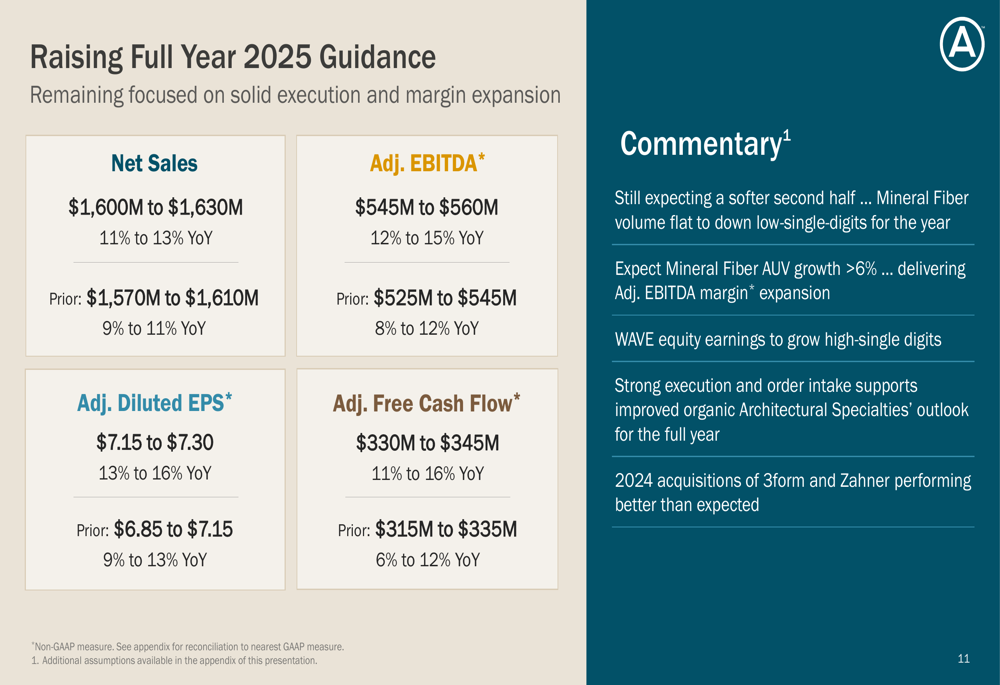
The revised guidance represents significant increases from previous projections:
- Net sales growth raised to 11-13% (from 9-11%)
- Adjusted EBITDA growth increased to 12-15% (from 8-12%)
- Adjusted diluted EPS growth elevated to 13-16% (from 9-13%)
- Adjusted free cash flow growth improved to 11-16% (from 6-12%)
Management commentary indicates that while they expect a softer second half of the year with Mineral Fiber volume flat to down low-single-digits for the full year, strong execution and order intake support the improved outlook, particularly in the Architectural Specialties segment.
Capital Allocation and Cash Flow
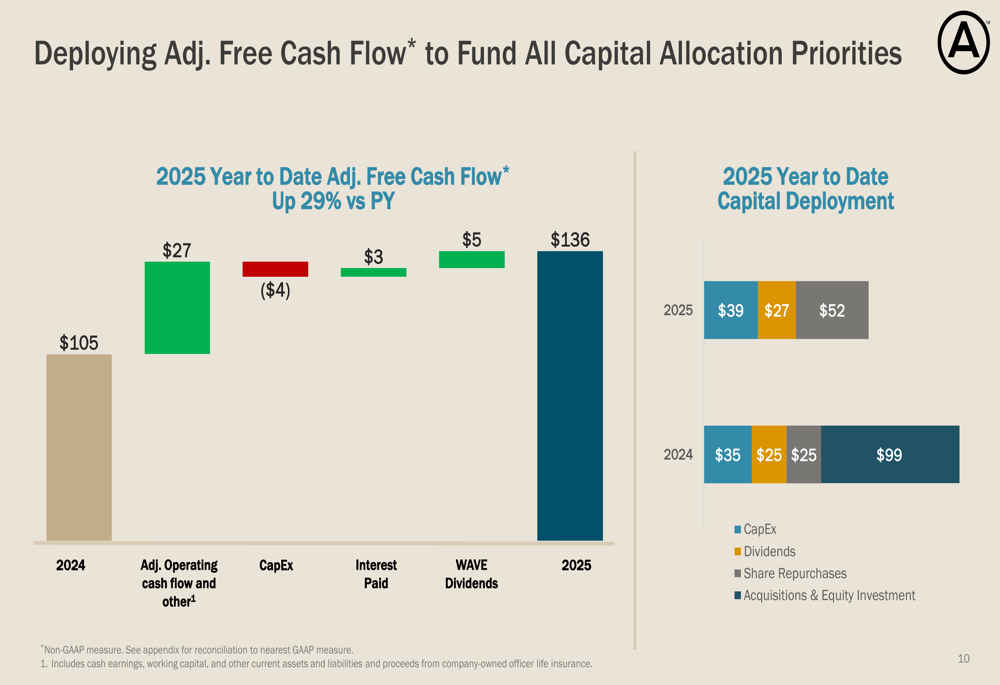
Armstrong continues to generate strong cash flow, with year-to-date adjusted free cash flow up 29% compared to the prior year. The company is deploying this cash across multiple priorities, including capital expenditures, dividends, and share repurchases.
As shown in the following chart, share repurchases have more than doubled in 2025 compared to the same period in 2024:
For the full year 2025, Armstrong has updated its assumptions for both segments and consolidated metrics:
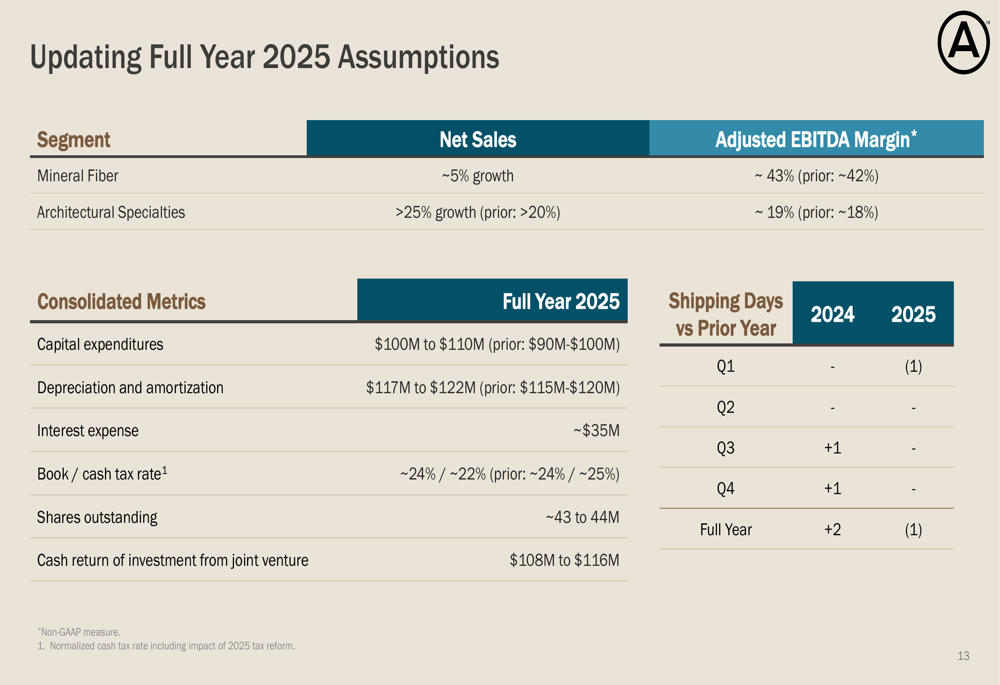
The company’s capital allocation strategy reflects confidence in its long-term growth prospects, with increased investments in both organic growth initiatives and shareholder returns.
Strategic Initiatives
Armstrong’s performance is supported by several strategic initiatives, including product innovations and recent acquisitions. The 2024 acquisitions of 3form and Zahner are performing better than expected, contributing significantly to the Architectural Specialties segment’s growth.
The company continues to focus on margin expansion through pricing strategies, favorable product mix, and operational efficiencies. Despite input cost inflation, Armstrong has successfully expanded margins across both business segments.
Looking ahead, Armstrong remains well-positioned to capitalize on renovation opportunities in its installed base, with energy-saving products and e-commerce platform expansion expected to drive future growth.
Full presentation:
This article was generated with the support of AI and reviewed by an editor. For more information see our T&C.