AZTR receives NYSE delisting warning over equity requirement

Executive Summary
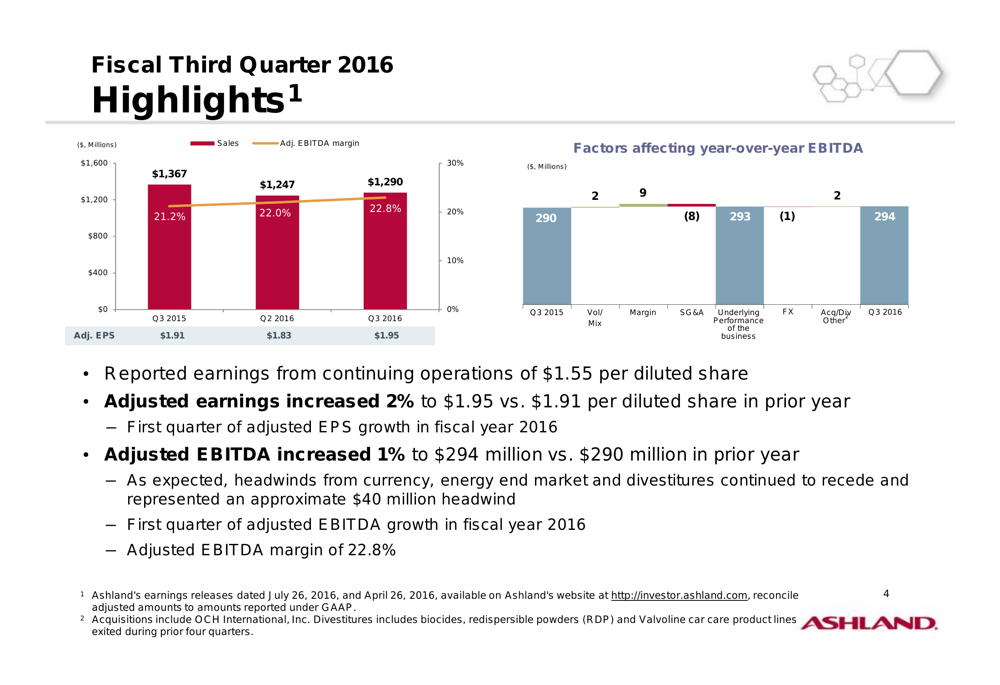
Ashland Inc . (NYSE:ASH) reported its fiscal third-quarter 2016 results on July 26, 2016, showing modest growth with adjusted earnings per share rising 2% year-over-year to $1.95 and adjusted EBITDA increasing 1% to $294 million. This marks the first quarter of year-over-year EBITDA growth in fiscal 2016 for the specialty chemicals company, which is currently progressing with its planned separation of the Valvoline (NYSE:VVV) business.
The company reported sales of $1.29 billion, down 6% from the prior year, with headwinds from currency, energy markets, and divestitures representing approximately $40 million in sales impact. Despite the revenue decline, Ashland improved its adjusted EBITDA margin to 22.8%, up 160 basis points from the prior-year quarter.
As shown in the following chart of quarterly performance metrics, Ashland demonstrated sequential improvement in several key areas:
Quarterly Performance Highlights
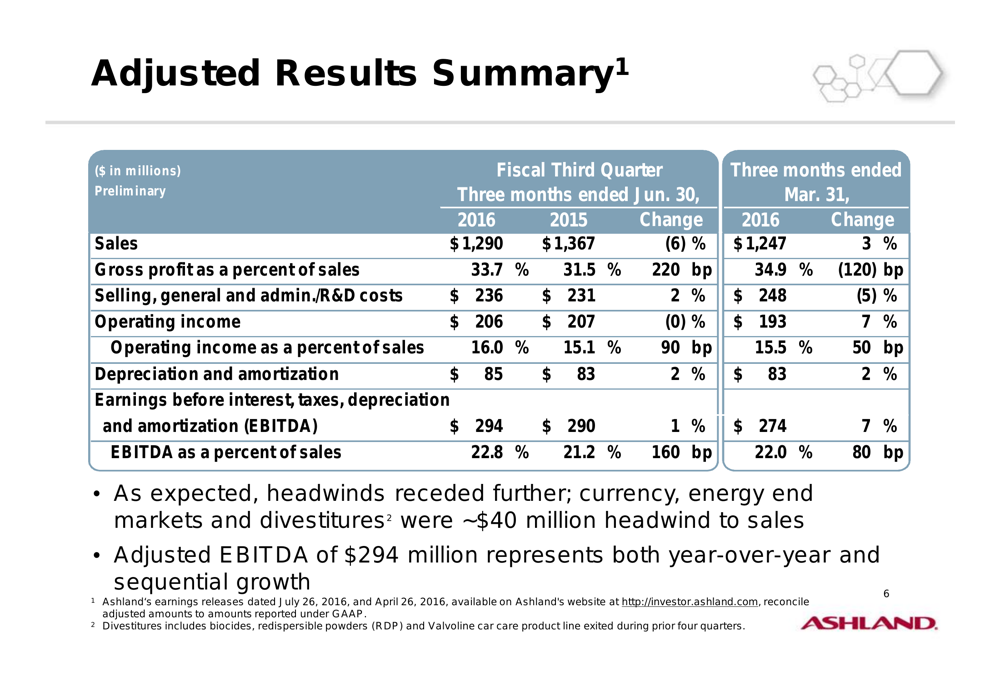
Ashland’s adjusted results for the third quarter showed mixed performance across metrics. While sales declined 6% year-over-year to $1.29 billion, gross profit as a percentage of sales improved by 220 basis points to 33.7%. Operating income remained flat at $206 million, while EBITDA increased slightly by 1% to $294 million.
The company’s EBITDA margin expansion was particularly noteworthy, improving to 22.8% from 21.2% in the prior-year quarter. This improvement came despite continued headwinds, which the company noted had receded further compared to previous quarters.
The following table provides a comprehensive view of Ashland’s adjusted results:
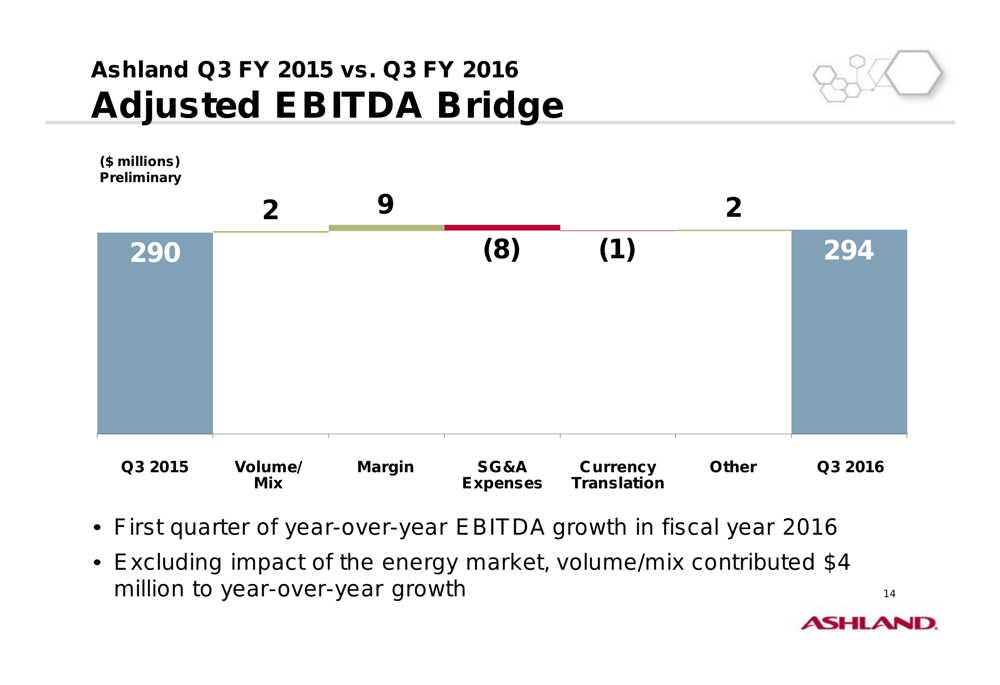
A closer examination of the factors affecting year-over-year EBITDA reveals that volume/mix contributed $9 million and margin improvements added $2 million, while SG&A performance was an $8 million headwind. The following bridge chart illustrates these dynamics:
Segment Performance
Ashland’s three business segments delivered varying results in the third quarter:
Ashland Specialty Ingredients, the company’s largest segment representing 42% of sales and 46% of adjusted EBITDA, reported sales of $552 million, down 5% year-over-year. Adjusted EBITDA for this segment decreased 7% to $128 million, with EBITDA margin contracting slightly to 23.2%. The company noted that while it saw growth in numerous core and niche end markets, overall results did not meet expectations due to weakness in emerging regions.
Ashland Performance Materials posted sales of $238 million, down 14% year-over-year, but managed to increase adjusted EBITDA by 11% to $30 million. This segment’s EBITDA margin expanded significantly by 290 basis points to 12.6%, reflecting pricing discipline despite generally soft volumes across all global regions.
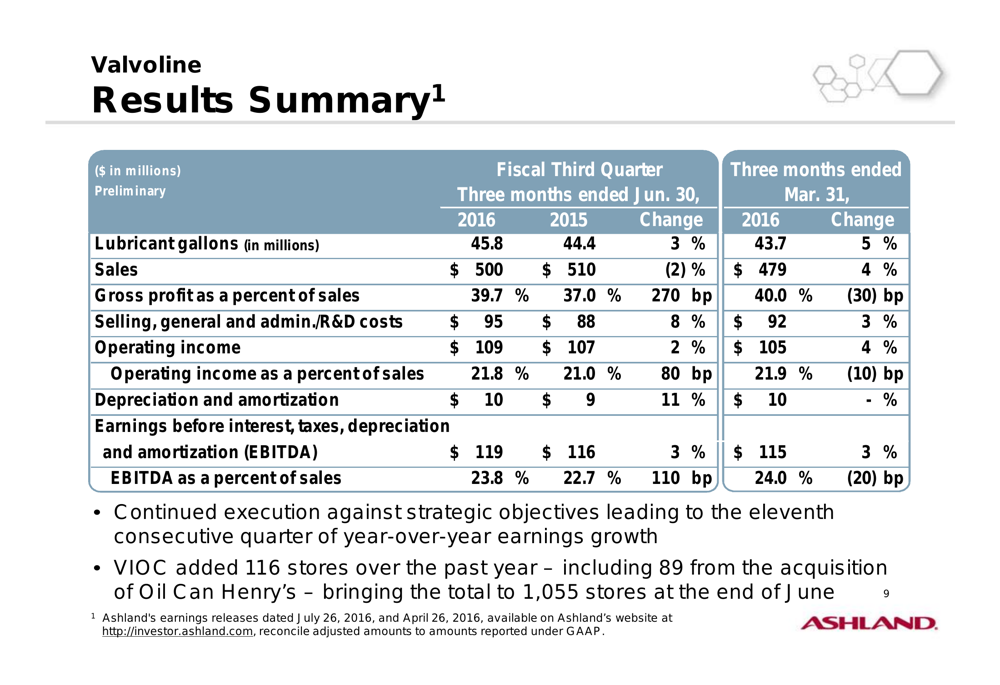
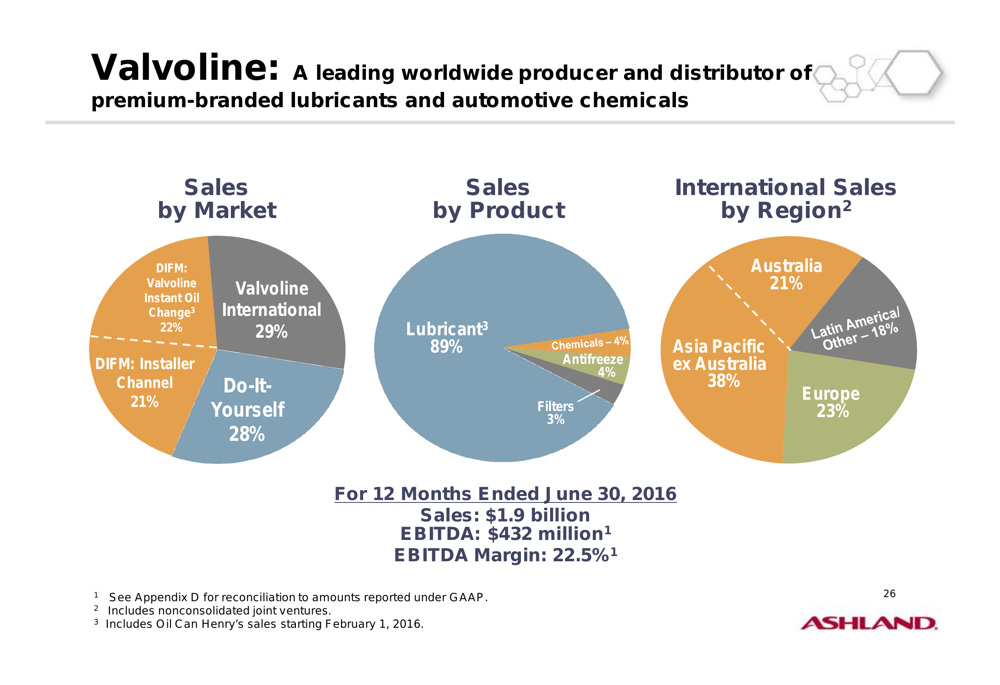
Valvoline continued its strong performance with sales of $500 million, down 2% year-over-year, but with adjusted EBITDA growing 3% to $119 million. This marked the eleventh consecutive quarter of year-over-year earnings growth for Valvoline. The segment’s EBITDA margin improved by 110 basis points to 23.8%.
The following chart details Valvoline’s performance metrics:
Valvoline’s Growth Strategy
Valvoline’s consistent performance stands out in Ashland’s portfolio. During the quarter, Valvoline added 116 stores over the past year – including 89 from the acquisition of Oil Can Henry’s – bringing the total to 1,055 stores at the end of June. This expansion aligns with Valvoline’s strategy to grow its Do-It-For-Me (DIFM) service model.
The segment’s business profile shows a balanced approach across markets, with DIFM channels (Valvoline Instant Oil Change and Installer Channel) representing 43% of sales, Do-It-Yourself at 28%, and Valvoline International at 29%. Lubricants dominate the product mix at 89%.
As shown in the following business profile:
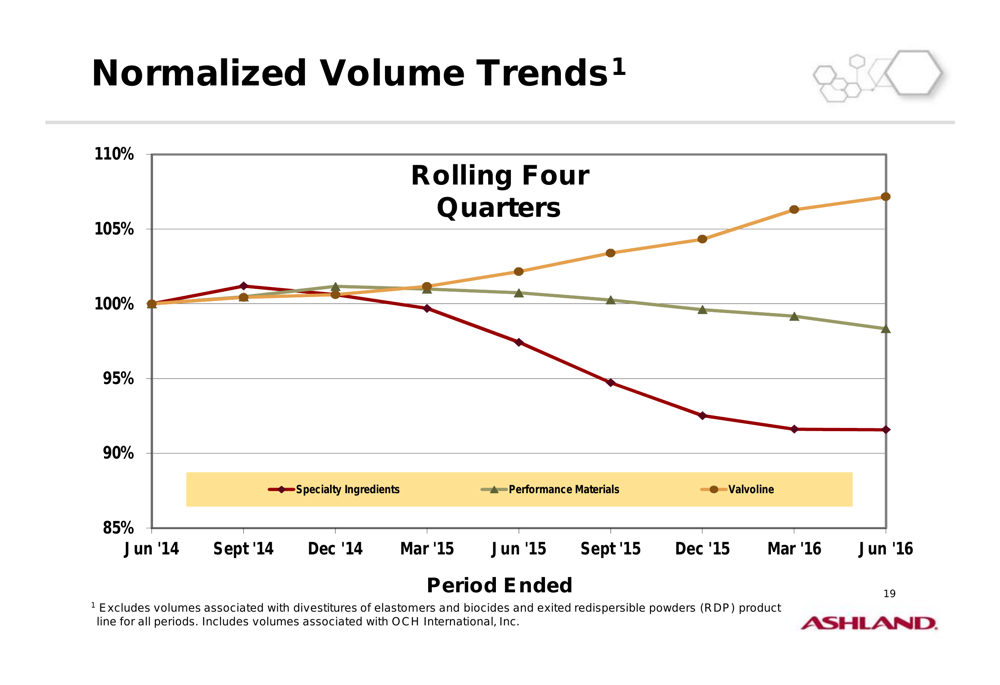
Volume trends over time further illustrate Valvoline’s growth trajectory compared to Ashland’s other segments. While Specialty Ingredients volumes have declined to approximately 92% of baseline (June 2014) and Performance Materials has contracted slightly to 98%, Valvoline has grown to 107% of baseline volumes.
Separation Progress
Ashland provided updates on significant milestones in its plan to separate Valvoline into an independent company. The company announced an amendment to its senior unsecured credit agreement and the establishment of a new $1.325 billion five-year Valvoline credit agreement, including a $450 million revolver and $875 million term loan.
Additionally, Ashland completed a new 5.5% Valvoline senior bond offering due in 2024 with $375 million aggregate principal amount. The company plans to use these debt proceeds to reduce Ashland debt by approximately $1 billion, signaling progress in the financial restructuring necessary for the separation.
Financial Position
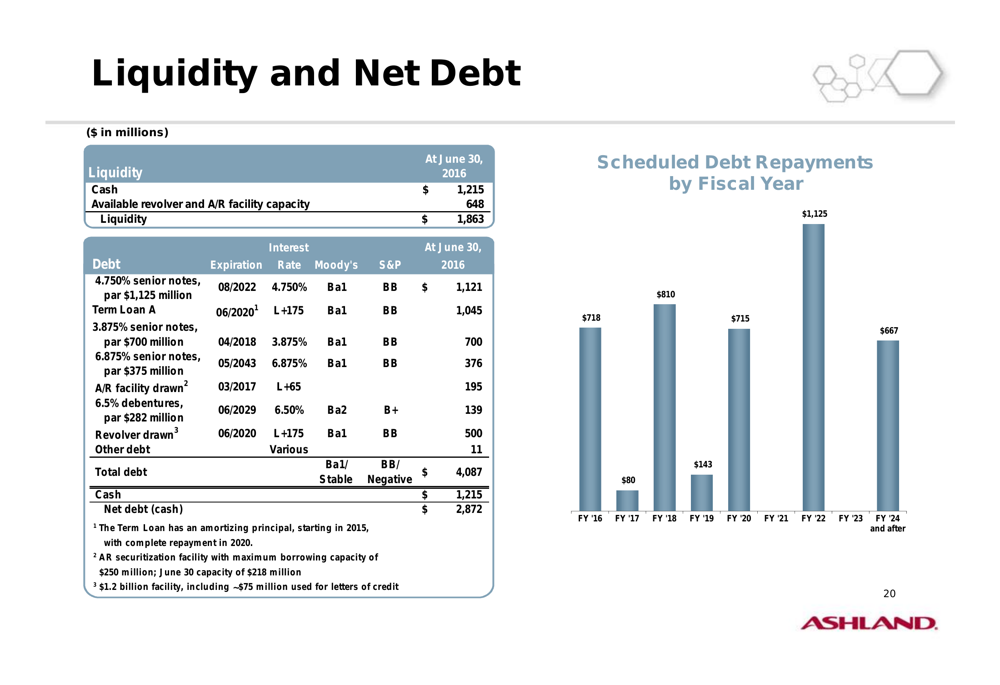
Ashland reported strong liquidity of $1.863 billion, including $1.215 billion in cash and $648 million in available revolver and accounts receivable facility capacity. The company’s total debt stood at $4.087 billion, resulting in net debt of $2.872 billion.
The company’s debt maturity profile shows significant repayments scheduled in fiscal years 2017-2019, with more than $700 million due in each of those years. The debt reduction plan associated with the Valvoline separation is expected to address a portion of these obligations.
The following chart details Ashland’s liquidity and debt position:
Corporate Structure and Geographic Presence
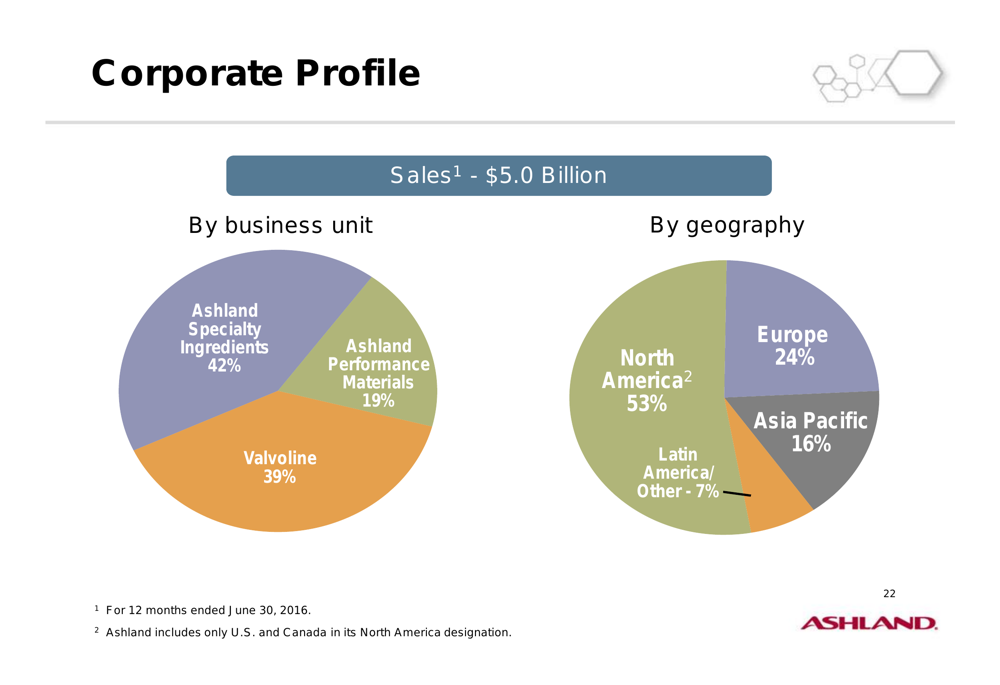
Ashland’s corporate profile reveals a balanced business mix across its three segments. Based on sales, Specialty Ingredients represents 42% of the company, Valvoline 39%, and Performance Materials 19%. From an adjusted EBITDA perspective, Specialty Ingredients contributes 46%, Valvoline 41%, and Performance Materials 13%.
Geographically, North America accounts for 53% of sales, with Europe at 24%, Asia Pacific at 16%, and Latin America/Other at 7%. The company employs approximately 11,000 people and has sales in more than 100 countries.
As shown in the following corporate profile based on sales:
Forward Outlook
While Ashland did not provide specific guidance for the full fiscal year in the presentation, management noted several expectations for fiscal 2016:
- Adjusted effective tax rate at the upper end of the 25%-26% range
- Capital expenditures at the lower end of the $320-$340 million range
- Operating cash flow of $580-$600 million
- Free cash flow of $260-$280 million
The company’s focus remains on completing the separation of Valvoline while managing through market headwinds in certain segments. The improved performance in the third quarter, particularly the return to year-over-year EBITDA growth, suggests some stabilization in Ashland’s core businesses despite ongoing challenges in emerging markets and currency impacts.
Full presentation:
This article was generated with the support of AI and reviewed by an editor. For more information see our T&C.